Estimated zip code population in 2022: 1,511 Zip code population in 2010: 1,217 Zip code population in 2000: 1,091
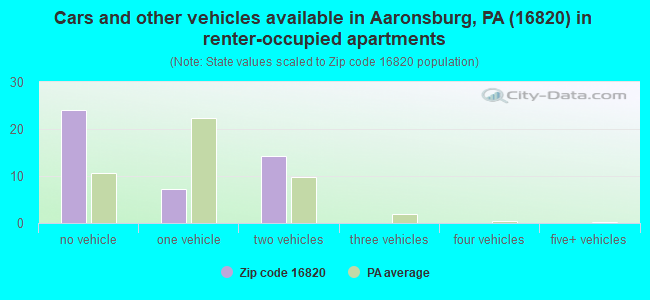
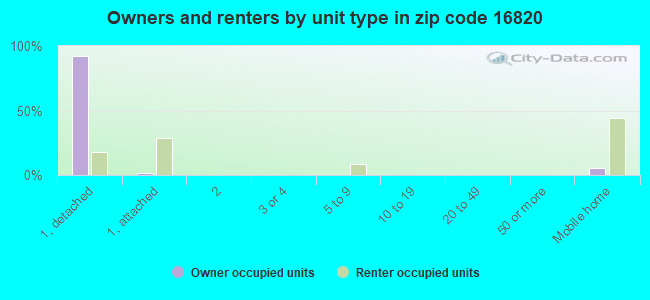
Houses and condos: 468 Renter-occupied apartments: 46
% of renters here:
11%
State:
31%
March 2022 cost of living index in zip code 16820: 92.0 (less than average, U.S. average is 100)
Land area: 28.4 sq. mi. Water area: 0.0 sq. mi.
Population density: 53 people per square mile
(very low).
OSM Map
General Map
Google Map
MSN Map
OSM Map
General Map
Google Map
MSN Map
OSM Map
General Map
Google Map
MSN Map
OSM Map
General Map
Google Map
MSN Map
Please wait while loading the map...
Real estate property taxes paid for housing units in 2022:
This zip code:
1.1% ($2,449)
Pennsylvania:
1.3% ($3,094)
Median real estate property taxes paid for housing units with mortgages in 2022: $3,350 (1.1%) Median real estate property taxes paid for housing units with no mortgage in 2022: $1,289 (1.0%)
Business Search- 14 Million verified businesses
Males: 784
(51.9%)
Females: 727
(48.1%)
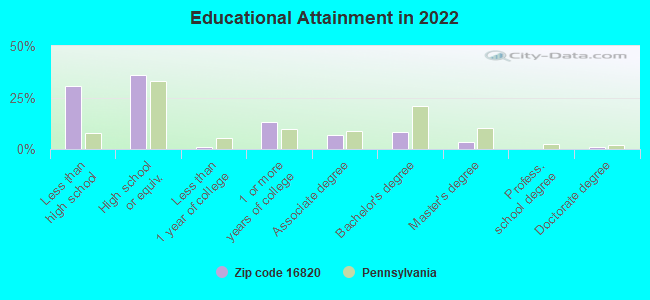
For population 25 years and over in 16820:
High school or higher: 65.8%
Bachelor's degree or higher: 12.1%
Graduate or professional degree: 4.3%
Unemployed: 2.4%
Mean travel time to work (commute): 25.7 minutes
For population 15 years and over in 16820:
Never married: 28.0%
Now married: 58.9%
Separated: 1.1%
Widowed: 1.8%
Divorced: 10.1%
Zip code 16820 compared to state average:
Unemployed percentage below state average.
Black race population percentage significantly below state average.
Hispanic race population percentage significantly below state average.
Median age significantly below state average.
Foreign-born population percentage significantly below state average.
Renting percentage significantly below state average.
Number of college students significantly below state average.
Percentage of population with a bachelor's degree or higher significantly below state average.
Averages for the 2020 tax year for zip code 16820, filed in 2021:
Average Adjusted Gross Income (AGI) in 2020: $48,542 (Individual Income Tax Returns)
Here:
$48,542
State:
$75,707
Salary/wage: $43,592 (reported on 75.0% of returns)
Here:
$43,592
State:
$62,806
(% of AGI for various income ranges: 1030.0% for AGIs below $25k, 3553.6% for AGIs $25k-50k, 5824.3% for AGIs $50k-75k, 9083.3% for AGIs $75k-100k, 13150.0% for AGIs $100k-200k)
Taxable interest for individuals: $519 (reported on 30.8% of returns)
This zip code:
$519
Pennsylvania:
$1,633
(% of AGI for various income ranges: 25.0% for AGIs below $25k, 9.1% for AGIs $25k-50k, 52.9% for AGIs $50k-75k, 27.5% for AGIs $100k-200k)
Ordinary dividends: $1,757 (reported on 13.5% of returns)
Here:
$1,757
State:
$7,382
(% of AGI for various income ranges: 67.3% for AGIs $25k-50k, 163.3% for AGIs $75k-100k)
Net capital gain/loss in AGI: +$2,083 (reported on 11.5% of returns)
Here:
+$2,083
State:
+$23,522
(% of AGI for various income ranges: 61.8% for AGIs $25k-50k, 190.0% for AGIs $75k-100k)
Profit/loss from business: +$8,890 (reported on 19.2% of returns)
Here:
+$8,890
State:
+$16,274
(% of AGI for various income ranges: 312.0% for AGIs below $25k, 259.1% for AGIs $25k-50k, 973.3% for AGIs $75k-100k)
Taxable individual retirement arrangement distribution: $9,433 (reported on 11.5% of returns)
16820:
$9,433
Pennsylvania:
$18,583
(% of AGI for various income ranges: 151.0% for AGIs below $25k, 592.9% for AGIs $50k-75k)
Earned income credit: $2,217 (reported on 11.5% of returns)
Here:
$2,217
State:
$2,100
(% of AGI for various income ranges: 63.0% for AGIs below $25k, 63.6% for AGIs $25k-50k)
Percentage of individuals using paid preparers for their 2020 taxes: 94.2%
Here:
94%
State:
92%
(% for various income ranges: 94.1% for AGIs below $25k, 93.3% for AGIs $25k-50k, 100.0% for AGIs $50k-75k, 80.0% for AGIs $75k-100k, 100.0% for AGIs $100k-200k)
Averages for the 2012 tax year for zip code 16820, filed in 2013:
Average Adjusted Gross Income (AGI) in 2012: $38,765 (Individual Income Tax Returns)
Here:
$38,765
State:
$61,346
Salary/wage: $37,203 (reported on 72.5% of returns)
Here:
$37,203
State:
$51,902
(% of AGI for various income ranges: 55.3% for AGIs below $25k, 74.2% for AGIs $25k-50k, 76.7% for AGIs $50k-75k, 74.8% for AGIs $75k-100k, 58.7% for AGIs $100k-200k)
Taxable interest for individuals: $528 (reported on 35.3% of returns)
This zip code:
$528
Pennsylvania:
$1,588
(% of AGI for various income ranges: 1.6% for AGIs below $25k, 0.4% for AGIs $25k-50k, 0.2% for AGIs $50k-75k, 0.6% for AGIs $75k-100k)
Ordinary dividends: $1,800 (reported on 13.7% of returns)
Here:
$1,800
State:
$5,827
Net capital gain/loss in AGI: +$1,867 (reported on 11.8% of returns)
Here:
+$1,867
State:
+$14,495
Profit/loss from business: +$7,573 (reported on 21.6% of returns)
Here:
+$7,573
State:
+$16,268
(% of AGI for various income ranges: 14.1% for AGIs below $25k, 3.2% for AGIs $25k-50k, 6.2% for AGIs $50k-75k)
Taxable individual retirement arrangement distribution: $5,250 (reported on 11.8% of returns)
16820:
$5,250
Pennsylvania:
$14,550
Total itemized deductions: $14,718 (22% of AGI, reported on 21.6% of returns)
Here:
$14,718
State:
$23,538
Here:
22.1% of AGI
State:
18.4% of AGI
(% of AGI for various income ranges: 9.9% for AGIs $25k-50k, 9.9% for AGIs $50k-75k, 17.2% for AGIs $75k-100k)
Charity contributions: $1,743 (reported on 13.7% of returns)
Here:
$1,743
State:
$4,025
Taxes paid: $5,518 (reported on 21.6% of returns)
16820:
$5,518
State:
$9,982
(% of AGI for various income ranges: 2.8% for AGIs $25k-50k, 3.7% for AGIs $50k-75k, 7.4% for AGIs $75k-100k)
Earned income credit: $1,786 (reported on 13.7% of returns)
Here:
$1,786
State:
$2,106
(% of AGI for various income ranges: 3.0% for AGIs below $25k, 1.0% for AGIs $25k-50k)
Percentage of individuals using paid preparers for their 2012 taxes: 66.7%
Here:
67%
State:
53%
(% for various income ranges: 68.2% for AGIs below $25k, 66.7% for AGIs $25k-50k, 55.6% for AGIs $50k-75k, 60.0% for AGIs $75k-100k, 100.0% for AGIs $100k-200k)
Averages for the 2004 tax year for zip code 16820, filed in 2005:
Average Adjusted Gross Income (AGI) in 2004: $35,219 (Individual Income Tax Returns)
Here:
$35,219
State:
$48,049
Salary/wage: $33,636 (reported on 73.3% of returns)
Here:
$33,636
State:
$42,646
(% of AGI for various income ranges: 135.3% for AGIs below $10k, 60.7% for AGIs $10k-25k, 72.4% for AGIs $25k-50k, 76.8% for AGIs $50k-75k, 71.8% for AGIs $75k-100k, 56.5% for AGIs over 100k)
Taxable interest for individuals: $798 (reported on 56.1% of returns)
This zip code:
$798
Pennsylvania:
$1,657
(% of AGI for various income ranges: 12.7% for AGIs below $10k, 2.2% for AGIs $10k-25k, 1.4% for AGIs $25k-50k, 0.6% for AGIs $50k-75k, 0.4% for AGIs $75k-100k, 1.3% for AGIs over 100k)
Taxable dividends: $1,400 (reported on 20.4% of returns)
Here:
$1,400
State:
$3,566
(% of AGI for various income ranges: 7.5% for AGIs below $10k, 1.1% for AGIs $10k-25k, 0.5% for AGIs $25k-50k, 0.2% for AGIs $50k-75k, 2.6% for AGIs $75k-100k)
Net capital gain/loss: +$4,550 (reported on 18.1% of returns)
Here:
+$4,550
State:
+$9,716
(% of AGI for various income ranges: -5.8% for AGIs below $10k, 2.0% for AGIs $10k-25k, 1.2% for AGIs $25k-50k, 1.6% for AGIs $50k-75k, 8.3% for AGIs over 100k)
Profit/loss from business: +$5,916 (reported on 21.5% of returns)
Here:
+$5,916
State:
+$14,267
(% of AGI for various income ranges: 9.2% for AGIs below $10k, 13.1% for AGIs $10k-25k, 5.2% for AGIs $25k-50k, 1.0% for AGIs $50k-75k)
IRA payment deduction: $1,286 (reported on 3.2% of returns)
16820:
$1,286
Pennsylvania:
$2,903
Total itemized deductions: $13,571 (21% of AGI, reported on 23.8% of returns)
Here:
$13,571
State:
$18,804
Here:
20.7% of AGI
State:
19.5% of AGI
(% of AGI for various income ranges: 9.9% for AGIs $25k-50k, 10.8% for AGIs $50k-75k, 10.9% for AGIs $75k-100k, 11.8% for AGIs over 100k)
Charity contributions deductions: $1,276 (2% of AGI, reported on 17.2% of returns)
Here:
$1,276
State:
$3,337
Here:
1.8% of AGI
State:
3.3% of AGI
(% of AGI for various income ranges: 0.8% for AGIs $25k-50k, 0.2% for AGIs $50k-75k, 0.9% for AGIs $75k-100k, 1.2% for AGIs over 100k)
Total tax: $4,236 (reported on 72.9% of returns)
16820:
$4,236
State:
$8,008
(% of AGI for various income ranges: 6.9% for AGIs below $10k, 4.6% for AGIs $10k-25k, 6.0% for AGIs $25k-50k, 8.2% for AGIs $50k-75k, 12.0% for AGIs $75k-100k, 15.1% for AGIs over 100k)
Earned income credit: $1,580 (reported on 11.3% of returns)
Here:
$1,580
State:
$1,643
Percentage of individuals using paid preparers for their 2004 taxes: 71.3%
Here:
71%
State:
56%
(% for various income ranges: 77.9% for AGIs below $10k, 67.5% for AGIs $10k-25k, 76.8% for AGIs $25k-50k, 58.2% for AGIs $50k-75k, 69.2% for AGIs $75k-100k, 77.8% for AGIs over 100k)
Household received Food Stamps/SNAP in the past 12 months: 24 Household did not receive Food Stamps/SNAP in the past 12 months: 390
Women who had a birth in the past 12 months: 37 (40 now married, 0 unmarried) Women who did not have a birth in the past 12 months: 209 (109 now married, 99 unmarried)
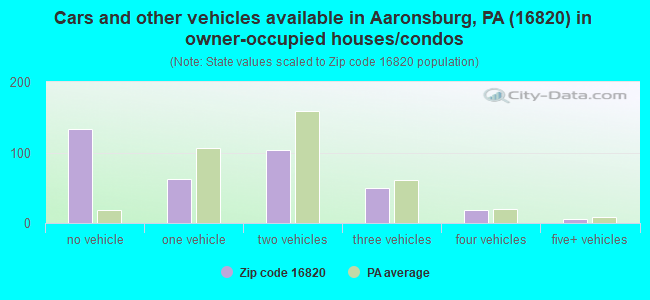
Housing units in zip code 16820 with a mortgage: 262 (32 second mortgage, 10 home equity loan, 7 both second mortgage and home equity loan) Houses without a mortgage: 1
Median monthly owner costs for units with a mortgage: $1,692 Median monthly owner costs for units without a mortgage: $326
Residents with income below the poverty level in 2022:
This zip code:
6.5%
Whole state:
11.8%
Residents with income below 50% of the poverty level in 2022:
This zip code:
5.4%
Whole state:
6.1%
Median number of rooms in houses and condos:
Here:
6.7
State:
6.8
Median number of rooms in apartments:
Here:
6.7
State:
4.3
Notable locations in this zip code not listed on our city pages
Size of family households: 95 2-persons, 28 3-persons, 59 4-persons, 7 5-persons, 50 6-persons, 70 7-or-more-persons
Size of nonfamily households: 86 1-person, 19 2-persons
690 married couples with children.
1 single-parent households (1 women).
39.6% of residents of 16820 zip code speak English at home.
0.7% of residents speak Spanish at home (100% very well).
59.0% of residents speak other Indo-European language at home (87% very well, 11% well, 2% not well).
Foreign born population: 13 (0.9%) (100.0% of them are naturalized citizens)
This zip code:
0.9%
Whole state:
7.5%
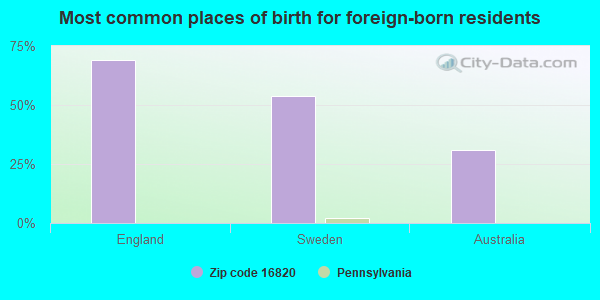
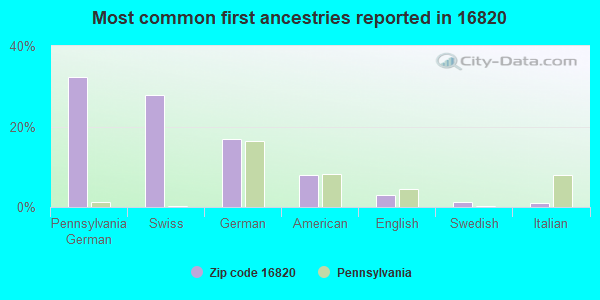
69%England
54%Sweden
31%Australia
32%Pennsylvania German
28%Swiss
17%German
8%American
3%English
1%Swedish
1%Italian
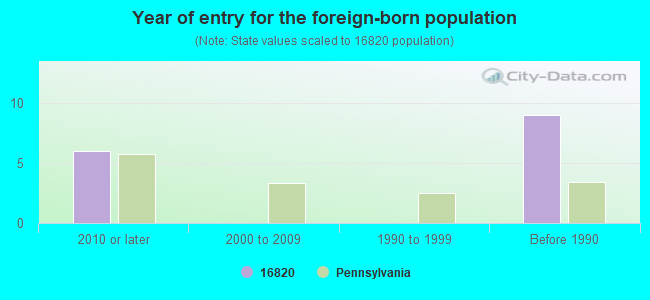
Year of entry for the foreign-born population
62010 or later
02000 to 2009
01990 to 1999
9Before 1990
Housing units lacking complete plumbing facilities: 8.0% Housing units lacking complete kitchen facilities: 6.2%
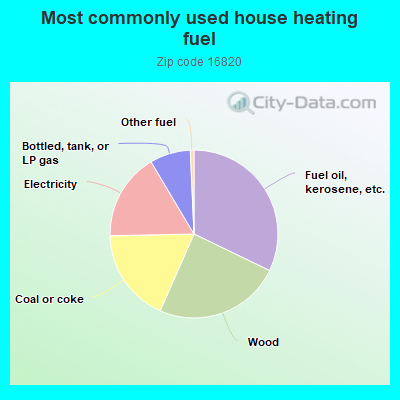
32.4%Fuel oil, kerosene, etc.
24.6%Wood
18.2%Coal or coke
16.9%Electricity
7.9%Bottled, tank, or LP gas
0.7%Other fuel
Population in 1990: 100. Population change in the 1990s: +991 (+991.0%).
Place of birth for U.S.-born residents:
This state: 1,460
Northeast: 3
Midwest: 9
South: 7
76% of the 16820 zip code residents lived in the same house 5 years ago. Out of people who lived in different houses, 74% lived in this county. Out of people who lived in different counties, 50% lived in Pennsylvania.
96% of the 16820 zip code residents lived in the same house 1 year ago. Out of people who lived in different houses, 79% moved from this county. Out of people who lived in different houses, 21% moved from different county within same state.
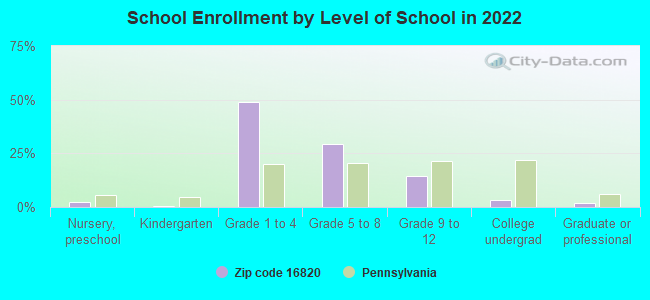
Private vs. public school enrollment:
Students in private schools in grades 1 to 8 (elementary and middle school): 308
Here:
87.8%
Pennsylvania:
15.7%
Students in private schools in grades 9 to 12 (high school): 34
Here:
55.1%
Pennsylvania:
13.4%
Students in private undergraduate colleges: 3
Here:
20.1%
Pennsylvania:
39.8%
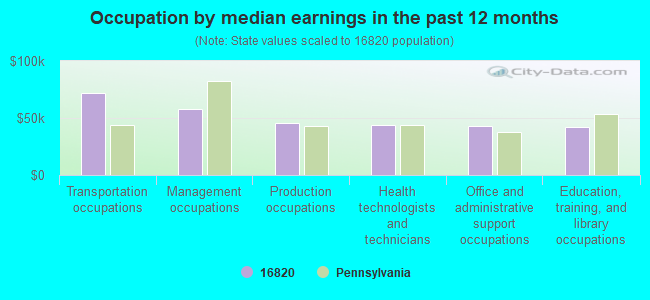
Occupation by median earnings in the past 12 months ($)
71,827Transportation occupations
57,708Management occupations
45,989Production occupations
44,013Health technologists and technicians
42,756Office and administrative support occupations
42,464Education, training, and library occupations
Top industries in this zip code by the number of employees in 2005:
Construction: Plumbing, Heating, and Air-Conditioning Contractors (5-9 employees: 1 establishment)
Mining: Crushed and Broken Limestone Mining and Quarrying (5-9: 1)
Other Services (except Public Administration): General Automotive Repair (1-4: 2)
Other Services (except Public Administration): Religious Organizations (1-4: 1)
Arts, Entertainment, and Recreation: Museums (1-4: 1)
Wholesale Trade: Wholesale Trade Agents and Brokers (1-4: 1)
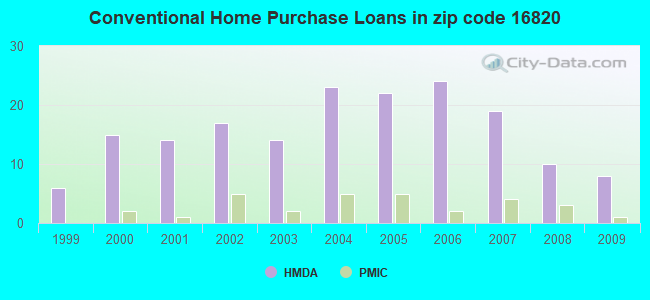
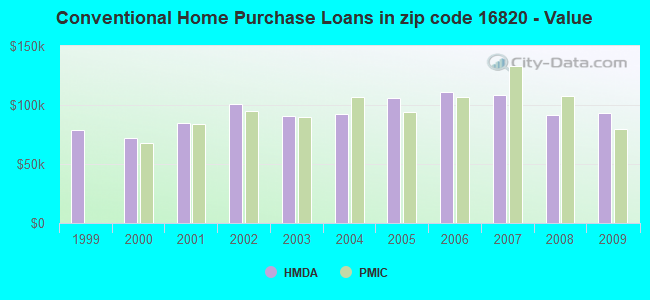
Home Mortgage Disclosure Act Aggregated Statistics For Year 2009 (Based on 2 partial tracts)
A) FHA, FSA/RHS & VA Home Purchase Loans
B) Conventional Home Purchase Loans
C) Refinancings
D) Home Improvement Loans
F) Non-occupant Loans on < 5 Family Dwellings (A B C & D)
G) Loans On Manufactured Home Dwelling (A B C & D)
Number
Average Value
Number
Average Value
Number
Average Value
Number
Average Value
Number
Average Value
Number
Average Value
LOANS ORIGINATED
6
$126,148
8
$93,186
37
$127,726
8
$36,255
3
$128,907
1
$143,360
APPLICATIONS APPROVED, NOT ACCEPTED
0
$0
0
$0
3
$83,690
0
$0
0
$0
0
$0
APPLICATIONS DENIED
1
$138,220
1
$119,470
11
$129,529
3
$67,760
1
$175,350
1
$93,370
APPLICATIONS WITHDRAWN
0
$0
0
$0
6
$170,322
0
$0
0
$0
0
$0
FILES CLOSED FOR INCOMPLETENESS
0
$0
0
$0
0
$0
0
$0
0
$0
0
$0
Aggregated Statistics For Year 2008 (Based on 2 partial tracts)
A) FHA, FSA/RHS & VA Home Purchase Loans
B) Conventional Home Purchase Loans
C) Refinancings
D) Home Improvement Loans
F) Non-occupant Loans on < 5 Family Dwellings (A B C & D)
G) Loans On Manufactured Home Dwelling (A B C & D)
Number
Average Value
Number
Average Value
Number
Average Value
Number
Average Value
Number
Average Value
Number
Average Value
LOANS ORIGINATED
3
$79,770
10
$91,459
28
$108,271
13
$39,871
4
$118,000
4
$55,692
APPLICATIONS APPROVED, NOT ACCEPTED
0
$0
0
$0
2
$121,310
1
$30,140
0
$0
0
$0
APPLICATIONS DENIED
1
$100,350
1
$167,260
18
$141,914
3
$50,973
0
$0
3
$81,240
APPLICATIONS WITHDRAWN
0
$0
1
$59,180
4
$135,645
0
$0
0
$0
1
$25,730
FILES CLOSED FOR INCOMPLETENESS
1
$55,140
0
$0
1
$92,640
0
$0
0
$0
0
$0
Aggregated Statistics For Year 2007 (Based on 2 partial tracts)
A) FHA, FSA/RHS & VA Home Purchase Loans
B) Conventional Home Purchase Loans
C) Refinancings
D) Home Improvement Loans
F) Non-occupant Loans on < 5 Family Dwellings (A B C & D)
G) Loans On Manufactured Home Dwelling (A B C & D)
Number
Average Value
Number
Average Value
Number
Average Value
Number
Average Value
Number
Average Value
Number
Average Value
LOANS ORIGINATED
1
$166,160
19
$108,384
27
$107,680
14
$37,154
3
$107,953
1
$138,220
APPLICATIONS APPROVED, NOT ACCEPTED
0
$0
2
$53,120
3
$120,083
0
$0
1
$102,190
0
$0
APPLICATIONS DENIED
0
$0
3
$71,683
22
$112,920
3
$72,663
2
$94,290
1
$163,210
APPLICATIONS WITHDRAWN
0
$0
1
$105,870
4
$105,500
1
$80,500
1
$65,070
0
$0
FILES CLOSED FOR INCOMPLETENESS
0
$0
1
$76,460
3
$241,267
0
$0
0
$0
0
$0
Aggregated Statistics For Year 2006 (Based on 2 partial tracts)
A) FHA, FSA/RHS & VA Home Purchase Loans
B) Conventional Home Purchase Loans
C) Refinancings
D) Home Improvement Loans
F) Non-occupant Loans on < 5 Family Dwellings (A B C & D)
G) Loans On Manufactured Home Dwelling (A B C & D)
Number
Average Value
Number
Average Value
Number
Average Value
Number
Average Value
Number
Average Value
Number
Average Value
LOANS ORIGINATED
4
$107,062
24
$111,092
40
$102,560
17
$38,425
4
$119,102
4
$79,035
APPLICATIONS APPROVED, NOT ACCEPTED
0
$0
2
$158,070
5
$107,706
1
$24,630
0
$0
0
$0
APPLICATIONS DENIED
0
$0
3
$78,300
21
$90,885
3
$30,633
1
$63,230
3
$59,183
APPLICATIONS WITHDRAWN
0
$0
0
$0
10
$113,368
1
$47,790
0
$0
0
$0
FILES CLOSED FOR INCOMPLETENESS
0
$0
1
$144,100
4
$122,962
0
$0
1
$122,040
0
$0
Aggregated Statistics For Year 2005 (Based on 2 partial tracts)
B) Conventional Home Purchase Loans
C) Refinancings
D) Home Improvement Loans
F) Non-occupant Loans on < 5 Family Dwellings (A B C & D)
G) Loans On Manufactured Home Dwelling (A B C & D)
Number
Average Value
Number
Average Value
Number
Average Value
Number
Average Value
Number
Average Value
LOANS ORIGINATED
22
$105,752
36
$94,504
12
$48,860
4
$66,260
1
$113,960
APPLICATIONS APPROVED, NOT ACCEPTED
1
$77,200
4
$94,658
1
$7,350
0
$0
1
$69,480
APPLICATIONS DENIED
4
$85,192
24
$126,868
3
$73,273
2
$76,275
3
$85,407
APPLICATIONS WITHDRAWN
1
$170,200
12
$119,562
0
$0
0
$0
1
$73,890
FILES CLOSED FOR INCOMPLETENESS
0
$0
3
$94,840
0
$0
0
$0
0
$0
Aggregated Statistics For Year 2004 (Based on 2 partial tracts)
A) FHA, FSA/RHS & VA Home Purchase Loans
B) Conventional Home Purchase Loans
C) Refinancings
D) Home Improvement Loans
F) Non-occupant Loans on < 5 Family Dwellings (A B C & D)
G) Loans On Manufactured Home Dwelling (A B C & D)
Number
Average Value
Number
Average Value
Number
Average Value
Number
Average Value
Number
Average Value
Number
Average Value
LOANS ORIGINATED
1
$69,110
23
$91,996
46
$98,317
13
$40,408
5
$124,102
2
$57,895
APPLICATIONS APPROVED, NOT ACCEPTED
0
$0
1
$121,310
8
$96,081
1
$102,560
0
$0
1
$52,930
APPLICATIONS DENIED
1
$88,220
4
$83,630
17
$83,921
2
$28,490
0
$0
3
$59,797
APPLICATIONS WITHDRAWN
0
$0
3
$105,870
12
$110,617
0
$0
1
$56,240
0
$0
FILES CLOSED FOR INCOMPLETENESS
0
$0
0
$0
3
$102,927
0
$0
0
$0
0
$0
Aggregated Statistics For Year 2003 (Based on 2 partial tracts)
B) Conventional Home Purchase Loans
C) Refinancings
D) Home Improvement Loans
F) Non-occupant Loans on < 5 Family Dwellings (A B C & D)
Number
Average Value
Number
Average Value
Number
Average Value
Number
Average Value
LOANS ORIGINATED
14
$91,086
65
$83,903
8
$29,179
3
$81,117
APPLICATIONS APPROVED, NOT ACCEPTED
0
$0
8
$91,854
1
$37,130
1
$169,830
APPLICATIONS DENIED
1
$113,220
17
$90,949
2
$72,415
0
$0
APPLICATIONS WITHDRAWN
1
$152,550
19
$109,274
0
$0
0
$0
FILES CLOSED FOR INCOMPLETENESS
1
$90,430
3
$108,320
0
$0
0
$0
Aggregated Statistics For Year 2002 (Based on 2 partial tracts)
A) FHA, FSA/RHS & VA Home Purchase Loans
B) Conventional Home Purchase Loans
C) Refinancings
D) Home Improvement Loans
F) Non-occupant Loans on < 5 Family Dwellings (A B C & D)
Number
Average Value
Number
Average Value
Number
Average Value
Number
Average Value
Number
Average Value
LOANS ORIGINATED
4
$80,598
17
$101,155
51
$83,596
6
$32,593
2
$121,490
APPLICATIONS APPROVED, NOT ACCEPTED
0
$0
1
$80,500
8
$69,614
1
$59,550
0
$0
APPLICATIONS DENIED
0
$0
4
$54,955
22
$89,477
1
$22,790
1
$78,670
APPLICATIONS WITHDRAWN
0
$0
2
$113,955
13
$89,921
1
$9,930
0
$0
FILES CLOSED FOR INCOMPLETENESS
0
$0
0
$0
2
$122,780
0
$0
0
$0
Aggregated Statistics For Year 2001 (Based on 2 partial tracts)
A) FHA, FSA/RHS & VA Home Purchase Loans
B) Conventional Home Purchase Loans
C) Refinancings
D) Home Improvement Loans
F) Non-occupant Loans on < 5 Family Dwellings (A B C & D)
Number
Average Value
Number
Average Value
Number
Average Value
Number
Average Value
Number
Average Value
LOANS ORIGINATED
3
$86,140
14
$84,443
35
$78,603
6
$21,382
4
$55,415
APPLICATIONS APPROVED, NOT ACCEPTED
0
$0
3
$98,517
7
$67,481
1
$25,360
0
$0
APPLICATIONS DENIED
0
$0
8
$61,114
19
$88,263
2
$8,820
1
$48,890
APPLICATIONS WITHDRAWN
0
$0
0
$0
10
$90,944
1
$82,710
0
$0
FILES CLOSED FOR INCOMPLETENESS
0
$0
0
$0
3
$86,387
0
$0
0
$0
Aggregated Statistics For Year 2000 (Based on 2 partial tracts)
A) FHA, FSA/RHS & VA Home Purchase Loans
B) Conventional Home Purchase Loans
C) Refinancings
D) Home Improvement Loans
F) Non-occupant Loans on < 5 Family Dwellings (A B C & D)
Number
Average Value
Number
Average Value
Number
Average Value
Number
Average Value
Number
Average Value
LOANS ORIGINATED
2
$77,930
15
$71,633
11
$59,752
9
$22,464
3
$35,167
APPLICATIONS APPROVED, NOT ACCEPTED
0
$0
3
$43,743
3
$75,603
2
$44,665
0
$0
APPLICATIONS DENIED
0
$0
7
$67,009
11
$66,703
3
$15,807
0
$0
APPLICATIONS WITHDRAWN
0
$0
1
$26,830
6
$61,940
0
$0
0
$0
FILES CLOSED FOR INCOMPLETENESS
0
$0
0
$0
1
$72,050
0
$0
0
$0
Aggregated Statistics For Year 1999 (Based on 1 partial tract)
A) FHA, FSA/RHS & VA Home Purchase Loans
B) Conventional Home Purchase Loans
C) Refinancings
D) Home Improvement Loans
F) Non-occupant Loans on < 5 Family Dwellings (A B C & D)


 Nearest zip codes: 16882, 16872, 16854, 17885, 16832, 16852.