Estimated zip code population in 2022: 454 Zip code population in 2010: 300 Zip code population in 2000: 364
Houses and condos: 268 Renter-occupied apartments: 15
% of renters here:
9%
State:
31%
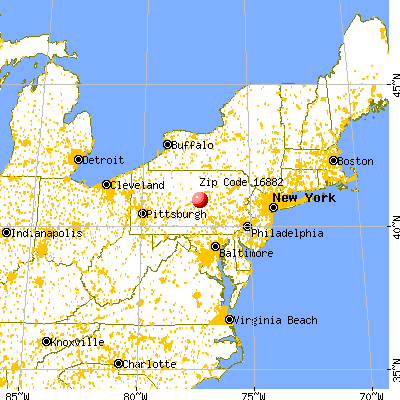
March 2022 cost of living index in zip code 16882: 91.2 (less than average, U.S. average is 100)
Land area: 26.4 sq. mi. Water area: 0.0 sq. mi.
Population density: 17 people per square mile
(very low).
OSM Map
General Map
Google Map
MSN Map
OSM Map
General Map
Google Map
MSN Map
OSM Map
General Map
Google Map
MSN Map
OSM Map
General Map
Google Map
MSN Map
Please wait while loading the map...
Real estate property taxes paid for housing units in 2022:
This zip code:
1.0% ($2,237)
Pennsylvania:
1.3% ($3,094)
Median real estate property taxes paid for housing units with mortgages in 2022: $2,307 (0.8%) Median real estate property taxes paid for housing units with no mortgage in 2022: $2,170 (1.3%)
Business Search- 14 Million verified businesses
Males: 266
(58.7%)
Females: 187
(41.3%)
For population 25 years and over in 16882:
High school or higher: 73.7%
Bachelor's degree or higher: 31.1%
Graduate or professional degree: 9.3%
Unemployed: 6.3%
Mean travel time to work (commute): 29.4 minutes
For population 15 years and over in 16882:
Never married: 21.3%
Now married: 56.6%
Separated: 3.5%
Widowed: 9.7%
Divorced: 8.9%
Zip code 16882 compared to state average:
Black race population percentage significantly below state average.
Foreign-born population percentage significantly below state average.
Renting percentage significantly below state average.
Length of stay since moving in significantly above state average.
Estimated median house/condo value in 2022: $228,460
16882:
$228,460
Pennsylvania:
$245,500
Median resident age:
This zip code:
42.7 years
Pennsylvania median age:
40.9 years
Average household size:
This zip code:
2.7 people
Pennsylvania:
2.4 people
Averages for the 2020 tax year for zip code 16882, filed in 2021:
Average Adjusted Gross Income (AGI) in 2020: $40,995 (Individual Income Tax Returns)
Here:
$40,995
State:
$75,707
Salary/wage: $41,483 (reported on 63.2% of returns)
Here:
$41,483
State:
$62,806
(% of AGI for various income ranges: 1655.0% for AGIs below $25k, 4453.3% for AGIs $25k-50k, 4120.0% for AGIs $50k-75k)
Taxable interest for individuals: $500 (reported on 21.1% of returns)
This zip code:
$500
Pennsylvania:
$1,633
(% of AGI for various income ranges: 80.0% for AGIs below $25k, 13.3% for AGIs $50k-75k)
Profit/loss from business: +$15,650 (reported on 21.1% of returns)
Here:
+$15,650
State:
+$16,274
(% of AGI for various income ranges: 2086.7% for AGIs $25k-50k)
Percentage of individuals using paid preparers for their 2020 taxes: 89.5%
Here:
89%
State:
92%
(% for various income ranges: 85.7% for AGIs below $25k, 100.0% for AGIs $25k-50k, 100.0% for AGIs $50k-75k, 66.7% for AGIs $75k-100k)
Averages for the 2012 tax year for zip code 16882, filed in 2013:
Average Adjusted Gross Income (AGI) in 2012: $32,641 (Individual Income Tax Returns)
Here:
$32,641
State:
$61,346
Salary/wage: $35,200 (reported on 58.8% of returns)
Here:
$35,200
State:
$51,902
(% of AGI for various income ranges: 43.3% for AGIs below $25k, 64.9% for AGIs $25k-50k, 69.0% for AGIs $50k-75k)
Taxable interest for individuals: $275 (reported on 23.5% of returns)
This zip code:
$275
Pennsylvania:
$1,588
Profit/loss from business: +$10,375 (reported on 23.5% of returns)
Here:
+$10,375
State:
+$16,268
Total itemized deductions: $14,500 (20% of AGI, reported on 17.6% of returns)
Here:
$14,500
State:
$23,538
Here:
20.3% of AGI
State:
18.4% of AGI
Taxes paid: $6,300 (reported on 17.6% of returns)
16882:
$6,300
State:
$9,982
Percentage of individuals using paid preparers for their 2012 taxes: 64.7%
Here:
65%
State:
53%
(% for various income ranges: 62.5% for AGIs below $25k, 80.0% for AGIs $25k-50k, 50.0% for AGIs $50k-75k)
Averages for the 2004 tax year for zip code 16882, filed in 2005:
Average Adjusted Gross Income (AGI) in 2004: $29,675 (Individual Income Tax Returns)
Here:
$29,675
State:
$48,049
Salary/wage: $25,614 (reported on 69.9% of returns)
Here:
$25,614
State:
$42,646
(% of AGI for various income ranges: 98.9% for AGIs below $10k, 56.7% for AGIs $10k-25k, 76.3% for AGIs $25k-50k, 113.3% for AGIs $50k-75k)
Taxable interest for individuals: $1,159 (reported on 50.3% of returns)
This zip code:
$1,159
Pennsylvania:
$1,657
(% of AGI for various income ranges: 6.6% for AGIs below $10k, 7.8% for AGIs $10k-25k, 0.5% for AGIs $25k-50k, 0.5% for AGIs $50k-75k)
Taxable dividends: $143 (reported on 12.9% of returns)
Here:
$143
State:
$3,566
Net capital gain/loss: +$1,636 (reported on 6.7% of returns)
Here:
+$1,636
State:
+$9,716
Profit/loss from business: +$8,516 (reported on 19.0% of returns)
Here:
+$8,516
State:
+$14,267
Total itemized deductions: $12,000 (19% of AGI, reported on 16.0% of returns)
Here:
$12,000
State:
$18,804
Here:
19.0% of AGI
State:
19.5% of AGI
Charity contributions deductions: $1,158 (2% of AGI, reported on 11.7% of returns)
Here:
$1,158
State:
$3,337
Here:
2.0% of AGI
State:
3.3% of AGI
Total tax: $4,094 (reported on 65.0% of returns)
16882:
$4,094
State:
$8,008
(% of AGI for various income ranges: 6.6% for AGIs below $10k, 4.2% for AGIs $10k-25k, 5.6% for AGIs $25k-50k, 9.4% for AGIs $50k-75k, 15.6% for AGIs $75k-100k)
Earned income credit: $214 (reported on 8.6% of returns)
Here:
$214
State:
$1,643
Percentage of individuals using paid preparers for their 2004 taxes: 66.3%
Here:
66%
State:
56%
(% for various income ranges: 56.8% for AGIs below $10k, 71.2% for AGIs $10k-25k, 64.9% for AGIs $25k-50k, 110.5% for AGIs $50k-75k)
Household received Food Stamps/SNAP in the past 12 months: 18 Household did not receive Food Stamps/SNAP in the past 12 months: 151
Women who had a birth in the past 12 months: 10 (10 now married, 0 unmarried) Women who did not have a birth in the past 12 months: 75 (49 now married, 25 unmarried)
Housing units in zip code 16882 with a mortgage: 79 Houses without a mortgage: 6
Median monthly owner costs for units with a mortgage: $1,227 Median monthly owner costs for units without a mortgage: $331
Residents with income below the poverty level in 2022:
This zip code:
23.3%
Whole state:
11.8%
Residents with income below 50% of the poverty level in 2022:
This zip code:
21.3%
Whole state:
6.1%
Median number of rooms in houses and condos:
Here:
6.4
State:
6.8
Median number of rooms in apartments:
Here:
6.0
State:
4.3
Notable locations in this zip code not listed on our city pages
Size of family households: 21 2-persons, 40 3-persons, 8 5-persons, 17 6-persons, 6 7-or-more-persons
Size of nonfamily households: 63 1-person, 1 2-persons, 10 3-persons
109 married couples with children.
0 single-parent households ().
82.9% of residents of 16882 zip code speak English at home.
2.5% of residents speak Spanish at home (100% very well).
13.6% of residents speak other Indo-European language at home (100% very well).
Foreign born population: 0 (0.0%)
:
0.0%
Whole state:
7.5%
42%German
13%American
11%Pennsylvania German
9%English
3%Irish
Housing units lacking complete plumbing facilities: 12.0% Housing units lacking complete kitchen facilities: 12.6%
44.0%Wood
32.0%Fuel oil, kerosene, etc.
12.7%Solar energy
7.2%Bottled, tank, or LP gas
3.0%Electricity
1.8%Coal or coke
Population in 1990: 183. Population change in the 1990s: +181 (+98.9%).
Place of birth for U.S.-born residents:
This state: 353
Northeast: 19
Midwest: 41
South: 4
West: 36
79% of the 16882 zip code residents lived in the same house 5 years ago. Out of people who lived in different houses, 69% lived in this county. Out of people who lived in different counties, 50% lived in Pennsylvania.
99% of the 16882 zip code residents lived in the same house 1 year ago. Out of people who lived in different houses, 33% moved from this county. Out of people who lived in different houses, 67% moved from different county within same state.
Private vs. public school enrollment:
Students in private schools in grades 1 to 8 (elementary and middle school): 34
Here:
73.1%
Pennsylvania:
15.7%
Students in private schools in grades 9 to 12 (high school):
Here:
0.0%
Pennsylvania:
13.4%
Students in private undergraduate colleges: 2
Here:
15.9%
Pennsylvania:
39.8%
Occupation by median earnings in the past 12 months ($)
58,048Management occupations
53,077Construction and extraction occupations
34,915Sales and related occupations
18,233Production occupations
Top industries in this zip code by the number of employees in 2005:
Accommodation and Food Services: Recreational and Vacation Camps (except Campgrounds) (20-49 employees: 1 establishment)
Accommodation and Food Services: Food Service Contractors (5-9: 1)
Construction: Masonry Contractors (1-4: 1)
Finance and Insurance: Insurance Agencies and Brokerages (1-4: 1)
Construction: Site Preparation Contractors (1-4: 1)
Accommodation and Food Services: Limited-Service Restaurants (1-4: 1)
Health Care and Social Assistance: General Medical and Surgical Hospitals (1-4: 1)
Construction: New Single-Family Housing Construction (except Operative Builders) (1-4: 1)
Construction: Painting and Wall Covering Contractors (1-4: 1)
Home Mortgage Disclosure Act Aggregated Statistics For Year 2009 (Based on 2 partial tracts)
A) FHA, FSA/RHS & VA Home Purchase Loans
B) Conventional Home Purchase Loans
C) Refinancings
D) Home Improvement Loans
F) Non-occupant Loans on < 5 Family Dwellings (A B C & D)
G) Loans On Manufactured Home Dwelling (A B C & D)
Number
Average Value
Number
Average Value
Number
Average Value
Number
Average Value
Number
Average Value
Number
Average Value
LOANS ORIGINATED
5
$150,224
8
$92,476
37
$126,753
8
$35,979
3
$127,923
1
$142,270
APPLICATIONS APPROVED, NOT ACCEPTED
0
$0
0
$0
3
$83,053
0
$0
0
$0
0
$0
APPLICATIONS DENIED
1
$137,160
1
$118,560
11
$128,542
3
$67,243
1
$174,010
1
$92,660
APPLICATIONS WITHDRAWN
0
$0
0
$0
6
$169,023
0
$0
0
$0
0
$0
FILES CLOSED FOR INCOMPLETENESS
0
$0
0
$0
0
$0
0
$0
0
$0
0
$0
Aggregated Statistics For Year 2008 (Based on 2 partial tracts)
A) FHA, FSA/RHS & VA Home Purchase Loans
B) Conventional Home Purchase Loans
C) Refinancings
D) Home Improvement Loans
F) Non-occupant Loans on < 5 Family Dwellings (A B C & D)
G) Loans On Manufactured Home Dwelling (A B C & D)
Number
Average Value
Number
Average Value
Number
Average Value
Number
Average Value
Number
Average Value
Number
Average Value
LOANS ORIGINATED
3
$79,160
10
$90,762
28
$107,447
13
$39,567
4
$117,100
4
$55,268
APPLICATIONS APPROVED, NOT ACCEPTED
0
$0
0
$0
2
$120,385
1
$29,910
0
$0
0
$0
APPLICATIONS DENIED
1
$99,590
1
$165,980
18
$140,833
3
$50,587
0
$0
3
$80,620
APPLICATIONS WITHDRAWN
0
$0
1
$58,730
4
$134,610
0
$0
0
$0
1
$25,540
FILES CLOSED FOR INCOMPLETENESS
1
$54,720
0
$0
1
$91,930
0
$0
0
$0
0
$0
Aggregated Statistics For Year 2007 (Based on 2 partial tracts)
A) FHA, FSA/RHS & VA Home Purchase Loans
B) Conventional Home Purchase Loans
C) Refinancings
D) Home Improvement Loans
F) Non-occupant Loans on < 5 Family Dwellings (A B C & D)
G) Loans On Manufactured Home Dwelling (A B C & D)
Number
Average Value
Number
Average Value
Number
Average Value
Number
Average Value
Number
Average Value
Number
Average Value
LOANS ORIGINATED
1
$164,890
19
$107,558
27
$106,859
14
$36,871
3
$107,130
1
$137,160
APPLICATIONS APPROVED, NOT ACCEPTED
0
$0
2
$52,715
3
$119,167
0
$0
1
$101,410
0
$0
APPLICATIONS DENIED
0
$0
3
$71,137
22
$112,060
3
$72,110
2
$93,570
1
$161,970
APPLICATIONS WITHDRAWN
0
$0
1
$105,060
4
$104,698
1
$79,890
1
$64,570
0
$0
FILES CLOSED FOR INCOMPLETENESS
0
$0
1
$75,880
3
$239,430
0
$0
0
$0
0
$0
Aggregated Statistics For Year 2006 (Based on 2 partial tracts)
A) FHA, FSA/RHS & VA Home Purchase Loans
B) Conventional Home Purchase Loans
C) Refinancings
D) Home Improvement Loans
F) Non-occupant Loans on < 5 Family Dwellings (A B C & D)
G) Loans On Manufactured Home Dwelling (A B C & D)
Number
Average Value
Number
Average Value
Number
Average Value
Number
Average Value
Number
Average Value
Number
Average Value
LOANS ORIGINATED
4
$106,248
24
$110,245
40
$101,779
16
$40,516
4
$118,195
4
$78,432
APPLICATIONS APPROVED, NOT ACCEPTED
0
$0
2
$156,865
5
$106,886
1
$24,440
0
$0
0
$0
APPLICATIONS DENIED
0
$0
3
$77,703
21
$90,192
3
$30,400
1
$62,750
3
$58,733
APPLICATIONS WITHDRAWN
0
$0
0
$0
10
$112,504
1
$47,420
0
$0
0
$0
FILES CLOSED FOR INCOMPLETENESS
0
$0
1
$143,000
4
$122,025
0
$0
1
$121,110
0
$0
Aggregated Statistics For Year 2005 (Based on 2 partial tracts)
B) Conventional Home Purchase Loans
C) Refinancings
D) Home Improvement Loans
F) Non-occupant Loans on < 5 Family Dwellings (A B C & D)
G) Loans On Manufactured Home Dwelling (A B C & D)
Number
Average Value
Number
Average Value
Number
Average Value
Number
Average Value
Number
Average Value
LOANS ORIGINATED
22
$104,946
35
$96,463
12
$48,488
4
$65,755
1
$113,090
APPLICATIONS APPROVED, NOT ACCEPTED
1
$76,610
4
$93,935
1
$7,300
0
$0
1
$68,950
APPLICATIONS DENIED
4
$84,542
23
$131,376
3
$72,717
2
$75,695
3
$84,757
APPLICATIONS WITHDRAWN
1
$168,900
12
$118,651
0
$0
0
$0
1
$73,320
FILES CLOSED FOR INCOMPLETENESS
0
$0
3
$94,120
0
$0
0
$0
0
$0
Aggregated Statistics For Year 2004 (Based on 2 partial tracts)
A) FHA, FSA/RHS & VA Home Purchase Loans
B) Conventional Home Purchase Loans
C) Refinancings
D) Home Improvement Loans
F) Non-occupant Loans on < 5 Family Dwellings (A B C & D)
G) Loans On Manufactured Home Dwelling (A B C & D)
Number
Average Value
Number
Average Value
Number
Average Value
Number
Average Value
Number
Average Value
Number
Average Value
LOANS ORIGINATED
1
$68,580
23
$91,295
45
$99,736
13
$40,100
5
$123,156
2
$57,455
APPLICATIONS APPROVED, NOT ACCEPTED
0
$0
1
$120,380
8
$95,350
1
$101,780
0
$0
1
$52,530
APPLICATIONS DENIED
1
$87,550
4
$82,992
16
$88,487
2
$28,270
0
$0
3
$59,340
APPLICATIONS WITHDRAWN
0
$0
3
$105,063
12
$109,774
0
$0
1
$55,810
0
$0
FILES CLOSED FOR INCOMPLETENESS
0
$0
0
$0
3
$102,143
0
$0
0
$0
0
$0
Aggregated Statistics For Year 2003 (Based on 2 partial tracts)
B) Conventional Home Purchase Loans
C) Refinancings
D) Home Improvement Loans
F) Non-occupant Loans on < 5 Family Dwellings (A B C & D)
Number
Average Value
Number
Average Value
Number
Average Value
Number
Average Value
LOANS ORIGINATED
14
$90,392
65
$83,264
8
$28,956
3
$80,500
APPLICATIONS APPROVED, NOT ACCEPTED
0
$0
8
$91,155
1
$36,840
1
$168,540
APPLICATIONS DENIED
1
$112,360
17
$90,256
2
$71,865
0
$0
APPLICATIONS WITHDRAWN
1
$151,390
19
$108,442
0
$0
0
$0
FILES CLOSED FOR INCOMPLETENESS
1
$89,740
3
$107,493
0
$0
0
$0
Aggregated Statistics For Year 2002 (Based on 2 partial tracts)
A) FHA, FSA/RHS & VA Home Purchase Loans
B) Conventional Home Purchase Loans
C) Refinancings
D) Home Improvement Loans
F) Non-occupant Loans on < 5 Family Dwellings (A B C & D)
Number
Average Value
Number
Average Value
Number
Average Value
Number
Average Value
Number
Average Value
LOANS ORIGINATED
4
$79,982
17
$100,384
51
$82,960
5
$38,814
2
$120,565
APPLICATIONS APPROVED, NOT ACCEPTED
0
$0
1
$79,890
8
$69,084
1
$59,100
0
$0
APPLICATIONS DENIED
0
$0
4
$54,538
22
$88,795
1
$22,620
1
$78,070
APPLICATIONS WITHDRAWN
0
$0
2
$113,090
13
$89,235
1
$9,850
0
$0
FILES CLOSED FOR INCOMPLETENESS
0
$0
0
$0
2
$121,845
0
$0
0
$0
Aggregated Statistics For Year 2001 (Based on 2 partial tracts)
A) FHA, FSA/RHS & VA Home Purchase Loans
B) Conventional Home Purchase Loans
C) Refinancings
D) Home Improvement Loans
F) Non-occupant Loans on < 5 Family Dwellings (A B C & D)
Number
Average Value
Number
Average Value
Number
Average Value
Number
Average Value
Number
Average Value
LOANS ORIGINATED
3
$85,483
13
$90,246
35
$78,005
6
$21,220
4
$54,992
APPLICATIONS APPROVED, NOT ACCEPTED
0
$0
3
$97,767
7
$66,967
1
$25,170
0
$0
APPLICATIONS DENIED
0
$0
8
$60,648
19
$87,591
2
$8,755
1
$48,520
APPLICATIONS WITHDRAWN
0
$0
0
$0
10
$90,252
1
$82,080
0
$0
FILES CLOSED FOR INCOMPLETENESS
0
$0
0
$0
3
$85,727
0
$0
0
$0
Aggregated Statistics For Year 2000 (Based on 2 partial tracts)
A) FHA, FSA/RHS & VA Home Purchase Loans
B) Conventional Home Purchase Loans
C) Refinancings
D) Home Improvement Loans
F) Non-occupant Loans on < 5 Family Dwellings (A B C & D)
Number
Average Value
Number
Average Value
Number
Average Value
Number
Average Value
Number
Average Value
LOANS ORIGINATED
2
$77,340
15
$71,087
11
$59,296
9
$22,293
3
$34,900
APPLICATIONS APPROVED, NOT ACCEPTED
0
$0
3
$43,410
3
$75,027
2
$44,325
0
$0
APPLICATIONS DENIED
0
$0
7
$66,497
11
$66,195
3
$15,687
0
$0
APPLICATIONS WITHDRAWN
0
$0
1
$26,630
6
$61,468
0
$0
0
$0
FILES CLOSED FOR INCOMPLETENESS
0
$0
0
$0
1
$71,500
0
$0
0
$0
Aggregated Statistics For Year 1999 (Based on 1 partial tract)
A) FHA, FSA/RHS & VA Home Purchase Loans
B) Conventional Home Purchase Loans
C) Refinancings
D) Home Improvement Loans
F) Non-occupant Loans on < 5 Family Dwellings (A B C & D)


 Nearest zip codes: 17885, 16872, 16820, 17845, 17747, 17835.


