Estimated zip code population in 2022: 5,965 Zip code population in 2010: 6,937 Zip code population in 2000: 7,864
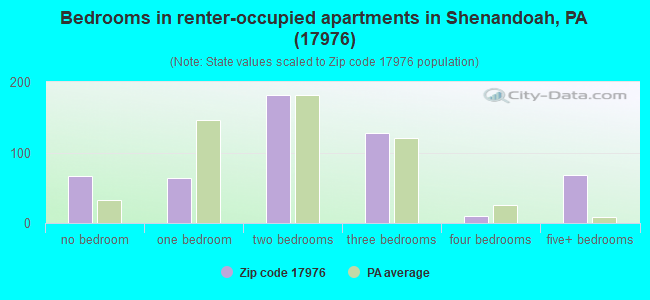
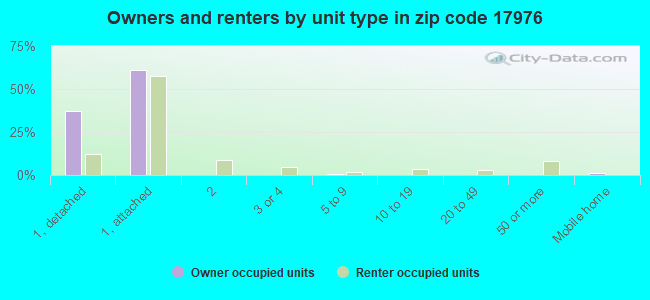
Houses and condos: 3,357 Renter-occupied apartments: 516
% of renters here:
22%
State:
31%
March 2022 cost of living index in zip code 17976: 80.6 (low, U.S. average is 100)
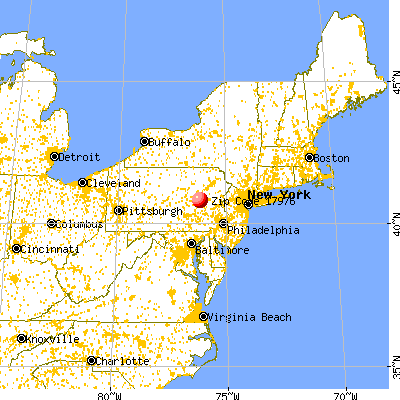
Land area: 7.7 sq. mi. Water area: 0.1 sq. mi.
Population density: 778 people per square mile
(low).
OSM Map
General Map
Google Map
MSN Map
OSM Map
General Map
Google Map
MSN Map
OSM Map
General Map
Google Map
MSN Map
OSM Map
General Map
Google Map
MSN Map
Please wait while loading the map...
Real estate property taxes paid for housing units in 2022:
This zip code:
2.0% ($979)
Pennsylvania:
1.3% ($3,094)
Median real estate property taxes paid for housing units with mortgages in 2022: $1,382 (1.4%) Median real estate property taxes paid for housing units with no mortgage in 2022: $891 (2.1%)
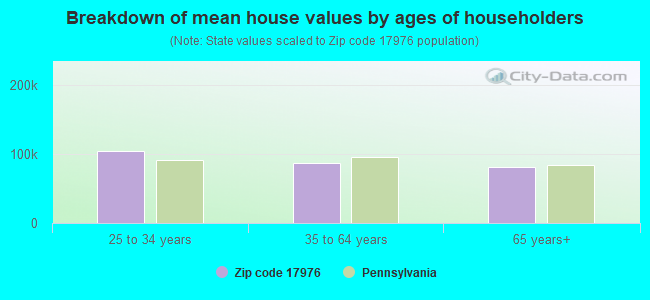
Estimated median house/condo value in 2022: $49,816
17976:
$49,816
Pennsylvania:
$245,500
According to our research of Pennsylvania and other state lists, there were 10 registered sex offenders living in 17976 zip code as of June 15, 2024. The ratio of all residents to sex offenders in zip code 17976 is 690 to 1. The ratio of registered sex offenders to all residents in this zip code is near the state average.
Median resident age:
This zip code:
39.8 years
Pennsylvania median age:
40.9 years
Average household size:
This zip code:
2.4 people
Pennsylvania:
2.4 people
Averages for the 2020 tax year for zip code 17976, filed in 2021:
Average Adjusted Gross Income (AGI) in 2020: $37,642 (Individual Income Tax Returns)
Here:
$37,642
State:
$75,707
Salary/wage: $34,903 (reported on 78.1% of returns)
Here:
$34,903
State:
$62,806
(% of AGI for various income ranges: 978.4% for AGIs below $25k, 3196.9% for AGIs $25k-50k, 6013.6% for AGIs $50k-75k, 9536.7% for AGIs $75k-100k, 14475.0% for AGIs $100k-200k)
Taxable interest for individuals: $1,013 (reported on 18.8% of returns)
This zip code:
$1,013
Pennsylvania:
$1,633
(% of AGI for various income ranges: 13.0% for AGIs below $25k, 26.8% for AGIs $25k-50k, 16.8% for AGIs $50k-75k, 64.2% for AGIs $75k-100k, 86.7% for AGIs $100k-200k)
Ordinary dividends: $2,907 (reported on 10.4% of returns)
Here:
$2,907
State:
$7,382
(% of AGI for various income ranges: 13.3% for AGIs below $25k, 29.9% for AGIs $25k-50k, 55.7% for AGIs $50k-75k, 57.5% for AGIs $75k-100k, 251.7% for AGIs $100k-200k)
Net capital gain/loss in AGI: +$3,367 (reported on 7.3% of returns)
Here:
+$3,367
State:
+$23,522
(% of AGI for various income ranges: 7.1% for AGIs below $25k, 16.7% for AGIs $25k-50k, 32.9% for AGIs $50k-75k, 47.5% for AGIs $75k-100k, 306.7% for AGIs $100k-200k)
Profit/loss from business: +$9,533 (reported on 8.3% of returns)
Here:
+$9,533
State:
+$16,274
(% of AGI for various income ranges: 141.4% for AGIs below $25k, 103.6% for AGIs $25k-50k, 186.7% for AGIs $75k-100k)
Taxable individual retirement arrangement distribution: $9,465 (reported on 6.9% of returns)
17976:
$9,465
Pennsylvania:
$18,583
(% of AGI for various income ranges: 46.0% for AGIs below $25k, 61.7% for AGIs $25k-50k, 121.1% for AGIs $50k-75k, 560.0% for AGIs $75k-100k)
Total itemized deductions: $29,500 (reported on 0.7% of returns)
Here:
$29,500
State:
$34,850
(% of AGI for various income ranges: 78.7% for AGIs $25k-50k)
Taxes paid: $6,200 (reported on 0.7% of returns)
17976:
$6,200
State:
$8,200
(% of AGI for various income ranges: 13.6% for AGIs below $25k)
Earned income credit: $2,572 (reported on 26.4% of returns)
Here:
$2,572
State:
$2,100
(% of AGI for various income ranges: 141.5% for AGIs below $25k, 88.9% for AGIs $25k-50k)
Percentage of individuals using paid preparers for their 2020 taxes: 87.8%
Here:
88%
State:
92%
(% for various income ranges: 86.8% for AGIs below $25k, 89.9% for AGIs $25k-50k, 88.6% for AGIs $50k-75k, 83.3% for AGIs $75k-100k, 88.2% for AGIs $100k-200k)
Averages for the 2012 tax year for zip code 17976, filed in 2013:
Average Adjusted Gross Income (AGI) in 2012: $32,614 (Individual Income Tax Returns)
Here:
$32,614
State:
$61,346
Salary/wage: $29,824 (reported on 82.7% of returns)
Here:
$29,824
State:
$51,902
(% of AGI for various income ranges: 67.4% for AGIs below $25k, 81.8% for AGIs $25k-50k, 80.1% for AGIs $50k-75k, 81.7% for AGIs $75k-100k, 62.7% for AGIs $100k-200k)
Taxable interest for individuals: $1,237 (reported on 25.3% of returns)
This zip code:
$1,237
Pennsylvania:
$1,588
(% of AGI for various income ranges: 1.7% for AGIs below $25k, 1.1% for AGIs $25k-50k, 0.7% for AGIs $50k-75k, 0.4% for AGIs $75k-100k, 0.8% for AGIs $100k-200k)
Ordinary dividends: $2,188 (reported on 15.5% of returns)
Here:
$2,188
State:
$5,827
(% of AGI for various income ranges: 1.7% for AGIs below $25k, 0.6% for AGIs $25k-50k, 1.0% for AGIs $50k-75k, 0.3% for AGIs $75k-100k, 1.7% for AGIs $100k-200k)
Net capital gain/loss in AGI: +$2,105 (reported on 7.2% of returns)
Here:
+$2,105
State:
+$14,495
(% of AGI for various income ranges: 2.8% for AGIs $100k-200k)
Profit/loss from business: +$7,179 (reported on 6.9% of returns)
Here:
+$7,179
State:
+$16,268
(% of AGI for various income ranges: 5.3% for AGIs below $25k, 1.4% for AGIs $25k-50k, 0.6% for AGIs $50k-75k)
Taxable individual retirement arrangement distribution: $8,288 (reported on 8.7% of returns)
17976:
$8,288
Pennsylvania:
$14,550
(% of AGI for various income ranges: 3.0% for AGIs below $25k, 2.0% for AGIs $25k-50k, 1.7% for AGIs $50k-75k, 4.7% for AGIs $75k-100k)
Total itemized deductions: $15,422 (22% of AGI, reported on 8.3% of returns)
Here:
$15,422
State:
$23,538
Here:
21.6% of AGI
State:
18.4% of AGI
(% of AGI for various income ranges: 3.0% for AGIs below $25k, 2.8% for AGIs $25k-50k, 4.0% for AGIs $50k-75k, 5.3% for AGIs $75k-100k, 5.5% for AGIs $100k-200k)
Charity contributions: $1,863 (reported on 6.9% of returns)
Here:
$1,863
State:
$4,025
(% of AGI for various income ranges: 0.2% for AGIs $25k-50k, 0.5% for AGIs $50k-75k, 0.6% for AGIs $75k-100k, 0.8% for AGIs $100k-200k)
Taxes paid: $4,564 (reported on 7.9% of returns)
17976:
$4,564
State:
$9,982
(% of AGI for various income ranges: 0.4% for AGIs below $25k, 0.6% for AGIs $25k-50k, 1.2% for AGIs $50k-75k, 1.6% for AGIs $75k-100k, 2.3% for AGIs $100k-200k)
Earned income credit: $2,139 (reported on 26.0% of returns)
Here:
$2,139
State:
$2,106
(% of AGI for various income ranges: 7.4% for AGIs below $25k, 1.1% for AGIs $25k-50k)
Percentage of individuals using paid preparers for their 2012 taxes: 45.1%
Here:
45%
State:
53%
(% for various income ranges: 41.8% for AGIs below $25k, 47.9% for AGIs $25k-50k, 50.0% for AGIs $50k-75k, 50.0% for AGIs $75k-100k, 50.0% for AGIs $100k-200k)
Averages for the 2004 tax year for zip code 17976, filed in 2005:
Average Adjusted Gross Income (AGI) in 2004: $28,469 (Individual Income Tax Returns)
Here:
$28,469
State:
$48,049
Salary/wage: $27,614 (reported on 83.3% of returns)
Here:
$27,614
State:
$42,646
(% of AGI for various income ranges: 72.4% for AGIs below $10k, 73.0% for AGIs $10k-25k, 83.1% for AGIs $25k-50k, 84.1% for AGIs $50k-75k, 88.2% for AGIs $75k-100k, 72.0% for AGIs over 100k)
Taxable interest for individuals: $1,847 (reported on 38.3% of returns)
This zip code:
$1,847
Pennsylvania:
$1,657
(% of AGI for various income ranges: 5.1% for AGIs below $10k, 3.7% for AGIs $10k-25k, 1.9% for AGIs $25k-50k, 1.6% for AGIs $50k-75k, 0.5% for AGIs $75k-100k, 6.3% for AGIs over 100k)
Taxable dividends: $1,619 (reported on 20.6% of returns)
Here:
$1,619
State:
$3,566
(% of AGI for various income ranges: 2.8% for AGIs below $10k, 1.5% for AGIs $10k-25k, 1.0% for AGIs $25k-50k, 0.9% for AGIs $50k-75k, 0.2% for AGIs $75k-100k, 2.6% for AGIs over 100k)
Net capital gain/loss: +$580 (reported on 12.0% of returns)
Here:
+$580
State:
+$9,716
(% of AGI for various income ranges: -0.9% for AGIs below $10k, 0.5% for AGIs $10k-25k, 0.2% for AGIs $25k-50k, 0.4% for AGIs $50k-75k, -0.0% for AGIs $75k-100k, 0.5% for AGIs over 100k)
Profit/loss from business: +$6,284 (reported on 6.5% of returns)
Here:
+$6,284
State:
+$14,267
(% of AGI for various income ranges: 3.7% for AGIs below $10k, 2.1% for AGIs $10k-25k, 1.4% for AGIs $25k-50k, 1.2% for AGIs $50k-75k, 1.3% for AGIs $75k-100k)
IRA payment deduction: $2,036 (reported on 1.9% of returns)
17976:
$2,036
Pennsylvania:
$2,903
Total itemized deductions: $13,691 (23% of AGI, reported on 9.9% of returns)
Here:
$13,691
State:
$18,804
Here:
23.1% of AGI
State:
19.5% of AGI
(% of AGI for various income ranges: 3.2% for AGIs $10k-25k, 4.6% for AGIs $25k-50k, 4.4% for AGIs $50k-75k, 7.2% for AGIs $75k-100k, 8.7% for AGIs over 100k)
Charity contributions deductions: $2,021 (3% of AGI, reported on 8.3% of returns)
Here:
$2,021
State:
$3,337
Here:
3.2% of AGI
State:
3.3% of AGI
(% of AGI for various income ranges: 0.3% for AGIs $10k-25k, 0.4% for AGIs $25k-50k, 0.5% for AGIs $50k-75k, 0.8% for AGIs $75k-100k, 2.0% for AGIs over 100k)
Total tax: $3,393 (reported on 66.5% of returns)
17976:
$3,393
State:
$8,008
(% of AGI for various income ranges: 1.3% for AGIs below $10k, 3.6% for AGIs $10k-25k, 7.0% for AGIs $25k-50k, 8.8% for AGIs $50k-75k, 10.9% for AGIs $75k-100k, 17.1% for AGIs over 100k)
Earned income credit: $1,579 (reported on 20.5% of returns)
Here:
$1,579
State:
$1,643
Percentage of individuals using paid preparers for their 2004 taxes: 48.5%
Here:
48%
State:
56%
(% for various income ranges: 44.0% for AGIs below $10k, 48.2% for AGIs $10k-25k, 51.1% for AGIs $25k-50k, 51.1% for AGIs $50k-75k, 48.2% for AGIs $75k-100k, 62.7% for AGIs over 100k)
Household received Food Stamps/SNAP in the past 12 months: 592 Household did not receive Food Stamps/SNAP in the past 12 months: 1,817
Women who had a birth in the past 12 months: 91 (98 now married, 0 unmarried) Women who did not have a birth in the past 12 months: 1,124 (284 now married, 845 unmarried)
Housing units in zip code 17976 with a mortgage: 501 (37 second mortgage, 21 both second mortgage and home equity loan) Houses without a mortgage: 13
Median monthly owner costs for units with a mortgage: $1,051 Median monthly owner costs for units without a mortgage: $463
Residents with income below the poverty level in 2022:
This zip code:
23.4%
Whole state:
11.8%
Residents with income below 50% of the poverty level in 2022:
This zip code:
14.4%
Whole state:
6.1%
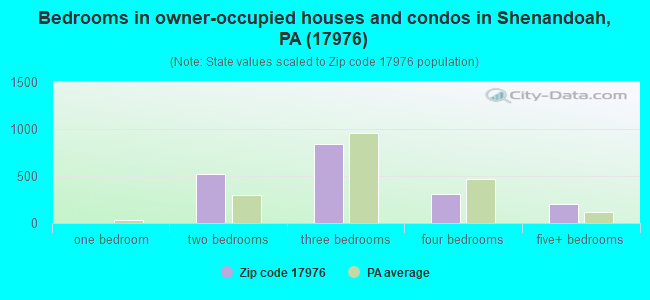
Median number of rooms in houses and condos:
Here:
6.7
State:
6.8
Median number of rooms in apartments:
Here:
5.5
State:
4.3
Notable locations in this zip code not listed on our city pages
Notable locations in zip code 17976: Columbia Hose and Steam Fire Engine Company 1 (A), Shenandoah Fire Department Station 5 - Rescue Hook and Ladder Company 1 (B), Shenandoah Fire Department Station 4 - Polish - American Fire Company 4 (C), Shenandoah Fire Department Station 3 - Phoenix Fire Company 2 (D), Shenandoah Fire Department Station 2 - Defender Hose Company 3 (E), Heights Fire Company 1 (F), William Penn Fire Company 1 (G). Display/hide their locations on the map
Reservoirs: Mountain Shadow Lake (A), Raven Run Reservoir (B), Kehly Run Reservoir Number Three (C), Kehley Run Dam (D), Number Six Reservoir (E), Number Five Reservoir (F), Number Four Reservoir (G), Number Three Reservoir (H). Display/hide their locations on the map
In group quarters: 279 (-1 institutionalized population)
Size of family households: 882 2-persons, 265 3-persons, 154 4-persons, 86 5-persons, 20 6-persons, 43 7-or-more-persons
Size of nonfamily households: 799 1-person, 101 2-persons, 49 3-persons
444 married couples with children.
784 single-parent households (41 men, 743 women).
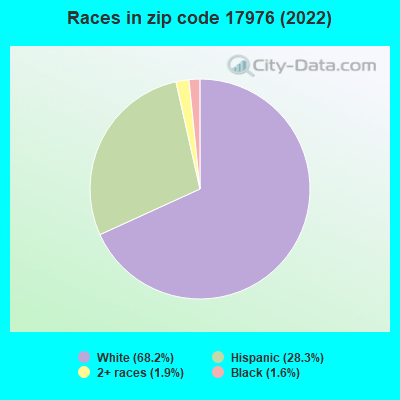
73.4% of residents of 17976 zip code speak English at home.
25.2% of residents speak Spanish at home (56% very well, 27% well, 12% not well, 5% not at all).
1.6% of residents speak other Indo-European language at home (76% very well, 20% well, 4% not well).
0.9% of residents speak other language at home (53% very well, 47% well).
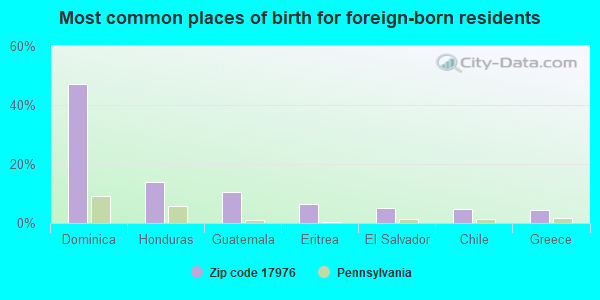
Foreign born population: 510 (8.6%) (58.2% of them are naturalized citizens)
This zip code:
8.6%
Whole state:
7.5%
47%Dominica
14%Honduras
10%Guatemala
6%Eritrea
5%El Salvador
5%Chile
5%Greece
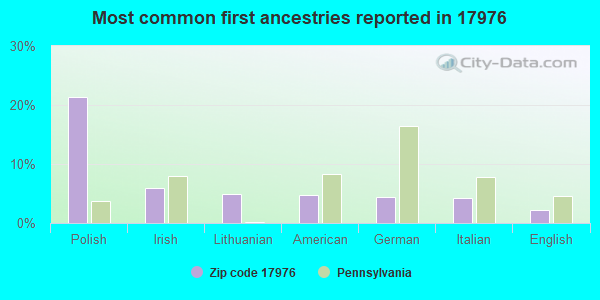
21%Polish
6%Irish
5%Lithuanian
5%American
4%German
4%Italian
2%English
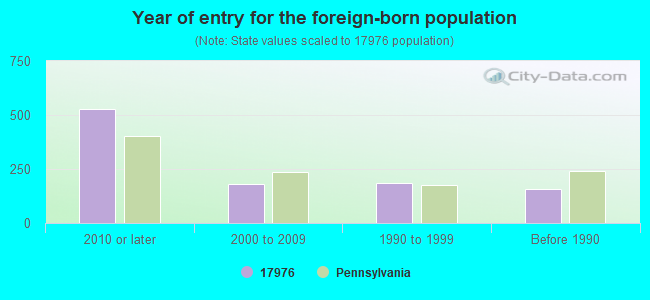
Year of entry for the foreign-born population
5262010 or later
1792000 to 2009
1841990 to 1999
159Before 1990
Facilities with environmental interests located in this zip code:
BELLUSSIS CLNR / SHENANDOAH (21 W OAK ST in SHENANDOAH, PA)
AIR MINOR (AIRS/AFS) Conditionally Exempt Small Quantity Generators, less than 100 kg/month of hazardous waste (Resource Conservation and Recovery Act (tracking hazardous waste)) - notification Business SIC classification: DRYCLEANING PLANTS, EXCEPT RUG CLEANING Organizations: BELLUCCI JOSEPH (CONTACT/OWNER)
Alternative names: BELLUCCI CLEANERS, BELLUCCI JOSEPH CLEANERS, JOSEPH BELLUCCI CLNR SVC
ALEX CHEMICAL (119 NORTH UNION STREET in SHENANDOAH, PA)
COMPLIANCE ACTIVITY (Tracking inspections of insecticide, fungicide, and rodenticide, and toxic substances)
Housing units lacking complete plumbing facilities: 14.4% Housing units lacking complete kitchen facilities: 14.0%
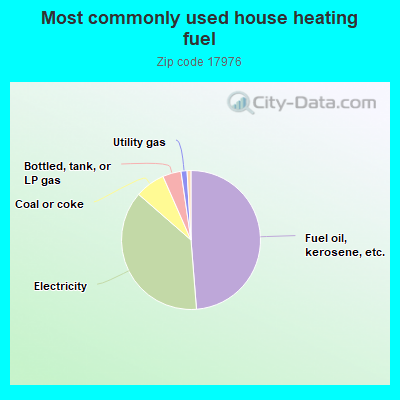
48.8%Fuel oil, kerosene, etc.
37.7%Electricity
7.0%Coal or coke
4.3%Bottled, tank, or LP gas
1.4%Utility gas
0.9%Other fuel
Population in 1990: 11,159.
Place of birth for U.S.-born residents:
This state: 3,891
Northeast: 880
Midwest: 50
South: 119
West: 10
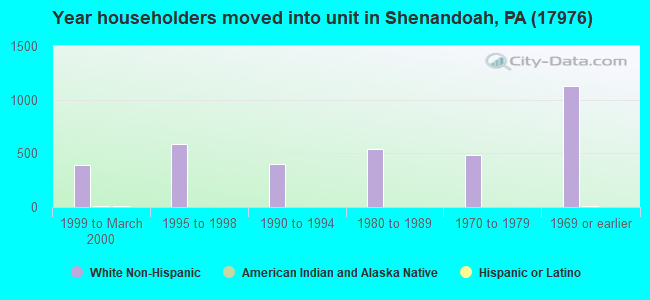
68% of the 17976 zip code residents lived in the same house 5 years ago. Out of people who lived in different houses, 79% lived in this county. Out of people who lived in different counties, 50% lived in Pennsylvania.
93% of the 17976 zip code residents lived in the same house 1 year ago. Out of people who lived in different houses, 50% moved from this county. Out of people who lived in different houses, 44% moved from different county within same state. Out of people who lived in different houses, 4% moved from different state. Out of people who lived in different houses, 1% moved from abroad.
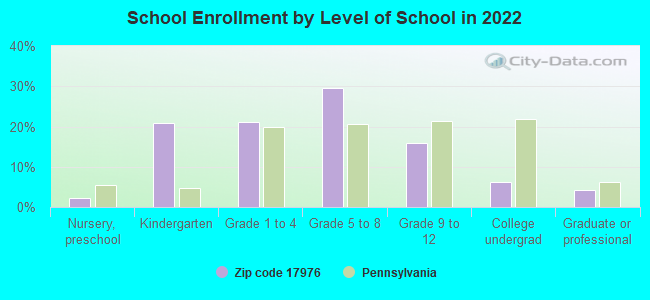
Private vs. public school enrollment:
Students in private schools in grades 1 to 8 (elementary and middle school): 230
Here:
31.9%
Pennsylvania:
15.7%
Students in private schools in grades 9 to 12 (high school): 18
Here:
8.4%
Pennsylvania:
13.4%
Students in private undergraduate colleges:
Here:
0.0%
Pennsylvania:
39.8%
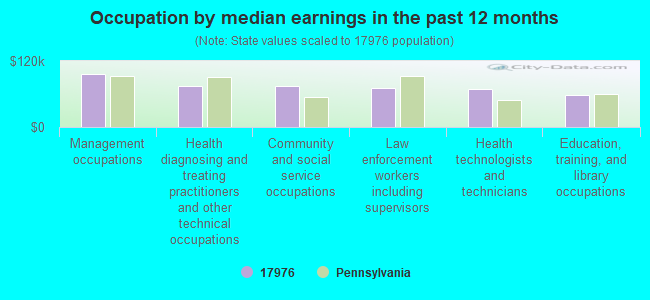
Occupation by median earnings in the past 12 months ($)
96,654Management occupations
73,889Health diagnosing and treating practitioners and other technical occupations
73,885Community and social service occupations
70,096Law enforcement workers including supervisors
68,787Health technologists and technicians
57,537Education, training, and library occupations
Companies with federal contracts located in this zip code:
ATEECO INC (600 E CENTER ST in SHENANDOAH, PA; small business) : $696,804 in 7 contractsfrom 2004 to 2005
Contracts for Food Items For Resale, Non-Food Items For Resale by Defense Commissary Agency Signed by year:2000: $0; 2001: $0; 2002: $0; 2003: $0; 2004: $183,107; 2005: $513,697; 2006: $0.
Biggest contracts:
$186,711 with Defense Commissary Agency for Food Items For Resale. Signed on 2005-04-01. Completion date: 2005-07-31.
$183,107, same as above.Signed on 2004-10-01. Completion date: 2005-02-28.
$145,367 with Defense Commissary Agency for Non-Food Items For Resale. Signed on 2005-10-01. Completion date: 2005-12-31.
$70,936 with Defense Commissary Agency for Food Items For Resale. Signed on 2005-01-01. Completion date: 2005-03-31.
Top industries in this zip code by the number of employees in 2005:
Health Care and Social Assistance: Nursing Care Facilities (100-249 employees: 1 establishment)
Mining: Anthracite Mining (50-99: 1)
Utilities: Fossil Fuel Electric Power Generation (50-99: 1)
Other Services (except Public Administration): Religious Organizations (10-19: 2, 5-9: 1, 1-4: 2)
People in group quarters in 2010:
197 people in nursing facilities/skilled-nursing facilities
9 people in other noninstitutional facilities
People in group quarters in 2000:
212 people in nursing homes
13 people in religious group quarters
10 people in mental (psychiatric) hospitals or wards
Fatal accident statistics in 2014:
Fatal accident count: 1
Vehicles involved in fatal accidents: 1
Fatal accidents caused by drunken drivers: 0
Fatalities: 1
Persons involved in fatal accidents: 1
Pedestrians involved in fatal accidents: 1
2003 - 2018 National Fire Incident Reporting System (NFIRS) incidents
Based on the data from the years 2003 - 2018 the average number of fire incidents per year is 24. The highest number of fires - 91 took place in 2016, and the least - 0 in 2004. The data has a growing trend.
When looking into fire subcategories, the most incidents belonged to: Structure Fires (73.0%), and Outside Fires (18.0%).
Fire incident types reported to NFIRS in Zip Code 17976


 Nearest zip codes: 17934, 17931, 17967, 17949, 17946, 17935.


 Based on the data from the years 2003 - 2018 the average number of fire incidents per year is 24. The highest number of fires - 91 took place in 2016, and the least - 0 in 2004. The data has a growing trend.
 When looking into fire subcategories, the most incidents belonged to: Structure Fires (73.0%), and Outside Fires (18.0%).