Estimated zip code population in 2022: 9,974 Zip code population in 2010: 9,464 Zip code population in 2000: 7,675
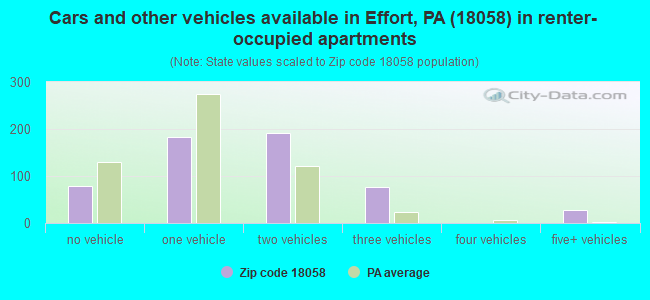
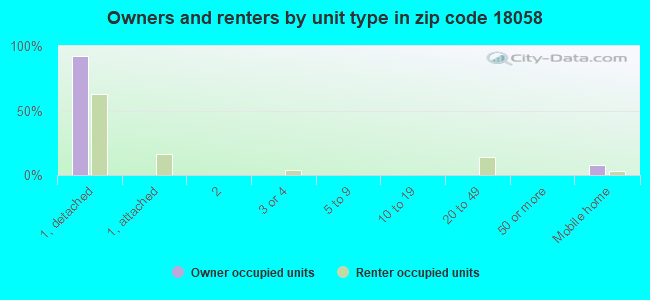
Houses and condos: 4,703 Renter-occupied apartments: 554
% of renters here:
15%
State:
31%
March 2022 cost of living index in zip code 18058: 94.8 (less than average, U.S. average is 100)
Land area: 51.6 sq. mi. Water area: 0.5 sq. mi.
Population density: 193 people per square mile
(very low).
OSM Map
General Map
Google Map
MSN Map
OSM Map
General Map
Google Map
MSN Map
OSM Map
General Map
Google Map
MSN Map
OSM Map
General Map
Google Map
MSN Map
Please wait while loading the map...
Real estate property taxes paid for housing units in 2022:
This zip code:
1.7% ($3,797)
Pennsylvania:
1.3% ($3,094)
Median real estate property taxes paid for housing units with mortgages in 2022: $3,970 (1.6%) Median real estate property taxes paid for housing units with no mortgage in 2022: $3,679 (1.7%)
Business Search- 14 Million verified businesses
Males: 5,303
(53.2%)
Females: 4,670
(46.8%)
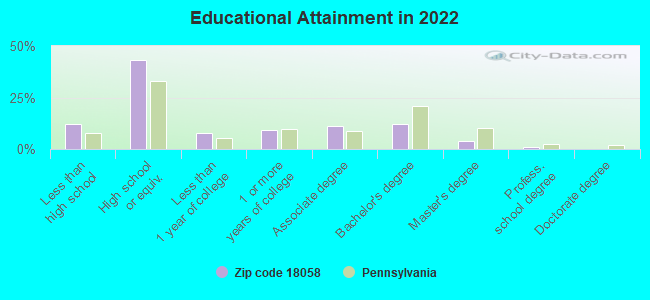
For population 25 years and over in 18058:
High school or higher: 86.8%
Bachelor's degree or higher: 16.8%
Graduate or professional degree: 4.8%
Unemployed: 1.9%
Mean travel time to work (commute): 34.0 minutes
For population 15 years and over in 18058:
Never married: 25.4%
Now married: 50.6%
Separated: 1.8%
Widowed: 8.4%
Divorced: 13.8%
Zip code 18058 compared to state average:
Unemployed percentage below state average.
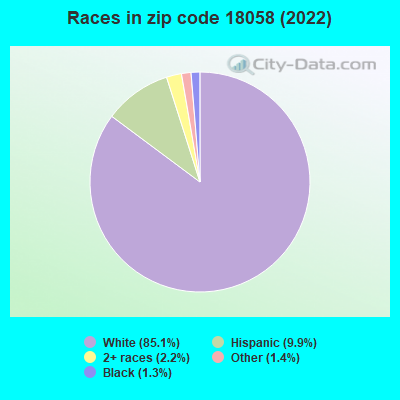
Black race population percentage significantly below state average.
Median age above state average.
Foreign-born population percentage below state average.
Renting percentage below state average.
House age below state average.
Percentage of population with a bachelor's degree or higher below state average.
Estimated median house/condo value in 2022: $230,088
18058:
$230,088
Pennsylvania:
$245,500
According to our research of Pennsylvania and other state lists, there were 10 registered sex offenders living in 18058 zip code as of June 18, 2024. The ratio of all residents to sex offenders in zip code 18058 is 1,030 to 1. The ratio of registered sex offenders to all residents in this zip code is lower than the state average.
Median resident age:
This zip code:
46.1 years
Pennsylvania median age:
40.9 years
Average household size:
This zip code:
2.7 people
Pennsylvania:
2.4 people
Averages for the 2020 tax year for zip code 18058, filed in 2021:
Average Adjusted Gross Income (AGI) in 2020: $59,466 (Individual Income Tax Returns)
Here:
$59,466
State:
$75,707
Salary/wage: $53,162 (reported on 81.7% of returns)
Here:
$53,162
State:
$62,806
(% of AGI for various income ranges: 1042.6% for AGIs below $25k, 3481.4% for AGIs $25k-50k, 6111.1% for AGIs $50k-75k, 9365.3% for AGIs $75k-100k, 16360.9% for AGIs $100k-200k, 54137.5% for AGIs over 200k)
Taxable interest for individuals: $1,153 (reported on 24.9% of returns)
This zip code:
$1,153
Pennsylvania:
$1,633
(% of AGI for various income ranges: 16.5% for AGIs below $25k, 12.1% for AGIs $25k-50k, 49.1% for AGIs $50k-75k, 41.8% for AGIs $75k-100k, 71.8% for AGIs $100k-200k, 830.0% for AGIs over 200k)
Ordinary dividends: $2,495 (reported on 16.2% of returns)
Here:
$2,495
State:
$7,382
(% of AGI for various income ranges: 22.5% for AGIs below $25k, 24.4% for AGIs $25k-50k, 43.9% for AGIs $50k-75k, 94.1% for AGIs $75k-100k, 104.7% for AGIs $100k-200k, 1030.0% for AGIs over 200k)
Net capital gain/loss in AGI: +$10,803 (reported on 13.0% of returns)
Here:
+$10,803
State:
+$23,522
(% of AGI for various income ranges: 4.0% for AGIs below $25k, 26.2% for AGIs $25k-50k, 61.9% for AGIs $50k-75k, 122.6% for AGIs $75k-100k, 352.7% for AGIs $100k-200k, 9892.5% for AGIs over 200k)
Profit/loss from business: +$14,537 (reported on 12.2% of returns)
Here:
+$14,537
State:
+$16,274
(% of AGI for various income ranges: 98.5% for AGIs below $25k, 107.4% for AGIs $25k-50k, 190.7% for AGIs $50k-75k, 415.6% for AGIs $75k-100k, 376.0% for AGIs $100k-200k, 5380.0% for AGIs over 200k)
Taxable individual retirement arrangement distribution: $14,761 (reported on 8.7% of returns)
18058:
$14,761
Pennsylvania:
$18,583
(% of AGI for various income ranges: 59.8% for AGIs below $25k, 86.8% for AGIs $25k-50k, 154.0% for AGIs $50k-75k, 244.1% for AGIs $75k-100k, 443.1% for AGIs $100k-200k, 2442.5% for AGIs over 200k)
Total itemized deductions: $24,011 (reported on 5.8% of returns)
Here:
$24,011
State:
$34,850
(% of AGI for various income ranges: 120.3% for AGIs $25k-50k, 203.9% for AGIs $50k-75k, 335.6% for AGIs $75k-100k, 452.4% for AGIs $100k-200k, 2652.5% for AGIs over 200k)
Charity contributions: $5,370 (reported on 4.3% of returns)
Here:
$5,370
State:
$12,392
(% of AGI for various income ranges: 8.8% for AGIs $25k-50k, 16.8% for AGIs $50k-75k, 68.8% for AGIs $75k-100k, 110.2% for AGIs $100k-200k, 422.5% for AGIs over 200k)
Taxes paid: $7,893 (reported on 5.8% of returns)
18058:
$7,893
State:
$8,200
(% of AGI for various income ranges: 38.2% for AGIs $25k-50k, 75.8% for AGIs $50k-75k, 105.3% for AGIs $75k-100k, 153.6% for AGIs $100k-200k, 765.0% for AGIs over 200k)
Earned income credit: $1,912 (reported on 12.8% of returns)
Here:
$1,912
State:
$2,100
(% of AGI for various income ranges: 71.0% for AGIs below $25k, 49.3% for AGIs $25k-50k)
Percentage of individuals using paid preparers for their 2020 taxes: 94.0%
Here:
94%
State:
92%
(% for various income ranges: 92.5% for AGIs below $25k, 94.8% for AGIs $25k-50k, 93.4% for AGIs $50k-75k, 95.8% for AGIs $75k-100k, 95.8% for AGIs $100k-200k, 91.7% for AGIs over 200k)
Averages for the 2012 tax year for zip code 18058, filed in 2013:
Average Adjusted Gross Income (AGI) in 2012: $47,853 (Individual Income Tax Returns)
Here:
$47,853
State:
$61,346
Salary/wage: $43,575 (reported on 84.0% of returns)
Here:
$43,575
State:
$51,902
(% of AGI for various income ranges: 69.2% for AGIs below $25k, 74.4% for AGIs $25k-50k, 76.2% for AGIs $50k-75k, 84.3% for AGIs $75k-100k, 83.1% for AGIs $100k-200k, 51.3% for AGIs over 200k)
Taxable interest for individuals: $938 (reported on 29.8% of returns)
This zip code:
$938
Pennsylvania:
$1,588
(% of AGI for various income ranges: 1.6% for AGIs below $25k, 0.5% for AGIs $25k-50k, 0.7% for AGIs $50k-75k, 0.3% for AGIs $75k-100k, 0.5% for AGIs $100k-200k, 0.2% for AGIs over 200k)
Ordinary dividends: $1,714 (reported on 18.3% of returns)
Here:
$1,714
State:
$5,827
(% of AGI for various income ranges: 1.2% for AGIs below $25k, 0.7% for AGIs $25k-50k, 0.7% for AGIs $50k-75k, 0.4% for AGIs $75k-100k, 0.6% for AGIs $100k-200k, 0.7% for AGIs over 200k)
Net capital gain/loss in AGI: +$951 (reported on 11.8% of returns)
Here:
+$951
State:
+$14,495
(% of AGI for various income ranges: 0.2% for AGIs $25k-50k, 0.2% for AGIs $50k-75k, 0.8% for AGIs $100k-200k)
Profit/loss from business: +$15,344 (reported on 11.3% of returns)
Here:
+$15,344
State:
+$16,268
(% of AGI for various income ranges: 5.7% for AGIs below $25k, 4.0% for AGIs $25k-50k, 2.5% for AGIs $50k-75k, 1.3% for AGIs $75k-100k, 6.1% for AGIs $100k-200k)
Taxable individual retirement arrangement distribution: $12,462 (reported on 10.5% of returns)
18058:
$12,462
Pennsylvania:
$14,550
(% of AGI for various income ranges: 3.9% for AGIs below $25k, 2.9% for AGIs $25k-50k, 2.9% for AGIs $50k-75k, 1.8% for AGIs $75k-100k, 3.5% for AGIs $100k-200k)
Total itemized deductions: $19,066 (23% of AGI, reported on 34.3% of returns)
Here:
$19,066
State:
$23,538
Here:
23.0% of AGI
State:
18.4% of AGI
(% of AGI for various income ranges: 10.5% for AGIs below $25k, 11.4% for AGIs $25k-50k, 14.0% for AGIs $50k-75k, 14.9% for AGIs $75k-100k, 15.9% for AGIs $100k-200k, 11.7% for AGIs over 200k)
Charity contributions: $1,972 (reported on 25.3% of returns)
Here:
$1,972
State:
$4,025
(% of AGI for various income ranges: 0.5% for AGIs below $25k, 0.7% for AGIs $25k-50k, 0.8% for AGIs $50k-75k, 1.3% for AGIs $75k-100k, 1.4% for AGIs $100k-200k, 1.7% for AGIs over 200k)
Taxes paid: $7,714 (reported on 34.1% of returns)
18058:
$7,714
State:
$9,982
(% of AGI for various income ranges: 2.9% for AGIs below $25k, 4.0% for AGIs $25k-50k, 5.3% for AGIs $50k-75k, 6.0% for AGIs $75k-100k, 7.1% for AGIs $100k-200k, 6.0% for AGIs over 200k)
Earned income credit: $2,064 (reported on 14.5% of returns)
Here:
$2,064
State:
$2,106
(% of AGI for various income ranges: 5.0% for AGIs below $25k, 0.9% for AGIs $25k-50k)
Percentage of individuals using paid preparers for their 2012 taxes: 58.6%
Here:
59%
State:
53%
(% for various income ranges: 53.5% for AGIs below $25k, 58.3% for AGIs $25k-50k, 65.6% for AGIs $50k-75k, 61.5% for AGIs $75k-100k, 62.5% for AGIs $100k-200k, 80.0% for AGIs over 200k)
Averages for the 2004 tax year for zip code 18058, filed in 2005:
Average Adjusted Gross Income (AGI) in 2004: $41,675 (Individual Income Tax Returns)
Here:
$41,675
State:
$48,049
Salary/wage: $38,668 (reported on 84.6% of returns)
Here:
$38,668
State:
$42,646
(% of AGI for various income ranges: 87.9% for AGIs below $10k, 68.0% for AGIs $10k-25k, 80.2% for AGIs $25k-50k, 86.9% for AGIs $50k-75k, 82.8% for AGIs $75k-100k, 66.4% for AGIs over 100k)
Taxable interest for individuals: $1,104 (reported on 49.0% of returns)
This zip code:
$1,104
Pennsylvania:
$1,657
(% of AGI for various income ranges: 5.5% for AGIs below $10k, 2.5% for AGIs $10k-25k, 1.3% for AGIs $25k-50k, 0.8% for AGIs $50k-75k, 1.2% for AGIs $75k-100k, 1.1% for AGIs over 100k)
Taxable dividends: $1,316 (reported on 22.2% of returns)
Here:
$1,316
State:
$3,566
(% of AGI for various income ranges: 2.3% for AGIs below $10k, 1.3% for AGIs $10k-25k, 0.7% for AGIs $25k-50k, 0.4% for AGIs $50k-75k, 0.7% for AGIs $75k-100k, 0.7% for AGIs over 100k)
Net capital gain/loss: +$4,002 (reported on 15.6% of returns)
Here:
+$4,002
State:
+$9,716
(% of AGI for various income ranges: -1.9% for AGIs below $10k, 0.4% for AGIs $10k-25k, 0.4% for AGIs $25k-50k, 0.2% for AGIs $50k-75k, 0.6% for AGIs $75k-100k, 5.7% for AGIs over 100k)
Profit/loss from business: +$12,932 (reported on 13.6% of returns)
Here:
+$12,932
State:
+$14,267
(% of AGI for various income ranges: 11.2% for AGIs below $10k, 8.0% for AGIs $10k-25k, 4.9% for AGIs $25k-50k, 1.9% for AGIs $50k-75k, 2.7% for AGIs $75k-100k, 5.5% for AGIs over 100k)
IRA payment deduction: $3,000 (reported on 3.1% of returns)
18058:
$3,000
Pennsylvania:
$2,903
(% of AGI for various income ranges: 0.5% for AGIs $10k-25k, 0.3% for AGIs $25k-50k, 0.1% for AGIs $50k-75k, 0.4% for AGIs $75k-100k)
Total itemized deductions: $17,669 (26% of AGI, reported on 37.8% of returns)
Here:
$17,669
State:
$18,804
Here:
25.6% of AGI
State:
19.5% of AGI
(% of AGI for various income ranges: 14.2% for AGIs below $10k, 9.5% for AGIs $10k-25k, 14.1% for AGIs $25k-50k, 16.5% for AGIs $50k-75k, 17.1% for AGIs $75k-100k, 19.3% for AGIs over 100k)
Charity contributions deductions: $1,611 (2% of AGI, reported on 32.2% of returns)
Here:
$1,611
State:
$3,337
Here:
2.3% of AGI
State:
3.3% of AGI
(% of AGI for various income ranges: 0.5% for AGIs below $10k, 0.7% for AGIs $10k-25k, 1.0% for AGIs $25k-50k, 1.2% for AGIs $50k-75k, 1.6% for AGIs $75k-100k, 1.5% for AGIs over 100k)
Total tax: $5,355 (reported on 75.0% of returns)
18058:
$5,355
State:
$8,008
(% of AGI for various income ranges: 3.4% for AGIs below $10k, 4.7% for AGIs $10k-25k, 6.6% for AGIs $25k-50k, 7.6% for AGIs $50k-75k, 9.9% for AGIs $75k-100k, 17.5% for AGIs over 100k)
Earned income credit: $1,527 (reported on 12.4% of returns)
Here:
$1,527
State:
$1,643
Percentage of individuals using paid preparers for their 2004 taxes: 61.6%
Here:
62%
State:
56%
(% for various income ranges: 54.0% for AGIs below $10k, 61.0% for AGIs $10k-25k, 63.4% for AGIs $25k-50k, 63.4% for AGIs $50k-75k, 67.3% for AGIs $75k-100k, 67.6% for AGIs over 100k)
Household received Food Stamps/SNAP in the past 12 months: 368 Household did not receive Food Stamps/SNAP in the past 12 months: 3,336
Women who had a birth in the past 12 months: 164 (81 now married, 74 unmarried) Women who did not have a birth in the past 12 months: 1,718 (676 now married, 1,042 unmarried)
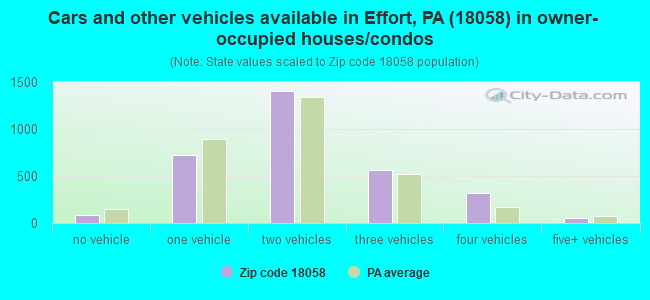
Housing units in zip code 18058 with a mortgage: 1,745 (114 second mortgage, 10 home equity loan, 70 both second mortgage and home equity loan) Houses without a mortgage: 167
Median monthly owner costs for units with a mortgage: $1,448 Median monthly owner costs for units without a mortgage: $660
Residents with income below the poverty level in 2022:
This zip code:
11.8%
Whole state:
11.8%
Residents with income below 50% of the poverty level in 2022:
This zip code:
8.1%
Whole state:
6.1%
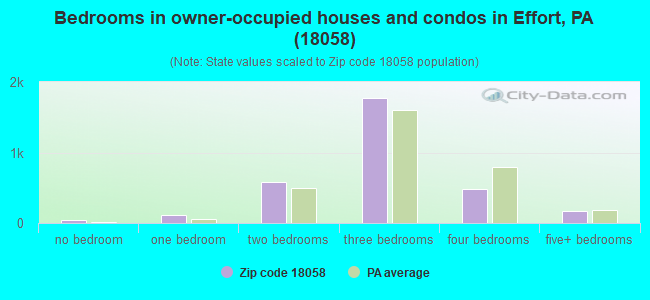
Median number of rooms in houses and condos:
Here:
5.9
State:
6.8
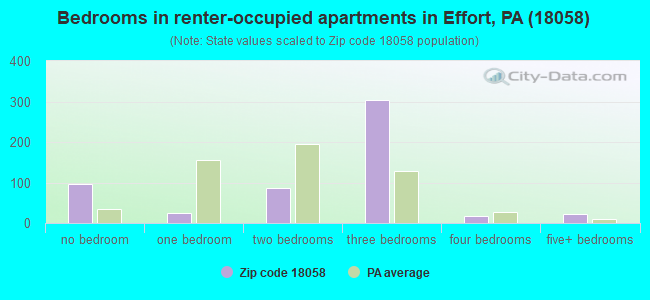
Median number of rooms in apartments:
Here:
5.3
State:
4.3
Notable locations in this zip code not listed on our city pages
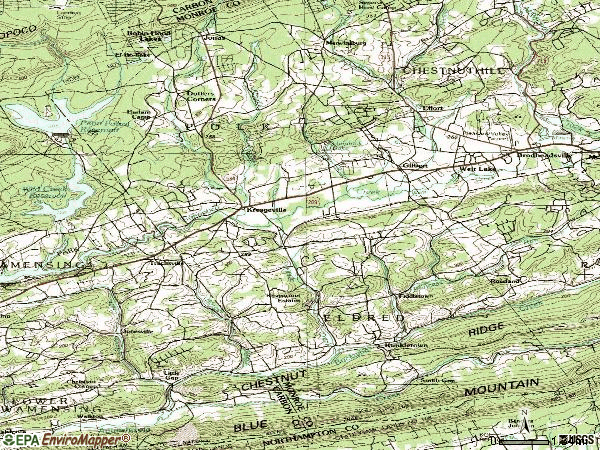
Notable locations in zip code 18058: Little Gap Ski Area (A), Twinflower (B), Hillside Terrace Acres (C), Harlam Camp (D), Indian Mountain Golf Course (E), Camp Trexler (F), Kunkletown Volunteer Fire Company Station 28 (G), Polk Township Volunteer Fire Department Station 35 (H). Display/hide their locations on the map
Streams, rivers, and creeks: Buckwha Creek (A), Dotters Creek (B), Jonas Creek (C), Hunter Creek (D), Hell Creek (E), Sterners Run (F), Middle Creek (G), Cross Run (H), Chapple Creek (I). Display/hide their locations on the map
In group quarters: 94 (-1 institutionalized population)
Size of family households: 1,170 2-persons, 606 3-persons, 347 4-persons, 298 5-persons, 117 6-persons, 67 7-or-more-persons
Size of nonfamily households: 846 1-person, 259 2-persons
1,261 married couples with children.
456 single-parent households (56 men, 400 women).
93.6% of residents of 18058 zip code speak English at home.
3.1% of residents speak Spanish at home (73% very well, 16% well, 11% not at all).
3.0% of residents speak other Indo-European language at home (52% very well, 37% well, 3% not well, 8% not at all).
0.1% of residents speak Asian or Pacific Island language at home (100% very well).
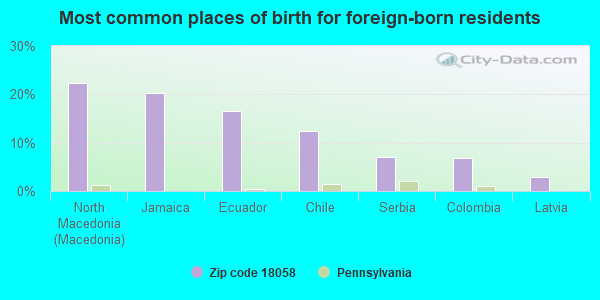
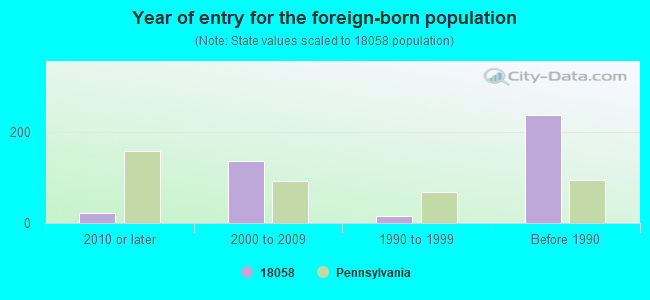
Foreign born population: 388 (3.9%) (70.5% of them are naturalized citizens)
This zip code:
3.9%
Whole state:
7.5%
22%North Macedonia (Macedonia)
20%Jamaica
17%Ecuador
12%Chile
7%Serbia
7%Colombia
3%Latvia
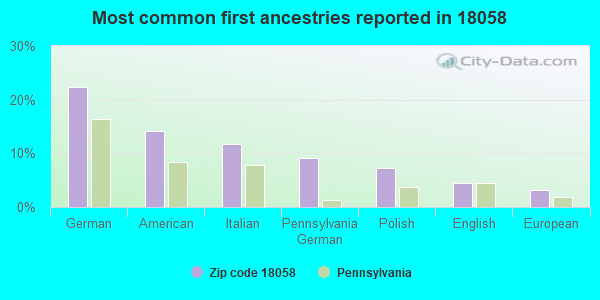
22%German
14%American
12%Italian
9%Pennsylvania German
7%Polish
4%English
3%European
Year of entry for the foreign-born population
212010 or later
1372000 to 2009
161990 to 1999
238Before 1990
Public elementary/middle schools in in zip code 18058 not listed on the city page:
Facilities with environmental interests located in this zip code:
BLUE MOUNTAIN WOODWORKING INC (RR #3 BOX 1 KUNKLETOWN RD in KUNKLETOWN, PA)
Conditionally Exempt Small Quantity Generators, less than 100 kg/month of hazardous waste (Resource Conservation and Recovery Act (tracking hazardous waste)) - notification Organizations: RICHARD & DEBORAH KNECHT (CONTACT/OWNER)
Housing units lacking complete plumbing facilities: 1.5% Housing units lacking complete kitchen facilities: 1.0%
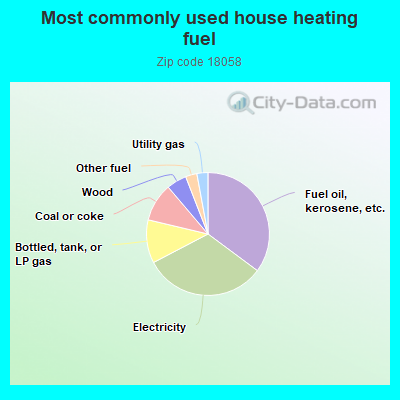
35.2%Fuel oil, kerosene, etc.
32.2%Electricity
11.4%Bottled, tank, or LP gas
10.1%Coal or coke
5.3%Wood
3.0%Other fuel
2.9%Utility gas
Population in 1990: 4,924. Population change in the 1990s: +2,751 (+55.9%).
Place of birth for U.S.-born residents:
This state: 5,969
Northeast: 2,908
Midwest: 291
South: 303
West: 90
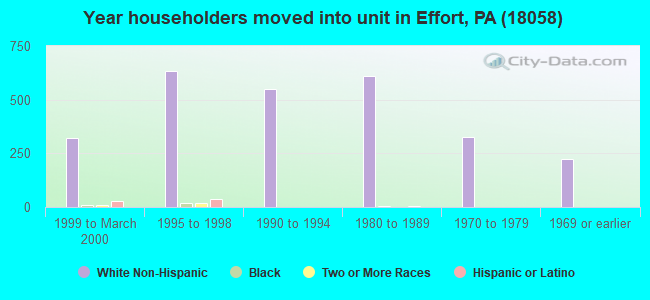
66% of the 18058 zip code residents lived in the same house 5 years ago. Out of people who lived in different houses, 45% lived in this county. Out of people who lived in different counties, 50% lived in Pennsylvania.
92% of the 18058 zip code residents lived in the same house 1 year ago. Out of people who lived in different houses, 39% moved from this county. Out of people who lived in different houses, 30% moved from different county within same state. Out of people who lived in different houses, 32% moved from different state.
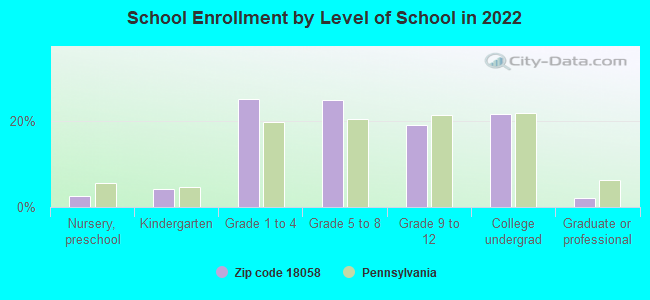
Private vs. public school enrollment:
Students in private schools in grades 1 to 8 (elementary and middle school): 17
Here:
2.0%
Pennsylvania:
15.7%
Students in private schools in grades 9 to 12 (high school): 13
Here:
3.9%
Pennsylvania:
13.4%
Students in private undergraduate colleges: 48
Here:
12.8%
Pennsylvania:
39.8%
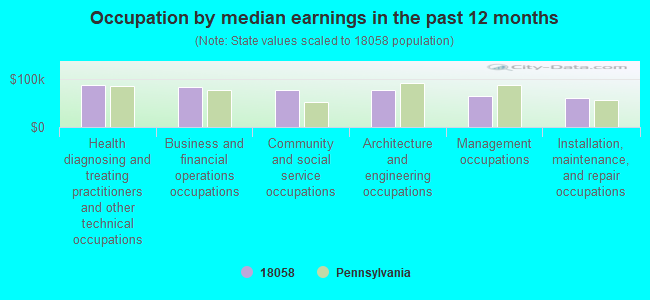
Occupation by median earnings in the past 12 months ($)
87,747Health diagnosing and treating practitioners and other technical occupations
83,401Business and financial operations occupations
77,466Community and social service occupations
77,307Architecture and engineering occupations
64,512Management occupations
61,028Installation, maintenance, and repair occupations
Companies with federal contracts located in this zip code:
THE BEST MACHINE SHOP INC (855 TRACHSVILLE HILL RD in KUNKLETOWN, PA; small business) : $36,402 in 19 contractsfrom 2003 to 2006
Contracts for Optical Sighting and Ranging Equipment, Nuts and Washers, Electrical Hardware and Supplies, Miscellaneous Electrical and Electronic Components, and moreby Army Signed by year:2000: $0; 2001: $0; 2002: $0; 2003: $3,816; 2004: $8,000; 2005: $19,546; 2006: $5,040.
Biggest contracts:
$7,250 with Army for Optical Sighting and Ranging Equipment. Signed on 2005-03-03. Completion date: 2005-03-25.
$5,050 with Army for Nuts and Washers. Signed on 2005-02-09. Completion date: 2005-03-09.
$3,300 with Army for Electrical Hardware and Supplies. Signed on 2006-05-31. Completion date: 2006-06-21.
$2,550 with Army for Miscellaneous Electrical and Electronic Components. Signed on 2005-12-20. Completion date: 2006-01-20.
Top industries in this zip code by the number of employees in 2005:
Professional, Scientific, and Technical Services: Veterinary Services (10-19: 1)
People in group quarters in 2010:
24 people in group homes for juveniles (non-correctional)
People in group quarters in 2000:
102 people in nursing homes
46 people in other group homes
14 people in homes or halfway houses for drug/alcohol abuse
10 people in other noninstitutional group quarters
4 people in homes for the mentally retarded
Fatal accident statistics in 2014:
Fatal accident count: 1
Vehicles involved in fatal accidents: 1
Fatal accidents caused by drunken drivers: 0
Fatalities: 1
Persons involved in fatal accidents: 3
Pedestrians involved in fatal accidents: 0
Fatal accident statistics in 2013:
Fatal accident count: 2
Vehicles involved in fatal accidents: 2
Fatal accidents caused by drunken drivers: 1
Fatalities: 2
Persons involved in fatal accidents: 2
Pedestrians involved in fatal accidents: 0
2004 - 2018 National Fire Incident Reporting System (NFIRS) incidents
According to the data from the years 2004 - 2018 the average number of fire incidents per year is 10. The highest number of reported fires - 37 took place in 2018, and the least - 0 in 2007. The data has an increasing trend.
When looking into fire subcategories, the most incidents belonged to: Structure Fires (50.7%), and Outside Fires (35.8%).
Fire incident types reported to NFIRS in Zip Code 18058


 Nearest zip codes: 18333, 18331, 18071, 18330, 18038, 18322.


 (Students: 1,642, Location: 477 POLK TOWNSHIP ROAD, Grades: 4-6)


 According to the data from the years 2004 - 2018 the average number of fire incidents per year is 10. The highest number of reported fires - 37 took place in 2018, and the least - 0 in 2007. The data has an increasing trend.
 When looking into fire subcategories, the most incidents belonged to: Structure Fires (50.7%), and Outside Fires (35.8%).