Estimated zip code population in 2022: 1,404 Zip code population in 2010: 1,662 Zip code population in 2000: 1,181
Houses and condos: 523 Renter-occupied apartments: 96
% of renters here:
19%
State:
31%
March 2022 cost of living index in zip code 18955: 104.2 (near average, U.S. average is 100)
Land area: 2.6 sq. mi. Water area: 0.0 sq. mi.
Population density: 533 people per square mile
(low).
OSM Map
General Map
Google Map
MSN Map
OSM Map
General Map
Google Map
MSN Map
OSM Map
General Map
Google Map
MSN Map
OSM Map
General Map
Google Map
MSN Map
Please wait while loading the map...
Real estate property taxes paid for housing units in 2022:
This zip code:
1.5% ($4,750)
Pennsylvania:
1.3% ($3,094)
Median real estate property taxes paid for housing units with mortgages in 2022: $4,466 (1.6%) Median real estate property taxes paid for housing units with no mortgage in 2022: $5,507 (1.4%)
Business Search- 14 Million verified businesses
Males: 680
(48.5%)
Females: 723
(51.5%)
For population 25 years and over in 18955:
High school or higher: 93.2%
Bachelor's degree or higher: 25.8%
Graduate or professional degree: 10.6%
Unemployed: 3.4%
Mean travel time to work (commute): 24.2 minutes
For population 15 years and over in 18955:
Never married: 27.6%
Now married: 56.1%
Separated: 2.7%
Widowed: 9.6%
Divorced: 4.0%
Zip code 18955 compared to state average:
Black race population percentage significantly below state average.
Foreign-born population percentage below state average.
Averages for the 2020 tax year for zip code 18955, filed in 2021:
Average Adjusted Gross Income (AGI) in 2020: $59,292 (Individual Income Tax Returns)
Here:
$59,292
State:
$75,707
Salary/wage: $53,762 (reported on 81.2% of returns)
Here:
$53,762
State:
$62,806
(% of AGI for various income ranges: 1027.6% for AGIs below $25k, 3707.5% for AGIs $25k-50k, 7187.8% for AGIs $50k-75k, 8687.5% for AGIs $75k-100k, 23078.3% for AGIs $100k-200k)
Taxable interest for individuals: $653 (reported on 37.5% of returns)
This zip code:
$653
Pennsylvania:
$1,633
(% of AGI for various income ranges: 18.2% for AGIs below $25k, 35.6% for AGIs $25k-50k, 14.4% for AGIs $50k-75k, 20.0% for AGIs $75k-100k, 131.7% for AGIs $100k-200k)
Ordinary dividends: $3,744 (reported on 20.0% of returns)
Here:
$3,744
State:
$7,382
(% of AGI for various income ranges: 27.6% for AGIs below $25k, 41.2% for AGIs $25k-50k, 33.8% for AGIs $75k-100k, 765.0% for AGIs $100k-200k)
Net capital gain/loss in AGI: +$9,208 (reported on 15.0% of returns)
Here:
+$9,208
State:
+$23,522
(% of AGI for various income ranges: 58.8% for AGIs $25k-50k, 26.7% for AGIs $50k-75k, 1646.7% for AGIs $100k-200k)
Profit/loss from business: +$13,800 (reported on 10.0% of returns)
Here:
+$13,800
State:
+$16,274
(% of AGI for various income ranges: 393.1% for AGIs $25k-50k, 791.7% for AGIs $100k-200k)
Taxable individual retirement arrangement distribution: $14,400 (reported on 10.0% of returns)
18955:
$14,400
Pennsylvania:
$18,583
(% of AGI for various income ranges: 85.3% for AGIs below $25k, 251.3% for AGIs $25k-50k, 756.2% for AGIs $75k-100k)
Total itemized deductions: $24,880 (reported on 6.2% of returns)
Here:
$24,880
State:
$34,850
(% of AGI for various income ranges: 366.2% for AGIs $25k-50k, 822.5% for AGIs $75k-100k)
Charity contributions: $4,200 (reported on 3.8% of returns)
Here:
$4,200
State:
$12,392
(% of AGI for various income ranges: 140.0% for AGIs $50k-75k)
Taxes paid: $7,180 (reported on 6.2% of returns)
18955:
$7,180
State:
$8,200
(% of AGI for various income ranges: 92.5% for AGIs $25k-50k, 263.8% for AGIs $75k-100k)
Earned income credit: $1,900 (reported on 10.0% of returns)
Here:
$1,900
State:
$2,100
(% of AGI for various income ranges: 61.8% for AGIs below $25k, 29.4% for AGIs $25k-50k)
Percentage of individuals using paid preparers for their 2020 taxes: 92.5%
Here:
92%
State:
92%
(% for various income ranges: 91.3% for AGIs below $25k, 90.9% for AGIs $25k-50k, 92.3% for AGIs $50k-75k, 90.0% for AGIs $75k-100k, 100.0% for AGIs $100k-200k)
Averages for the 2012 tax year for zip code 18955, filed in 2013:
Average Adjusted Gross Income (AGI) in 2012: $51,988 (Individual Income Tax Returns)
Here:
$51,988
State:
$61,346
Salary/wage: $45,759 (reported on 86.2% of returns)
Here:
$45,759
State:
$51,902
(% of AGI for various income ranges: 72.5% for AGIs below $25k, 86.2% for AGIs $25k-50k, 81.2% for AGIs $50k-75k, 85.9% for AGIs $75k-100k, 64.7% for AGIs $100k-200k)
Taxable interest for individuals: $740 (reported on 37.5% of returns)
This zip code:
$740
Pennsylvania:
$1,588
(% of AGI for various income ranges: 2.4% for AGIs below $25k, 0.2% for AGIs $25k-50k, 0.6% for AGIs $50k-75k, 0.4% for AGIs $100k-200k)
Ordinary dividends: $5,094 (reported on 20.0% of returns)
Here:
$5,094
State:
$5,827
(% of AGI for various income ranges: 0.9% for AGIs below $25k, 0.5% for AGIs $25k-50k, 0.4% for AGIs $50k-75k, 0.4% for AGIs $75k-100k, 4.3% for AGIs $100k-200k)
Net capital gain/loss in AGI: +$2,840 (reported on 12.5% of returns)
Here:
+$2,840
State:
+$14,495
(% of AGI for various income ranges: 1.9% for AGIs $100k-200k)
Profit/loss from business: +$8,890 (reported on 12.5% of returns)
Here:
+$8,890
State:
+$16,268
(% of AGI for various income ranges: 5.1% for AGIs below $25k, 4.2% for AGIs $25k-50k, 5.7% for AGIs $75k-100k)
Taxable individual retirement arrangement distribution: $14,086 (reported on 8.8% of returns)
18955:
$14,086
Pennsylvania:
$14,550
(% of AGI for various income ranges: 3.1% for AGIs below $25k, 2.2% for AGIs $25k-50k, 9.4% for AGIs $50k-75k)
Total itemized deductions: $17,924 (20% of AGI, reported on 36.2% of returns)
Here:
$17,924
State:
$23,538
Here:
19.8% of AGI
State:
18.4% of AGI
(% of AGI for various income ranges: 20.3% for AGIs below $25k, 9.1% for AGIs $25k-50k, 12.1% for AGIs $50k-75k, 17.6% for AGIs $75k-100k, 10.8% for AGIs $100k-200k)
Charity contributions: $2,032 (reported on 23.8% of returns)
Here:
$2,032
State:
$4,025
(% of AGI for various income ranges: 0.8% for AGIs $25k-50k, 1.0% for AGIs $50k-75k, 1.4% for AGIs $75k-100k, 0.9% for AGIs $100k-200k)
Taxes paid: $7,752 (reported on 36.2% of returns)
18955:
$7,752
State:
$9,982
(% of AGI for various income ranges: 3.0% for AGIs below $25k, 3.3% for AGIs $25k-50k, 5.3% for AGIs $50k-75k, 7.0% for AGIs $75k-100k, 6.4% for AGIs $100k-200k)
Earned income credit: $1,710 (reported on 12.5% of returns)
Here:
$1,710
State:
$2,106
(% of AGI for various income ranges: 3.9% for AGIs below $25k, 0.6% for AGIs $25k-50k)
Percentage of individuals using paid preparers for their 2012 taxes: 46.2%
Here:
46%
State:
53%
(% for various income ranges: 37.9% for AGIs below $25k, 50.0% for AGIs $25k-50k, 58.3% for AGIs $50k-75k, 37.5% for AGIs $75k-100k, 55.6% for AGIs $100k-200k)
Averages for the 2004 tax year for zip code 18955, filed in 2005:
Average Adjusted Gross Income (AGI) in 2004: $43,619 (Individual Income Tax Returns)
Here:
$43,619
State:
$48,049
Salary/wage: $40,919 (reported on 89.5% of returns)
Here:
$40,919
State:
$42,646
(% of AGI for various income ranges: 87.1% for AGIs below $10k, 78.4% for AGIs $10k-25k, 92.4% for AGIs $25k-50k, 87.5% for AGIs $50k-75k, 93.5% for AGIs $75k-100k, 64.6% for AGIs over 100k)
Taxable interest for individuals: $859 (reported on 44.2% of returns)
This zip code:
$859
Pennsylvania:
$1,657
(% of AGI for various income ranges: 7.9% for AGIs below $10k, 2.9% for AGIs $10k-25k, 0.5% for AGIs $25k-50k, 0.8% for AGIs $50k-75k, 0.2% for AGIs $75k-100k, 0.6% for AGIs over 100k)
Taxable dividends: $1,901 (reported on 25.8% of returns)
Here:
$1,901
State:
$3,566
(% of AGI for various income ranges: 5.0% for AGIs below $10k, 0.5% for AGIs $10k-25k, 0.3% for AGIs $25k-50k, 1.3% for AGIs $50k-75k, 0.1% for AGIs $75k-100k, 2.6% for AGIs over 100k)
Net capital gain/loss: +$3,576 (reported on 15.0% of returns)
Here:
+$3,576
State:
+$9,716
(% of AGI for various income ranges: -3.5% for AGIs below $10k, -0.3% for AGIs $25k-50k, 0.2% for AGIs $50k-75k, 5.8% for AGIs over 100k)
Profit/loss from business: +$7,759 (reported on 13.7% of returns)
Here:
+$7,759
State:
+$14,267
(% of AGI for various income ranges: 4.4% for AGIs below $10k, 4.7% for AGIs $10k-25k, 3.1% for AGIs $25k-50k, 1.0% for AGIs $50k-75k, 4.6% for AGIs over 100k)
IRA payment deduction: $2,684 (reported on 2.4% of returns)
18955:
$2,684
Pennsylvania:
$2,903
Total itemized deductions: $16,364 (22% of AGI, reported on 36.3% of returns)
Here:
$16,364
State:
$18,804
Here:
22.2% of AGI
State:
19.5% of AGI
(% of AGI for various income ranges: 12.0% for AGIs $10k-25k, 12.2% for AGIs $25k-50k, 14.2% for AGIs $50k-75k, 17.0% for AGIs $75k-100k, 13.1% for AGIs over 100k)
Charity contributions deductions: $1,983 (3% of AGI, reported on 29.4% of returns)
Here:
$1,983
State:
$3,337
Here:
2.6% of AGI
State:
3.3% of AGI
(% of AGI for various income ranges: 0.9% for AGIs $10k-25k, 1.2% for AGIs $25k-50k, 1.2% for AGIs $50k-75k, 1.8% for AGIs $75k-100k, 1.5% for AGIs over 100k)
Total tax: $5,777 (reported on 78.0% of returns)
18955:
$5,777
State:
$8,008
(% of AGI for various income ranges: 1.9% for AGIs below $10k, 4.7% for AGIs $10k-25k, 7.6% for AGIs $25k-50k, 8.9% for AGIs $50k-75k, 9.8% for AGIs $75k-100k, 18.0% for AGIs over 100k)
Earned income credit: $1,507 (reported on 9.0% of returns)
Here:
$1,507
State:
$1,643
Percentage of individuals using paid preparers for their 2004 taxes: 54.1%
Here:
54%
State:
56%
(% for various income ranges: 50.3% for AGIs below $10k, 49.7% for AGIs $10k-25k, 54.7% for AGIs $25k-50k, 53.3% for AGIs $50k-75k, 63.5% for AGIs $75k-100k, 69.2% for AGIs over 100k)
Likely homosexual households (counted as self-reported same-sex unmarried-partner households)
Lesbian couples: 0.6% of all households
Gay men: 0.0% of all households
Household received Food Stamps/SNAP in the past 12 months: 29 Household did not receive Food Stamps/SNAP in the past 12 months: 473
Women who had a birth in the past 12 months: 14 (15 now married, 0 unmarried) Women who did not have a birth in the past 12 months: 227 (130 now married, 95 unmarried)
Housing units in zip code 18955 with a mortgage: 226 (22 second mortgage, 3 home equity loan, 19 both second mortgage and home equity loan) Houses without a mortgage: 43
Median monthly owner costs for units with a mortgage: $1,633 Median monthly owner costs for units without a mortgage: $677
Residents with income below the poverty level in 2022:
This zip code:
1.9%
Whole state:
11.8%
Residents with income below 50% of the poverty level in 2022:
This zip code:
1.3%
Whole state:
6.1%
Median number of rooms in houses and condos:
Here:
6.7
State:
6.8
Median number of rooms in apartments:
Here:
4.1
State:
4.3
Notable locations in this zip code not listed on our city pages
In group quarters: 145 (-1 institutionalized population)
Size of family households: 119 2-persons, 55 3-persons, 89 4-persons, 55 5-persons, 4 6-persons
Size of nonfamily households: 145 1-person, 33 2-persons
261 married couples with children.
33 single-parent households (33 women).
90.8% of residents of 18955 zip code speak English at home.
4.7% of residents speak Spanish at home (68% very well, 29% not well, 3% not at all).
0.7% of residents speak other Indo-European language at home (100% very well).
3.5% of residents speak other language at home (76% very well, 24% well).
Foreign born population: 66 (4.7%) (54.1% of them are naturalized citizens)
This zip code:
4.7%
Whole state:
7.5%
21%Haiti
20%Cambodia
14%Iraq
12%Italy
12%Honduras
33%German
7%American
7%Irish
5%Hungarian
5%Italian
5%Pennsylvania German
4%Polish
Year of entry for the foreign-born population
362010 or later
92000 to 2009
01990 to 1999
21Before 1990
Facilities with environmental interests located in this zip code:
AMERICAN OLEAN TILE CO MINE SI (EAST PUMPINGSTATION RD in RICHLANDTOWN, PA)
(Resource Conservation and Recovery Act (tracking hazardous waste)) Organizations: OPERNAME (CONTACT/OPERATOR)
, NATIONAL GYPSUM (CONTACT/OWNER)
Housing units lacking complete plumbing facilities: 1.5% Housing units lacking complete kitchen facilities: 3.1%
34.0%Utility gas
32.2%Electricity
20.3%Fuel oil, kerosene, etc.
5.7%Bottled, tank, or LP gas
4.9%Wood
2.0%Solar energy
1.4%Coal or coke
Population in 1990: 1,199.
Place of birth for U.S.-born residents:
This state: 1,156
Northeast: 93
Midwest: 46
South: 25
West: 9
48% of the 18955 zip code residents lived in the same house 5 years ago. Out of people who lived in different houses, 69% lived in this county. Out of people who lived in different counties, 50% lived in Pennsylvania.
92% of the 18955 zip code residents lived in the same house 1 year ago. Out of people who lived in different houses, 71% moved from this county. Out of people who lived in different houses, 25% moved from different county within same state.
Private vs. public school enrollment:
Students in private schools in grades 1 to 8 (elementary and middle school): 9
Here:
6.1%
Pennsylvania:
15.7%
Students in private schools in grades 9 to 12 (high school): 20
Here:
61.6%
Pennsylvania:
13.4%
Students in private undergraduate colleges:
Here:
0.0%
Pennsylvania:
39.8%
Occupation by median earnings in the past 12 months ($)
84,007Computer and mathematical occupations
77,913Installation, maintenance, and repair occupations
66,331Health technologists and technicians
63,865Management occupations
60,813Sales and related occupations
58,399Construction and extraction occupations
Top industries in this zip code by the number of employees in 2005:
Health Care and Social Assistance: Nursing Care Facilities (100-249 employees: 1 establishment)
Accommodation and Food Services: Food Service Contractors (20-49: 1)
Accommodation and Food Services: Limited-Service Restaurants (10-19: 2, 1-4: 1)
Other Services (except Public Administration): Industrial Launderers (10-19: 1)
Finance and Insurance: Savings Institutions (5-9: 1)
Finance and Insurance: Insurance Agencies and Brokerages (5-9: 1)
People in group quarters in 2010:
122 people in nursing facilities/skilled-nursing facilities
People in group quarters in 2000:
124 people in nursing homes
Home Mortgage Disclosure Act Aggregated Statistics For Year 2009 (Based on 2 partial tracts)
B) Conventional Home Purchase Loans
C) Refinancings
D) Home Improvement Loans
Number
Average Value
Number
Average Value
Number
Average Value
LOANS ORIGINATED
1
$203,240
4
$252,165
1
$44,470
APPLICATIONS APPROVED, NOT ACCEPTED
0
$0
1
$117,760
0
$0
APPLICATIONS DENIED
0
$0
2
$214,885
0
$0
APPLICATIONS WITHDRAWN
0
$0
1
$169,060
0
$0
FILES CLOSED FOR INCOMPLETENESS
0
$0
0
$0
0
$0
Aggregated Statistics For Year 2008 (Based on 2 partial tracts)
B) Conventional Home Purchase Loans
C) Refinancings
D) Home Improvement Loans
Number
Average Value
Number
Average Value
Number
Average Value
LOANS ORIGINATED
1
$423,540
2
$285,100
1
$31,190
APPLICATIONS APPROVED, NOT ACCEPTED
0
$0
0
$0
0
$0
APPLICATIONS DENIED
0
$0
1
$195,430
0
$0
APPLICATIONS WITHDRAWN
0
$0
0
$0
0
$0
FILES CLOSED FOR INCOMPLETENESS
0
$0
0
$0
0
$0
Aggregated Statistics For Year 2007 (Based on 2 partial tracts)
B) Conventional Home Purchase Loans
C) Refinancings
D) Home Improvement Loans
Number
Average Value
Number
Average Value
Number
Average Value
LOANS ORIGINATED
1
$413,500
3
$239,597
1
$89,790
APPLICATIONS APPROVED, NOT ACCEPTED
0
$0
0
$0
0
$0
APPLICATIONS DENIED
0
$0
1
$321,900
0
$0
APPLICATIONS WITHDRAWN
0
$0
1
$278,360
0
$0
FILES CLOSED FOR INCOMPLETENESS
0
$0
0
$0
0
$0
Aggregated Statistics For Year 2006 (Based on 2 partial tracts)
B) Conventional Home Purchase Loans
C) Refinancings
D) Home Improvement Loans
F) Non-occupant Loans on < 5 Family Dwellings (A B C & D)
Number
Average Value
Number
Average Value
Number
Average Value
Number
Average Value
LOANS ORIGINATED
2
$257,045
4
$183,125
1
$143,590
1
$155,780
APPLICATIONS APPROVED, NOT ACCEPTED
0
$0
1
$184,710
0
$0
0
$0
APPLICATIONS DENIED
0
$0
2
$186,740
1
$57,980
0
$0
APPLICATIONS WITHDRAWN
0
$0
1
$395,670
0
$0
0
$0
FILES CLOSED FOR INCOMPLETENESS
0
$0
0
$0
0
$0
0
$0
Aggregated Statistics For Year 2005 (Based on 2 partial tracts)
B) Conventional Home Purchase Loans
C) Refinancings
D) Home Improvement Loans
Number
Average Value
Number
Average Value
Number
Average Value
LOANS ORIGINATED
2
$306,465
4
$222,420
1
$101,940
APPLICATIONS APPROVED, NOT ACCEPTED
0
$0
1
$164,150
0
$0
APPLICATIONS DENIED
0
$0
1
$329,260
0
$0
APPLICATIONS WITHDRAWN
0
$0
2
$186,655
0
$0
FILES CLOSED FOR INCOMPLETENESS
0
$0
0
$0
0
$0
Aggregated Statistics For Year 2004 (Based on 2 partial tracts)
B) Conventional Home Purchase Loans
C) Refinancings
D) Home Improvement Loans
Number
Average Value
Number
Average Value
Number
Average Value
LOANS ORIGINATED
2
$206,790
5
$164,338
2
$51,945
APPLICATIONS APPROVED, NOT ACCEPTED
0
$0
1
$144,210
0
$0
APPLICATIONS DENIED
0
$0
2
$189,925
0
$0
APPLICATIONS WITHDRAWN
0
$0
1
$252,500
0
$0
FILES CLOSED FOR INCOMPLETENESS
0
$0
0
$0
0
$0
Aggregated Statistics For Year 2003 (Based on 2 partial tracts)
B) Conventional Home Purchase Loans
C) Refinancings
D) Home Improvement Loans
Number
Average Value
Number
Average Value
Number
Average Value
LOANS ORIGINATED
2
$276,065
10
$169,392
1
$64,920
APPLICATIONS APPROVED, NOT ACCEPTED
0
$0
1
$169,400
0
$0
APPLICATIONS DENIED
0
$0
2
$223,060
0
$0
APPLICATIONS WITHDRAWN
0
$0
2
$162,335
0
$0
FILES CLOSED FOR INCOMPLETENESS
0
$0
0
$0
0
$0
Aggregated Statistics For Year 2002 (Based on 2 partial tracts)
B) Conventional Home Purchase Loans
C) Refinancings
D) Home Improvement Loans
Number
Average Value
Number
Average Value
Number
Average Value
LOANS ORIGINATED
2
$156,680
6
$173,205
1
$49,860
APPLICATIONS APPROVED, NOT ACCEPTED
0
$0
1
$137,840
0
$0
APPLICATIONS DENIED
0
$0
1
$222,100
0
$0
APPLICATIONS WITHDRAWN
0
$0
1
$135,870
0
$0
FILES CLOSED FOR INCOMPLETENESS
0
$0
0
$0
0
$0
Aggregated Statistics For Year 2001 (Based on 2 partial tracts)
B) Conventional Home Purchase Loans
C) Refinancings
D) Home Improvement Loans
Number
Average Value
Number
Average Value
Number
Average Value
LOANS ORIGINATED
2
$198,825
5
$155,010
1
$38,550
APPLICATIONS APPROVED, NOT ACCEPTED
0
$0
1
$79,580
0
$0
APPLICATIONS DENIED
0
$0
2
$116,055
0
$0
APPLICATIONS WITHDRAWN
0
$0
1
$194,520
0
$0
FILES CLOSED FOR INCOMPLETENESS
0
$0
0
$0
0
$0
Aggregated Statistics For Year 2000 (Based on 2 partial tracts)
B) Conventional Home Purchase Loans
C) Refinancings
D) Home Improvement Loans
Number
Average Value
Number
Average Value
Number
Average Value
LOANS ORIGINATED
2
$146,515
2
$61,925
1
$22,930
APPLICATIONS APPROVED, NOT ACCEPTED
0
$0
0
$0
0
$0
APPLICATIONS DENIED
0
$0
1
$89,170
0
$0
APPLICATIONS WITHDRAWN
0
$0
0
$0
0
$0
FILES CLOSED FOR INCOMPLETENESS
0
$0
0
$0
0
$0
Aggregated Statistics For Year 1999 (Based on 1 partial tract)

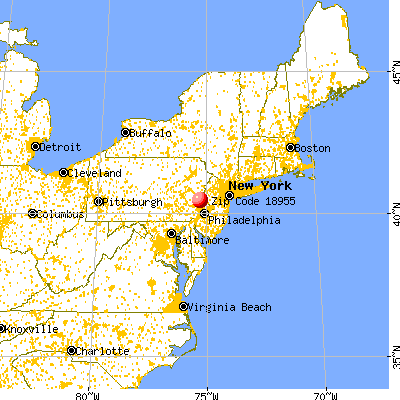


 Nearest zip codes: 18951, 18036, 18081, 18970, 18935, 18930.