Estimated zip code population in 2022: 2,206 Zip code population in 2010: 1,858 Zip code population in 2000: 1,717
Houses and condos: 662 Renter-occupied apartments: 97
% of renters here:
17%
State:
32%
March 2022 cost of living index in zip code 21649: 93.4 (less than average, U.S. average is 100)
Land area: 17.0 sq. mi. Water area: 0.0 sq. mi.
Population density: 130 people per square mile
(very low).
OSM Map
General Map
Google Map
MSN Map
OSM Map
General Map
Google Map
MSN Map
OSM Map
General Map
Google Map
MSN Map
OSM Map
General Map
Google Map
MSN Map
Please wait while loading the map...
Real estate property taxes paid for housing units in 2022:
This zip code:
0.8% ($1,585)
Maryland:
0.9% ($3,777)
Median real estate property taxes paid for housing units with mortgages in 2022: $1,395 (0.6%) Median real estate property taxes paid for housing units with no mortgage in 2022: $1,714 (0.9%)
Business Search- 14 Million verified businesses
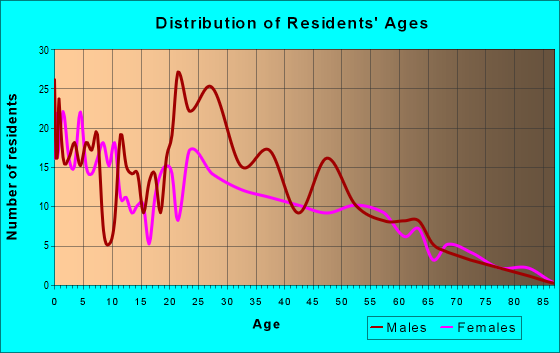
Males: 1,323
(60.0%)
Females: 882
(40.0%)
For population 25 years and over in 21649:
High school or higher: 74.4%
Bachelor's degree or higher: 18.7%
Graduate or professional degree: 11.2%
Unemployed: 3.7%
Mean travel time to work (commute): 26.8 minutes
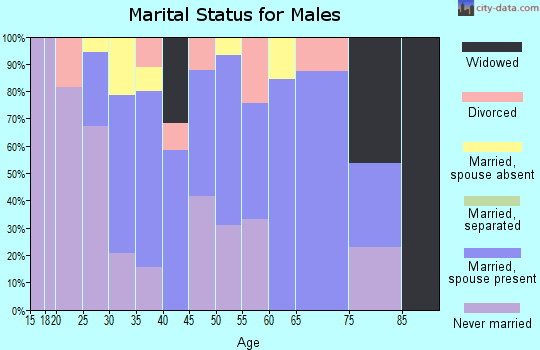
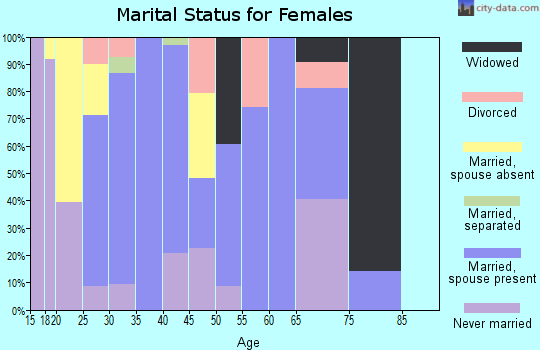
For population 15 years and over in 21649:
Never married: 43.9%
Now married: 38.3%
Separated: 0.2%
Widowed: 9.5%
Divorced: 8.1%
Zip code 21649 compared to state average:
Median household income below state average.
Median house value below state average.
Black race population percentage significantly below state average.
Hispanic race population percentage significantly above state average.
Median age below state average.
Foreign-born population percentage above state average.
Renting percentage below state average.
Length of stay since moving in significantly above state average.
Number of college students below state average.
Percentage of population with a bachelor's degree or higher significantly below state average.
Averages for the 2020 tax year for zip code 21649, filed in 2021:
Average Adjusted Gross Income (AGI) in 2020: $45,287 (Individual Income Tax Returns)
Here:
$45,287
State:
$86,905
Salary/wage: $47,668 (reported on 77.9% of returns)
Here:
$47,668
State:
$73,953
(% of AGI for various income ranges: 1844.6% for AGIs below $25k, 4627.6% for AGIs $25k-50k, 7387.1% for AGIs $50k-75k, 11860.0% for AGIs $75k-100k, 24017.5% for AGIs $100k-200k)
Taxable interest for individuals: $367 (reported on 19.5% of returns)
This zip code:
$367
Maryland:
$1,528
(% of AGI for various income ranges: 10.0% for AGIs below $25k, 4.7% for AGIs $25k-50k, 20.0% for AGIs $50k-75k, 50.0% for AGIs $100k-200k)
Ordinary dividends: $1,220 (reported on 6.5% of returns)
Here:
$1,220
State:
$8,028
(% of AGI for various income ranges: 9.2% for AGIs below $25k, 163.3% for AGIs $75k-100k)
Net capital gain/loss in AGI: +$2,425 (reported on 5.2% of returns)
Here:
+$2,425
State:
+$25,238
(% of AGI for various income ranges: 138.6% for AGIs $50k-75k)
Profit/loss from business: +$5,229 (reported on 27.3% of returns)
Here:
+$5,229
State:
+$11,398
(% of AGI for various income ranges: 324.6% for AGIs below $25k, 308.2% for AGIs $25k-50k, 506.7% for AGIs $75k-100k)
Taxable individual retirement arrangement distribution: $6,367 (reported on 3.9% of returns)
21649:
$6,367
Maryland:
$20,944
(% of AGI for various income ranges: 112.4% for AGIs $25k-50k)
Total itemized deductions: $24,120 (reported on 6.5% of returns)
Here:
$24,120
State:
$30,672
(% of AGI for various income ranges: 297.1% for AGIs $25k-50k, 1752.5% for AGIs $100k-200k)
Charity contributions: $6,267 (reported on 3.9% of returns)
Here:
$6,267
State:
$9,065
(% of AGI for various income ranges: 470.0% for AGIs $100k-200k)
Taxes paid: $7,167 (reported on 7.8% of returns)
21649:
$7,167
State:
$8,475
(% of AGI for various income ranges: 102.9% for AGIs $25k-50k, 637.5% for AGIs $100k-200k)
Earned income credit: $2,845 (reported on 14.3% of returns)
Here:
$2,845
State:
$2,151
(% of AGI for various income ranges: 132.3% for AGIs below $25k, 82.9% for AGIs $25k-50k)
Percentage of individuals using paid preparers for their 2020 taxes: 80.5%
Here:
81%
State:
90%
(% for various income ranges: 75.9% for AGIs below $25k, 80.0% for AGIs $25k-50k, 90.0% for AGIs $50k-75k, 80.0% for AGIs $75k-100k, 87.5% for AGIs $100k-200k)
Averages for the 2012 tax year for zip code 21649, filed in 2013:
Average Adjusted Gross Income (AGI) in 2012: $35,651 (Individual Income Tax Returns)
Here:
$35,651
State:
$72,703
Salary/wage: $34,509 (reported on 82.6% of returns)
Here:
$34,509
State:
$62,228
(% of AGI for various income ranges: 78.1% for AGIs below $25k, 85.1% for AGIs $25k-50k, 80.3% for AGIs $50k-75k, 75.2% for AGIs $75k-100k, 78.4% for AGIs $100k-200k)
Taxable interest for individuals: $288 (reported on 23.2% of returns)
This zip code:
$288
Maryland:
$1,413
(% of AGI for various income ranges: 0.3% for AGIs below $25k, 0.2% for AGIs $25k-50k, 0.3% for AGIs $50k-75k, 0.2% for AGIs $75k-100k)
Ordinary dividends: $450 (reported on 5.8% of returns)
Here:
$450
State:
$6,933
Net capital gain/loss in AGI: +$100 (reported on 4.3% of returns)
Here:
+$100
State:
+$14,830
Profit/loss from business: +$6,367 (reported on 17.4% of returns)
Here:
+$6,367
State:
+$12,606
(% of AGI for various income ranges: 12.1% for AGIs below $25k, 3.6% for AGIs $25k-50k, 0.2% for AGIs $50k-75k)
Taxable individual retirement arrangement distribution: $5,850 (reported on 5.8% of returns)
21649:
$5,850
Maryland:
$17,065
Total itemized deductions: $19,681 (27% of AGI, reported on 23.2% of returns)
Here:
$19,681
State:
$27,886
Here:
27.1% of AGI
State:
22.8% of AGI
(% of AGI for various income ranges: 15.5% for AGIs $25k-50k, 14.7% for AGIs $50k-75k, 17.0% for AGIs $75k-100k, 15.1% for AGIs $100k-200k)
Charity contributions: $2,275 (reported on 17.4% of returns)
Here:
$2,275
State:
$4,452
(% of AGI for various income ranges: 1.5% for AGIs $25k-50k, 1.9% for AGIs $50k-75k, 1.2% for AGIs $75k-100k, 0.8% for AGIs $100k-200k)
Taxes paid: $6,356 (reported on 23.2% of returns)
21649:
$6,356
State:
$11,690
(% of AGI for various income ranges: 2.7% for AGIs $25k-50k, 3.9% for AGIs $50k-75k, 6.6% for AGIs $75k-100k, 7.4% for AGIs $100k-200k)
Earned income credit: $2,758 (reported on 17.4% of returns)
Here:
$2,758
State:
$2,199
(% of AGI for various income ranges: 5.5% for AGIs below $25k, 1.4% for AGIs $25k-50k)
Percentage of individuals using paid preparers for their 2012 taxes: 63.8%
Here:
64%
State:
52%
(% for various income ranges: 63.6% for AGIs below $25k, 60.0% for AGIs $25k-50k, 71.4% for AGIs $50k-75k, 60.0% for AGIs $75k-100k, 75.0% for AGIs $100k-200k)
Averages for the 2004 tax year for zip code 21649, filed in 2005:
Average Adjusted Gross Income (AGI) in 2004: $34,221 (Individual Income Tax Returns)
Here:
$34,221
State:
$60,339
Salary/wage: $31,631 (reported on 85.5% of returns)
Here:
$31,631
State:
$52,211
(% of AGI for various income ranges: 84.8% for AGIs below $10k, 84.1% for AGIs $10k-25k, 88.3% for AGIs $25k-50k, 85.1% for AGIs $50k-75k, 88.5% for AGIs $75k-100k, 53.7% for AGIs over 100k)
Taxable interest for individuals: $462 (reported on 32.2% of returns)
This zip code:
$462
Maryland:
$1,701
(% of AGI for various income ranges: 1.1% for AGIs below $10k, 0.8% for AGIs $10k-25k, 0.3% for AGIs $25k-50k, 0.2% for AGIs $50k-75k, 0.1% for AGIs $75k-100k, 0.6% for AGIs over 100k)
Taxable dividends: $321 (reported on 9.8% of returns)
Here:
$321
State:
$4,235
(% of AGI for various income ranges: 0.6% for AGIs below $10k, 0.0% for AGIs $25k-50k, 0.3% for AGIs $50k-75k, 0.1% for AGIs $75k-100k)
Net capital gain/loss: +$18,636 (reported on 7.7% of returns)
Here:
+$18,636
State:
+$15,888
Profit/loss from business: +$4,187 (reported on 15.9% of returns)
Here:
+$4,187
State:
+$12,221
(% of AGI for various income ranges: 16.0% for AGIs below $10k, 5.0% for AGIs $10k-25k, 2.1% for AGIs $25k-50k, 0.1% for AGIs $50k-75k, 0.5% for AGIs $75k-100k)
Total itemized deductions: $17,558 (25% of AGI, reported on 24.2% of returns)
Here:
$17,558
State:
$22,960
Here:
25.4% of AGI
State:
23.3% of AGI
(% of AGI for various income ranges: 5.4% for AGIs $10k-25k, 9.0% for AGIs $25k-50k, 15.0% for AGIs $50k-75k, 17.2% for AGIs $75k-100k, 18.2% for AGIs over 100k)
Charity contributions deductions: $1,826 (3% of AGI, reported on 19.1% of returns)
Here:
$1,826
State:
$4,031
Here:
2.5% of AGI
State:
3.9% of AGI
(% of AGI for various income ranges: 0.3% for AGIs $10k-25k, 0.9% for AGIs $25k-50k, 1.3% for AGIs $50k-75k, 1.5% for AGIs $75k-100k, 1.3% for AGIs over 100k)
Total tax: $4,005 (reported on 69.4% of returns)
21649:
$4,005
State:
$10,167
(% of AGI for various income ranges: 2.7% for AGIs below $10k, 3.5% for AGIs $10k-25k, 5.9% for AGIs $25k-50k, 7.9% for AGIs $50k-75k, 9.4% for AGIs $75k-100k, 14.2% for AGIs over 100k)
Earned income credit: $1,898 (reported on 22.2% of returns)
Here:
$1,898
State:
$1,700
Percentage of individuals using paid preparers for their 2004 taxes: 62.2%
Here:
62%
State:
55%
(% for various income ranges: 51.5% for AGIs below $10k, 60.9% for AGIs $10k-25k, 65.1% for AGIs $25k-50k, 73.8% for AGIs $50k-75k, 53.6% for AGIs $75k-100k, 88.9% for AGIs over 100k)
Household received Food Stamps/SNAP in the past 12 months: 132 Household did not receive Food Stamps/SNAP in the past 12 months: 434
Women who had a birth in the past 12 months: 13 (2 now married, 10 unmarried) Women who did not have a birth in the past 12 months: 389 (115 now married, 274 unmarried)
Housing units in zip code 21649 with a mortgage: 236 (10 second mortgage, 7 both second mortgage and home equity loan) Houses without a mortgage: 34
Median monthly owner costs for units with a mortgage: $1,545 Median monthly owner costs for units without a mortgage: $640
Residents with income below the poverty level in 2022:
This zip code:
15.1%
Whole state:
9.6%
Residents with income below 50% of the poverty level in 2022:
This zip code:
11.1%
Whole state:
4.7%
Median number of rooms in houses and condos:
Here:
6.3
State:
7.3
Median number of rooms in apartments:
Here:
5.3
State:
4.2
Notable locations in this zip code not listed on our city pages
Churches in zip code 21649 include: Calvary United Methodist Church (A), Christ Church (B), Immaculate Conception Catholic Church (C), Mount Zion Church (D), Templeville Community Church (E), Epworth Church (F). Display/hide their locations on the map
Size of family households: 191 2-persons, 75 3-persons, 86 4-persons, 55 5-persons, 30 6-persons, 31 7-or-more-persons
Size of nonfamily households: 52 1-person, 2 4-persons, 40 7-or-more-persons
162 married couples with children.
210 single-parent households (102 men, 108 women).
63.7% of residents of 21649 zip code speak English at home.
36.1% of residents speak Spanish at home (46% very well, 24% well, 19% not well, 11% not at all).
1.8% of residents speak other Indo-European language at home (64% very well, 11% well, 25% not well).
Foreign born population: 662 (30.0%) (30.3% of them are naturalized citizens)
This zip code:
30.0%
Whole state:
16.7%
70%El Salvador
16%Honduras
4%Bhutan
2%Guatemala
2%France
2%Guyana
21%American
9%German
3%English
2%Irish
2%French Canadian
2%Italian
1%European
Year of entry for the foreign-born population
2962010 or later
1482000 to 2009
1901990 to 1999
35Before 1990
Facilities with environmental interests located in this zip code:
CEDAR MOBILE HOME PARK WWTP (18240 LEPORE ROAD in MARYDEL, MD)
STATE MASTER (Maryland Permits tracking) - NPDES NON-MAJOR National Pollutant Discharge Elimination System NON-MAJOR (Tracking pollutant discharge elimination systems) - permit Business SIC classification: OPERATORS OF RESIDENTIAL MOBILE HOME SITES; RECREATIONAL VEHICLE PARKS AND CAMPSITES Alternative names: BUSINESS WORLD,INC., WALKERS TRAILER PARK
Housing units lacking complete plumbing facilities: 8.3% Housing units lacking complete kitchen facilities: 6.6%
42.2%Electricity
21.4%Bottled, tank, or LP gas
17.0%Fuel oil, kerosene, etc.
11.4%Wood
7.4%Other fuel
1.3%Utility gas
Population in 1990: 1,195. Population change in the 1990s: +522 (+43.7%).
Place of birth for U.S.-born residents:
This state: 1,163
Northeast: 70
Midwest: 15
South: 301
West: 14
65% of the 21649 zip code residents lived in the same house 5 years ago. Out of people who lived in different houses, 40% lived in this county. Out of people who lived in different counties, 50% lived in Maryland.
96% of the 21649 zip code residents lived in the same house 1 year ago. Out of people who lived in different houses, 53% moved from this county. Out of people who lived in different houses, 53% moved from different county within same state. Out of people who lived in different houses, 6% moved from different state.
Private vs. public school enrollment:
Students in private schools in grades 1 to 8 (elementary and middle school): 6
Here:
2.4%
Maryland:
15.2%
Students in private schools in grades 9 to 12 (high school):
Here:
0.8%
Maryland:
14.4%
Students in private undergraduate colleges: 4
Here:
11.3%
Maryland:
20.2%
Occupation by median earnings in the past 12 months ($)
88,538Transportation occupations
80,231Management occupations
52,645Installation, maintenance, and repair occupations
43,768Production occupations
36,932Office and administrative support occupations
34,498Material moving occupations
Top industries in this zip code by the number of employees in 2005:
Accommodation and Food Services: Food Service Contractors (10-19 employees: 1 establishment)
Administrative and Support and Waste Management and Remediation Services: Landscaping Services (5-9: 1, 1-4: 1)
Other Services (except Public Administration): Religious Organizations (5-9: 1)
Finance and Insurance: Commercial Banking (5-9: 1)
Other Services (except Public Administration): Pet Care (except Veterinary) Services (1-4: 1)
Construction: Residential Remodelers (1-4: 1)
Construction: Framing Contractors (1-4: 1)
People in group quarters in 2000:
6 people in other noninstitutional group quarters
4 people in other group homes
Fatal accident statistics in 2014:
Fatal accident count: 1
Vehicles involved in fatal accidents: 2
Fatal accidents caused by drunken drivers: 1
Fatalities: 1
Persons involved in fatal accidents: 2
Pedestrians involved in fatal accidents: 0
Fatal accident statistics in 2013:
Fatal accident count: 1
Vehicles involved in fatal accidents: 1
Fatal accidents caused by drunken drivers: 0
Fatalities: 2
Persons involved in fatal accidents: 3
Pedestrians involved in fatal accidents: 0
Home Mortgage Disclosure Act Aggregated Statistics For Year 2009 (Based on 2 partial tracts)
A) FHA, FSA/RHS & VA Home Purchase Loans
B) Conventional Home Purchase Loans
C) Refinancings
D) Home Improvement Loans
F) Non-occupant Loans on < 5 Family Dwellings (A B C & D)
G) Loans On Manufactured Home Dwelling (A B C & D)
Number
Average Value
Number
Average Value
Number
Average Value
Number
Average Value
Number
Average Value
Number
Average Value
LOANS ORIGINATED
2
$195,895
1
$275,890
13
$200,002
1
$80,440
1
$111,020
1
$195,450
APPLICATIONS APPROVED, NOT ACCEPTED
0
$0
0
$0
2
$184,815
0
$0
0
$0
0
$0
APPLICATIONS DENIED
0
$0
1
$155,120
8
$252,375
1
$54,740
1
$52,520
1
$85,320
APPLICATIONS WITHDRAWN
1
$85,980
1
$269,240
4
$247,360
1
$67,810
0
$0
0
$0
FILES CLOSED FOR INCOMPLETENESS
0
$0
0
$0
1
$169,300
0
$0
0
$0
0
$0
Aggregated Statistics For Year 2008 (Based on 2 partial tracts)
B) Conventional Home Purchase Loans
C) Refinancings
D) Home Improvement Loans
F) Non-occupant Loans on < 5 Family Dwellings (A B C & D)
G) Loans On Manufactured Home Dwelling (A B C & D)
Number
Average Value
Number
Average Value
Number
Average Value
Number
Average Value
Number
Average Value
LOANS ORIGINATED
3
$187,327
14
$186,223
4
$83,432
1
$208,080
3
$83,397
APPLICATIONS APPROVED, NOT ACCEPTED
0
$0
1
$56,950
1
$66,260
0
$0
0
$0
APPLICATIONS DENIED
2
$144,595
7
$243,981
1
$56,060
1
$54,510
1
$125,870
APPLICATIONS WITHDRAWN
0
$0
4
$250,908
0
$0
0
$0
0
$0
FILES CLOSED FOR INCOMPLETENESS
0
$0
1
$222,040
0
$0
0
$0
0
$0
Aggregated Statistics For Year 2007 (Based on 2 partial tracts)
A) FHA, FSA/RHS & VA Home Purchase Loans
B) Conventional Home Purchase Loans
C) Refinancings
D) Home Improvement Loans
G) Loans On Manufactured Home Dwelling (A B C & D)
Number
Average Value
Number
Average Value
Number
Average Value
Number
Average Value
Number
Average Value
LOANS ORIGINATED
1
$192,350
4
$212,292
14
$202,701
5
$52,120
1
$198,110
APPLICATIONS APPROVED, NOT ACCEPTED
0
$0
2
$131,965
4
$150,855
1
$63,380
0
$0
APPLICATIONS DENIED
0
$0
3
$181,417
15
$164,575
2
$118,335
3
$141,823
APPLICATIONS WITHDRAWN
0
$0
1
$90,190
7
$175,950
1
$279,880
0
$0
FILES CLOSED FOR INCOMPLETENESS
0
$0
0
$0
1
$235,560
0
$0
0
$0
Aggregated Statistics For Year 2006 (Based on 2 partial tracts)
B) Conventional Home Purchase Loans
C) Refinancings
D) Home Improvement Loans
F) Non-occupant Loans on < 5 Family Dwellings (A B C & D)
G) Loans On Manufactured Home Dwelling (A B C & D)
Number
Average Value
Number
Average Value
Number
Average Value
Number
Average Value
Number
Average Value
LOANS ORIGINATED
9
$179,914
20
$170,211
3
$53,480
2
$113,350
2
$98,500
APPLICATIONS APPROVED, NOT ACCEPTED
2
$105,480
3
$141,750
0
$0
0
$0
0
$0
APPLICATIONS DENIED
2
$246,420
10
$203,119
3
$101,493
0
$0
0
$0
APPLICATIONS WITHDRAWN
0
$0
9
$189,074
1
$107,920
0
$0
0
$0
FILES CLOSED FOR INCOMPLETENESS
0
$0
1
$247,310
0
$0
0
$0
0
$0
Aggregated Statistics For Year 2005 (Based on 2 partial tracts)
A) FHA, FSA/RHS & VA Home Purchase Loans
B) Conventional Home Purchase Loans
C) Refinancings
D) Home Improvement Loans
F) Non-occupant Loans on < 5 Family Dwellings (A B C & D)
G) Loans On Manufactured Home Dwelling (A B C & D)
Number
Average Value
Number
Average Value
Number
Average Value
Number
Average Value
Number
Average Value
Number
Average Value
LOANS ORIGINATED
1
$129,410
9
$146,723
20
$174,178
5
$59,344
1
$58,950
1
$88,420
APPLICATIONS APPROVED, NOT ACCEPTED
0
$0
2
$114,235
4
$130,245
0
$0
0
$0
0
$0
APPLICATIONS DENIED
0
$0
5
$148,250
8
$157,945
2
$53,295
0
$0
2
$62,825
APPLICATIONS WITHDRAWN
1
$103,930
2
$94,845
12
$173,956
0
$0
0
$0
0
$0
FILES CLOSED FOR INCOMPLETENESS
0
$0
0
$0
3
$193,680
0
$0
0
$0
0
$0
Aggregated Statistics For Year 2004 (Based on 2 partial tracts)
A) FHA, FSA/RHS & VA Home Purchase Loans
B) Conventional Home Purchase Loans
C) Refinancings
D) Home Improvement Loans
F) Non-occupant Loans on < 5 Family Dwellings (A B C & D)
G) Loans On Manufactured Home Dwelling (A B C & D)
Number
Average Value
Number
Average Value
Number
Average Value
Number
Average Value
Number
Average Value
Number
Average Value
LOANS ORIGINATED
1
$126,980
6
$166,865
17
$136,349
4
$29,418
1
$41,220
1
$164,210
APPLICATIONS APPROVED, NOT ACCEPTED
0
$0
1
$125,870
5
$176,792
0
$0
0
$0
0
$0
APPLICATIONS DENIED
0
$0
2
$176,835
12
$157,447
2
$28,255
0
$0
1
$95,070
APPLICATIONS WITHDRAWN
0
$0
0
$0
8
$152,461
0
$0
0
$0
0
$0
FILES CLOSED FOR INCOMPLETENESS
0
$0
1
$93,740
1
$187,470
0
$0
0
$0
0
$0
Aggregated Statistics For Year 2003 (Based on 2 partial tracts)
A) FHA, FSA/RHS & VA Home Purchase Loans
B) Conventional Home Purchase Loans
C) Refinancings
D) Home Improvement Loans
F) Non-occupant Loans on < 5 Family Dwellings (A B C & D)
Detailed PMIC statistics for the following Tracts:8102.00
2002 - 2018 National Fire Incident Reporting System (NFIRS) incidents
According to the data from the years 2002 - 2018 the average number of fires per year is 6. The highest number of reported fire incidents - 15 took place in 2011, and the least - 2 in 2007. The data has an increasing trend.
When looking into fire subcategories, the most incidents belonged to: Structure Fires (50.0%), and Outside Fires (34.0%).
Fire incident types reported to NFIRS in Zip Code 21649


 Nearest zip codes: 19964, 19953, 21640, 21607, 21668, 21644.


 According to the data from the years 2002 - 2018 the average number of fires per year is 6. The highest number of reported fire incidents - 15 took place in 2011, and the least - 2 in 2007. The data has an increasing trend.
 When looking into fire subcategories, the most incidents belonged to: Structure Fires (50.0%), and Outside Fires (34.0%).