Estimated zip code population in 2022: 2,687 Zip code population in 2010: 1,930 Zip code population in 2000: 1,901
Houses and condos: 1,039 Renter-occupied apartments: 316
% of renters here:
30%
State:
32%
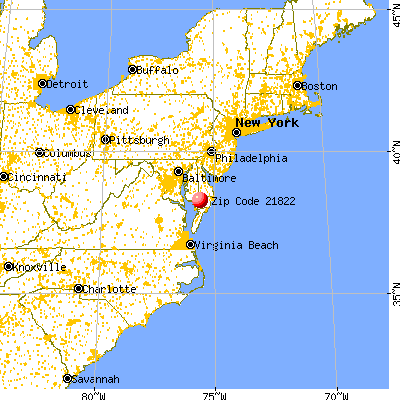
March 2022 cost of living index in zip code 21822: 92.1 (less than average, U.S. average is 100)
Land area: 28.2 sq. mi. Water area: 0.9 sq. mi.
Population density: 95 people per square mile
(very low).
OSM Map
General Map
Google Map
MSN Map
OSM Map
General Map
Google Map
MSN Map
OSM Map
General Map
Google Map
MSN Map
OSM Map
General Map
Google Map
MSN Map
Please wait while loading the map...
Real estate property taxes paid for housing units in 2022:
This zip code:
1.2% ($2,176)
Maryland:
0.9% ($3,777)
Median real estate property taxes paid for housing units with mortgages in 2022: $2,235 (1.3%) Median real estate property taxes paid for housing units with no mortgage in 2022: $2,056 (14.6%)
Business Search- 14 Million verified businesses
Males: 1,244
(46.3%)
Females: 1,442
(53.7%)
For population 25 years and over in 21822:
High school or higher: 82.7%
Bachelor's degree or higher: 24.4%
Graduate or professional degree: 7.2%
Unemployed: 6.5%
Mean travel time to work (commute): 23.1 minutes
For population 15 years and over in 21822:
Never married: 30.7%
Now married: 44.1%
Separated: 0.9%
Widowed: 4.8%
Divorced: 19.4%
Zip code 21822 compared to state average:
Median household income significantly below state average.
Median house value below state average.
Hispanic race population percentage significantly below state average.
Foreign-born population percentage significantly below state average.
Length of stay since moving in significantly above state average.
Number of college students below state average.
Percentage of population with a bachelor's degree or higher below state average.
Averages for the 2020 tax year for zip code 21822, filed in 2021:
Average Adjusted Gross Income (AGI) in 2020: $64,058 (Individual Income Tax Returns)
Here:
$64,058
State:
$86,905
Salary/wage: $54,237 (reported on 80.9% of returns)
Here:
$54,237
State:
$73,953
(% of AGI for various income ranges: 1180.9% for AGIs below $25k, 3659.6% for AGIs $25k-50k, 6670.9% for AGIs $50k-75k, 9330.0% for AGIs $75k-100k, 14402.5% for AGIs $100k-200k)
Taxable interest for individuals: $1,225 (reported on 30.5% of returns)
This zip code:
$1,225
Maryland:
$1,528
(% of AGI for various income ranges: 4.8% for AGIs below $25k, 46.8% for AGIs $25k-50k, 53.6% for AGIs $50k-75k, 76.7% for AGIs $75k-100k, 87.5% for AGIs $100k-200k)
Ordinary dividends: $3,461 (reported on 13.7% of returns)
Here:
$3,461
State:
$8,028
(% of AGI for various income ranges: 20.8% for AGIs $25k-50k, 37.3% for AGIs $50k-75k, 100.0% for AGIs $75k-100k, 130.0% for AGIs $100k-200k)
Net capital gain/loss in AGI: +$10,253 (reported on 13.0% of returns)
Here:
+$10,253
State:
+$25,238
(% of AGI for various income ranges: 21.6% for AGIs $25k-50k, 22.7% for AGIs $50k-75k, 134.2% for AGIs $100k-200k)
Profit/loss from business: +$6,853 (reported on 14.5% of returns)
Here:
+$6,853
State:
+$11,398
(% of AGI for various income ranges: 147.3% for AGIs below $25k, 142.4% for AGIs $25k-50k, 233.6% for AGIs $50k-75k, 108.9% for AGIs $75k-100k, 87.5% for AGIs $100k-200k)
Taxable individual retirement arrangement distribution: $22,109 (reported on 8.4% of returns)
21822:
$22,109
Maryland:
$20,944
(% of AGI for various income ranges: 35.2% for AGIs below $25k, 150.0% for AGIs $25k-50k, 626.7% for AGIs $75k-100k, 1147.5% for AGIs $100k-200k)
Total itemized deductions: $26,627 (reported on 11.5% of returns)
Here:
$26,627
State:
$30,672
(% of AGI for various income ranges: 278.4% for AGIs $25k-50k, 408.2% for AGIs $50k-75k, 1031.1% for AGIs $75k-100k, 878.3% for AGIs $100k-200k)
Charity contributions: $5,725 (reported on 9.2% of returns)
Here:
$5,725
State:
$9,065
(% of AGI for various income ranges: 74.4% for AGIs $25k-50k, 201.1% for AGIs $75k-100k, 156.7% for AGIs $100k-200k)
Taxes paid: $7,813 (reported on 11.5% of returns)
21822:
$7,813
State:
$8,475
(% of AGI for various income ranges: 44.8% for AGIs $25k-50k, 141.8% for AGIs $50k-75k, 293.3% for AGIs $75k-100k, 316.7% for AGIs $100k-200k)
Earned income credit: $2,300 (reported on 17.6% of returns)
Here:
$2,300
State:
$2,151
(% of AGI for various income ranges: 100.0% for AGIs below $25k, 79.6% for AGIs $25k-50k)
Percentage of individuals using paid preparers for their 2020 taxes: 92.4%
Here:
92%
State:
90%
(% for various income ranges: 91.3% for AGIs below $25k, 91.2% for AGIs $25k-50k, 93.8% for AGIs $50k-75k, 92.3% for AGIs $75k-100k, 94.1% for AGIs $100k-200k, 100.0% for AGIs over 200k)
Averages for the 2012 tax year for zip code 21822, filed in 2013:
Average Adjusted Gross Income (AGI) in 2012: $53,944 (Individual Income Tax Returns)
Here:
$53,944
State:
$72,703
Salary/wage: $46,393 (reported on 84.8% of returns)
Here:
$46,393
State:
$62,228
(% of AGI for various income ranges: 71.0% for AGIs below $25k, 81.1% for AGIs $25k-50k, 76.8% for AGIs $50k-75k, 79.8% for AGIs $75k-100k, 77.3% for AGIs $100k-200k, 54.6% for AGIs over 200k)
Taxable interest for individuals: $1,063 (reported on 32.8% of returns)
This zip code:
$1,063
Maryland:
$1,413
(% of AGI for various income ranges: 0.5% for AGIs below $25k, 0.4% for AGIs $25k-50k, 0.7% for AGIs $50k-75k, 0.7% for AGIs $75k-100k, 0.6% for AGIs $100k-200k, 0.8% for AGIs over 200k)
Ordinary dividends: $3,439 (reported on 14.4% of returns)
Here:
$3,439
State:
$6,933
(% of AGI for various income ranges: 1.2% for AGIs below $25k, 1.3% for AGIs $50k-75k, 0.7% for AGIs $75k-100k, 0.6% for AGIs $100k-200k, 1.7% for AGIs over 200k)
Net capital gain/loss in AGI: +$4,708 (reported on 10.4% of returns)
Here:
+$4,708
State:
+$14,830
(% of AGI for various income ranges: 3.8% for AGIs $100k-200k)
Profit/loss from business: +$7,984 (reported on 15.2% of returns)
Here:
+$7,984
State:
+$12,606
(% of AGI for various income ranges: 8.9% for AGIs below $25k, 1.0% for AGIs $25k-50k, 5.8% for AGIs $50k-75k, 1.5% for AGIs $100k-200k)
Taxable individual retirement arrangement distribution: $11,400 (reported on 8.0% of returns)
21822:
$11,400
Maryland:
$17,065
(% of AGI for various income ranges: 5.3% for AGIs below $25k, 4.3% for AGIs $50k-75k, 2.2% for AGIs $100k-200k)
Total itemized deductions: $23,030 (23% of AGI, reported on 36.8% of returns)
Here:
$23,030
State:
$27,886
Here:
23.1% of AGI
State:
22.8% of AGI
(% of AGI for various income ranges: 12.6% for AGIs below $25k, 11.8% for AGIs $25k-50k, 17.3% for AGIs $50k-75k, 16.3% for AGIs $75k-100k, 20.3% for AGIs $100k-200k, 13.3% for AGIs over 200k)
Charity contributions: $3,183 (reported on 28.8% of returns)
Here:
$3,183
State:
$4,452
(% of AGI for various income ranges: 0.8% for AGIs below $25k, 1.1% for AGIs $25k-50k, 2.3% for AGIs $50k-75k, 1.9% for AGIs $75k-100k, 2.2% for AGIs $100k-200k, 1.3% for AGIs over 200k)
Taxes paid: $9,700 (reported on 36.0% of returns)
21822:
$9,700
State:
$11,690
(% of AGI for various income ranges: 1.5% for AGIs below $25k, 3.2% for AGIs $25k-50k, 5.9% for AGIs $50k-75k, 6.6% for AGIs $75k-100k, 8.4% for AGIs $100k-200k, 9.5% for AGIs over 200k)
Earned income credit: $2,312 (reported on 20.8% of returns)
Here:
$2,312
State:
$2,199
(% of AGI for various income ranges: 7.7% for AGIs below $25k, 1.1% for AGIs $25k-50k)
Percentage of individuals using paid preparers for their 2012 taxes: 52.8%
Here:
53%
State:
52%
(% for various income ranges: 45.8% for AGIs below $25k, 48.5% for AGIs $25k-50k, 55.6% for AGIs $50k-75k, 60.0% for AGIs $75k-100k, 69.2% for AGIs $100k-200k, 100.0% for AGIs over 200k)
Averages for the 2004 tax year for zip code 21822, filed in 2005:
Average Adjusted Gross Income (AGI) in 2004: $60,506 (Individual Income Tax Returns)
Here:
$60,506
State:
$60,339
Salary/wage: $37,792 (reported on 88.3% of returns)
Here:
$37,792
State:
$52,211
(% of AGI for various income ranges: 120.9% for AGIs below $10k, 84.1% for AGIs $10k-25k, 86.1% for AGIs $25k-50k, 83.9% for AGIs $50k-75k, 85.7% for AGIs $75k-100k, 26.8% for AGIs over 100k)
Taxable interest for individuals: $1,386 (reported on 35.1% of returns)
This zip code:
$1,386
Maryland:
$1,701
(% of AGI for various income ranges: 6.4% for AGIs below $10k, 1.1% for AGIs $10k-25k, 0.5% for AGIs $25k-50k, 0.6% for AGIs $50k-75k, 0.5% for AGIs $75k-100k, 0.8% for AGIs over 100k)
Taxable dividends: $3,817 (reported on 15.3% of returns)
Here:
$3,817
State:
$4,235
(% of AGI for various income ranges: 0.5% for AGIs below $10k, 0.2% for AGIs $10k-25k, 0.3% for AGIs $25k-50k, 0.3% for AGIs $50k-75k, 1.0% for AGIs $75k-100k, 1.5% for AGIs over 100k)
Net capital gain/loss: +$20,866 (reported on 12.2% of returns)
Here:
+$20,866
State:
+$15,888
(% of AGI for various income ranges: 4.9% for AGIs below $10k, -0.1% for AGIs $10k-25k, 1.0% for AGIs $25k-50k, 0.5% for AGIs $50k-75k, 1.9% for AGIs $75k-100k, 7.3% for AGIs over 100k)
Profit/loss from business: +$6,500 (reported on 13.6% of returns)
Here:
+$6,500
State:
+$12,221
(% of AGI for various income ranges: 13.8% for AGIs below $10k, 5.4% for AGIs $10k-25k, 3.1% for AGIs $25k-50k, 3.0% for AGIs $50k-75k, -0.3% for AGIs $75k-100k)
Profit/loss from farming: +$4,520 (reported on 2.1% of returns)
Here:
+$4,520
State:
-$4,771
IRA payment deduction: $3,000 (reported on 2.5% of returns)
21822:
$3,000
Maryland:
$2,968
Total itemized deductions: $23,731 (17% of AGI, reported on 33.0% of returns)
Here:
$23,731
State:
$22,960
Here:
17.3% of AGI
State:
23.3% of AGI
(% of AGI for various income ranges: 7.2% for AGIs $10k-25k, 11.4% for AGIs $25k-50k, 16.8% for AGIs $50k-75k, 19.4% for AGIs $75k-100k, 12.5% for AGIs over 100k)
Charity contributions deductions: $3,046 (2% of AGI, reported on 28.8% of returns)
Here:
$3,046
State:
$4,031
Here:
2.1% of AGI
State:
3.9% of AGI
(% of AGI for various income ranges: 0.7% for AGIs $10k-25k, 1.5% for AGIs $25k-50k, 2.2% for AGIs $50k-75k, 2.5% for AGIs $75k-100k, 1.2% for AGIs over 100k)
Total tax: $13,495 (reported on 75.3% of returns)
21822:
$13,495
State:
$10,167
(% of AGI for various income ranges: 3.2% for AGIs below $10k, 4.1% for AGIs $10k-25k, 6.7% for AGIs $25k-50k, 8.6% for AGIs $50k-75k, 9.4% for AGIs $75k-100k, 25.6% for AGIs over 100k)
Earned income credit: $1,759 (reported on 19.5% of returns)
Here:
$1,759
State:
$1,700
Percentage of individuals using paid preparers for their 2004 taxes: 58.9%
Here:
59%
State:
55%
(% for various income ranges: 51.9% for AGIs below $10k, 56.9% for AGIs $10k-25k, 57.0% for AGIs $25k-50k, 64.9% for AGIs $50k-75k, 63.3% for AGIs $75k-100k, 78.8% for AGIs over 100k)
Household received Food Stamps/SNAP in the past 12 months: 467 Household did not receive Food Stamps/SNAP in the past 12 months: 625
Women who had a birth in the past 12 months: 29 (29 now married, 0 unmarried) Women who did not have a birth in the past 12 months: 427 (166 now married, 261 unmarried)
Housing units in zip code 21822 with a mortgage: 275 (36 second mortgage, 27 both second mortgage and home equity loan) Houses without a mortgage: 38
Median monthly owner costs for units with a mortgage: $1,712 Median monthly owner costs for units without a mortgage: $618
Residents with income below the poverty level in 2022:
This zip code:
17.0%
Whole state:
9.6%
Residents with income below 50% of the poverty level in 2022:
This zip code:
13.5%
Whole state:
4.7%
Median number of rooms in houses and condos:
Here:
6.2
State:
7.3
Median number of rooms in apartments:
Here:
5.2
State:
4.2
Notable locations in this zip code not listed on our city pages
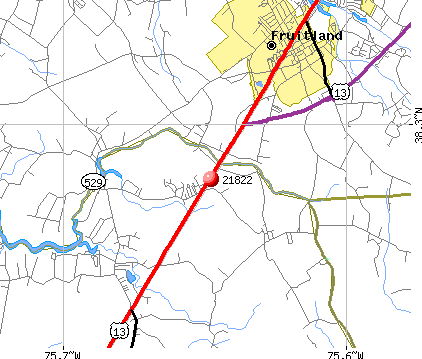
Streams, rivers, and creeks: Barkley Branch (A), Denney Branch (B), Stephens Branch (C), Meadow Bridge Creek (D), Passerdyke Creek (E). Display/hide their locations on the map
In group quarters: 2 (-1 institutionalized population)
Size of family households: 320 2-persons, 194 3-persons, 49 4-persons, 40 5-persons, 57 7-or-more-persons
Size of nonfamily households: 266 1-person, 132 2-persons
637 married couples with children.
241 single-parent households (96 men, 145 women).
99.0% of residents of 21822 zip code speak English at home.
Foreign born population: 17 (0.6%) (100.0% of them are naturalized citizens)
This zip code:
0.6%
Whole state:
16.7%
106%Cabo Verde
20%American
9%Irish
7%English
5%Italian
1%European
1%German
1%Norwegian
Year of entry for the foreign-born population
02010 or later
02000 to 2009
01990 to 1999
31Before 1990
Facilities with environmental interests located in this zip code:
COKER CONCRETE (28101 OLD EDEN RD. in EDEN, MD)
AIR MINOR (AIRS/AFS) STATE MASTER (Maryland Air Emissions Database) - AIR MINOR Business SIC classification: CRUSHED AND BROKEN STONE; WRECKING AND DEMOLITION WORK Alternative names: BRADFORD ENTERPRISES - TEMPORARY PLT
BENHOFF, MELVIN & SONS, INC. (28172 OLD EDEN RD. in EDEN, MD)
AIR MINOR (AIRS/AFS) Business SIC classification: WRECKING AND DEMOLITION WORK
Housing units lacking complete kitchen facilities: 3.1%
45.0%Electricity
33.9%Bottled, tank, or LP gas
20.2%Fuel oil, kerosene, etc.
1.1%Utility gas
Population in 1990: 1,042. Population change in the 1990s: +859 (+82.4%).
Place of birth for U.S.-born residents:
This state: 1,971
Northeast: 225
Midwest: 33
South: 375
West: 23
53% of the 21822 zip code residents lived in the same house 5 years ago. Out of people who lived in different houses, 53% lived in this county. Out of people who lived in different counties, 50% lived in Maryland.
92% of the 21822 zip code residents lived in the same house 1 year ago. Out of people who lived in different houses, 80% moved from this county. Out of people who lived in different houses, 8% moved from different county within same state. Out of people who lived in different houses, 8% moved from different state.
Private vs. public school enrollment:
Students in private schools in grades 1 to 8 (elementary and middle school): 47
Here:
10.4%
Maryland:
15.2%
Students in private schools in grades 9 to 12 (high school):
Here:
0.0%
Maryland:
14.4%
Students in private undergraduate colleges:
Here:
0.0%
Maryland:
20.2%
Occupation by median earnings in the past 12 months ($)
78,377Health diagnosing and treating practitioners and other technical occupations
60,686Management occupations
42,351Transportation occupations
41,336Education, training, and library occupations
37,510Production occupations
27,550Health technologists and technicians
Top industries in this zip code by the number of employees in 2005:
Management of Companies and Enterprises: Corporate, Subsidiary, and Regional Managing Offices (100-249 employees: 1 establishment)
Construction: Painting and Wall Covering Contractors (20-49: 1, 1-4: 1)
Health Care and Social Assistance: Child Day Care Services (20-49: 1)
Accommodation and Food Services: Full-Service Restaurants (10-19: 1)
Construction: Plumbing, Heating, and Air-Conditioning Contractors (5-9: 1, 1-4: 1)
Construction: New Housing Operative Builders (5-9: 1, 1-4: 1)
Other Services (except Public Administration): Commercial and Industrial Machinery and Equipment (except Automotive and Electronic) Repair and Maintenance (5-9: 1)
People in group quarters in 2000:
7 people in nursing homes
Fatal accident statistics in 2012:
Fatal accident count: 1
Vehicles involved in fatal accidents: 2
Fatal accidents caused by drunken drivers: 0
Fatalities: 1
Persons involved in fatal accidents: 4
Pedestrians involved in fatal accidents: 0
Home Mortgage Disclosure Act Aggregated Statistics For Year 2009 (Based on 4 partial tracts)
A) FHA, FSA/RHS & VA Home Purchase Loans
B) Conventional Home Purchase Loans
C) Refinancings
D) Home Improvement Loans
F) Non-occupant Loans on < 5 Family Dwellings (A B C & D)
G) Loans On Manufactured Home Dwelling (A B C & D)
Number
Average Value
Number
Average Value
Number
Average Value
Number
Average Value
Number
Average Value
Number
Average Value
LOANS ORIGINATED
8
$179,666
17
$205,580
65
$202,662
6
$103,052
11
$188,782
1
$64,140
APPLICATIONS APPROVED, NOT ACCEPTED
0
$0
1
$591,250
5
$176,574
0
$0
1
$220,200
0
$0
APPLICATIONS DENIED
2
$181,380
4
$162,698
33
$202,442
4
$97,100
3
$155,930
3
$65,743
APPLICATIONS WITHDRAWN
0
$0
2
$147,440
23
$203,840
1
$50,600
1
$311,870
0
$0
FILES CLOSED FOR INCOMPLETENESS
0
$0
1
$57,130
4
$222,000
0
$0
0
$0
0
$0
Aggregated Statistics For Year 2008 (Based on 4 partial tracts)
A) FHA, FSA/RHS & VA Home Purchase Loans
B) Conventional Home Purchase Loans
C) Refinancings
D) Home Improvement Loans
F) Non-occupant Loans on < 5 Family Dwellings (A B C & D)
G) Loans On Manufactured Home Dwelling (A B C & D)
Number
Average Value
Number
Average Value
Number
Average Value
Number
Average Value
Number
Average Value
Number
Average Value
LOANS ORIGINATED
13
$184,923
28
$205,521
49
$194,468
6
$107,690
10
$161,448
3
$87,833
APPLICATIONS APPROVED, NOT ACCEPTED
0
$0
3
$66,617
7
$175,121
1
$76,380
0
$0
3
$56,023
APPLICATIONS DENIED
2
$159,795
7
$136,173
41
$178,459
9
$42,736
3
$168,353
4
$93,725
APPLICATIONS WITHDRAWN
1
$201,990
3
$178,110
16
$194,089
1
$128,940
2
$120,620
0
$0
FILES CLOSED FOR INCOMPLETENESS
0
$0
1
$113,170
3
$239,547
0
$0
1
$148,890
0
$0
Aggregated Statistics For Year 2007 (Based on 4 partial tracts)
A) FHA, FSA/RHS & VA Home Purchase Loans
B) Conventional Home Purchase Loans
C) Refinancings
D) Home Improvement Loans
F) Non-occupant Loans on < 5 Family Dwellings (A B C & D)
G) Loans On Manufactured Home Dwelling (A B C & D)
Number
Average Value
Number
Average Value
Number
Average Value
Number
Average Value
Number
Average Value
Number
Average Value
LOANS ORIGINATED
7
$175,071
52
$170,507
60
$188,192
13
$89,782
16
$149,168
5
$58,706
APPLICATIONS APPROVED, NOT ACCEPTED
0
$0
8
$133,931
8
$203,301
3
$43,863
2
$277,735
3
$41,120
APPLICATIONS DENIED
0
$0
13
$115,535
51
$174,755
11
$80,228
5
$163,838
7
$65,217
APPLICATIONS WITHDRAWN
0
$0
6
$211,312
28
$190,673
3
$105,537
2
$190,045
0
$0
FILES CLOSED FOR INCOMPLETENESS
0
$0
2
$104,340
7
$224,103
1
$378,590
1
$191,090
0
$0
Aggregated Statistics For Year 2006 (Based on 4 partial tracts)
A) FHA, FSA/RHS & VA Home Purchase Loans
B) Conventional Home Purchase Loans
C) Refinancings
D) Home Improvement Loans
F) Non-occupant Loans on < 5 Family Dwellings (A B C & D)
G) Loans On Manufactured Home Dwelling (A B C & D)
Number
Average Value
Number
Average Value
Number
Average Value
Number
Average Value
Number
Average Value
Number
Average Value
LOANS ORIGINATED
6
$154,173
68
$150,447
79
$154,317
19
$77,218
20
$133,046
6
$52,872
APPLICATIONS APPROVED, NOT ACCEPTED
0
$0
7
$138,193
12
$157,822
1
$98,170
2
$212,440
2
$31,910
APPLICATIONS DENIED
1
$80,330
11
$90,905
50
$157,877
9
$96,064
3
$111,970
6
$63,048
APPLICATIONS WITHDRAWN
1
$87,180
6
$127,903
33
$145,767
2
$100,065
2
$90,455
0
$0
FILES CLOSED FOR INCOMPLETENESS
0
$0
3
$141,513
5
$127,494
0
$0
1
$91,980
0
$0
Aggregated Statistics For Year 2005 (Based on 4 partial tracts)
A) FHA, FSA/RHS & VA Home Purchase Loans
B) Conventional Home Purchase Loans
C) Refinancings
D) Home Improvement Loans
F) Non-occupant Loans on < 5 Family Dwellings (A B C & D)
G) Loans On Manufactured Home Dwelling (A B C & D)
Number
Average Value
Number
Average Value
Number
Average Value
Number
Average Value
Number
Average Value
Number
Average Value
LOANS ORIGINATED
3
$173,050
67
$170,471
84
$156,787
13
$87,372
23
$141,369
5
$72,140
APPLICATIONS APPROVED, NOT ACCEPTED
0
$0
11
$126,828
14
$157,144
4
$53,308
2
$85,585
2
$52,430
APPLICATIONS DENIED
0
$0
18
$98,872
50
$134,202
11
$58,079
4
$115,648
11
$50,791
APPLICATIONS WITHDRAWN
1
$74,990
8
$150,294
44
$154,946
2
$221,855
2
$111,660
0
$0
FILES CLOSED FOR INCOMPLETENESS
0
$0
1
$163,270
5
$208,446
1
$15,880
0
$0
0
$0
Aggregated Statistics For Year 2004 (Based on 4 partial tracts)
A) FHA, FSA/RHS & VA Home Purchase Loans
B) Conventional Home Purchase Loans
C) Refinancings
D) Home Improvement Loans
F) Non-occupant Loans on < 5 Family Dwellings (A B C & D)
G) Loans On Manufactured Home Dwelling (A B C & D)
Detailed PMIC statistics for the following Tracts:0104.00
, 0108.00
2002 - 2018 National Fire Incident Reporting System (NFIRS) incidents
According to the data from the years 2002 - 2018 the average number of fire incidents per year is 14. The highest number of fire incidents - 30 took place in 2004, and the least - 4 in 2012. The data has a dropping trend.
When looking into fire subcategories, the most incidents belonged to: Structure Fires (43.8%), and Outside Fires (43.0%).
Fire incident types reported to NFIRS in Zip Code 21822


+$4,520
-$4,771
 Nearest zip codes: 21826, 21810, 21802, 21801, 21804, 21853.


 According to the data from the years 2002 - 2018 the average number of fire incidents per year is 14. The highest number of fire incidents - 30 took place in 2004, and the least - 4 in 2012. The data has a dropping trend.
 When looking into fire subcategories, the most incidents belonged to: Structure Fires (43.8%), and Outside Fires (43.0%).