Estimated zip code population in 2022: 4,965 Zip code population in 2010: 4,781 Zip code population in 2000: 3,951
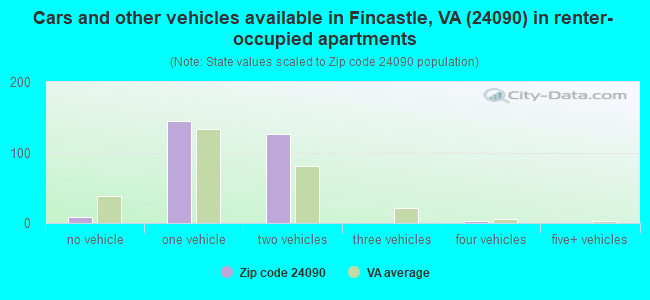
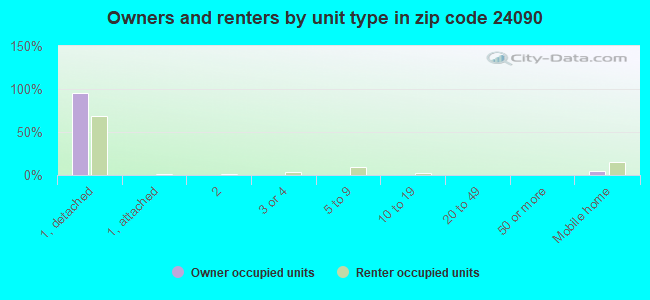
Houses and condos: 2,201 Renter-occupied apartments: 284
% of renters here:
14%
State:
33%
March 2022 cost of living index in zip code 24090: 84.3 (less than average, U.S. average is 100)
Land area: 95.0 sq. mi. Water area: 0.3 sq. mi.
Population density: 52 people per square mile
(very low).
OSM Map
General Map
Google Map
MSN Map
OSM Map
General Map
Google Map
MSN Map
OSM Map
General Map
Google Map
MSN Map
OSM Map
General Map
Google Map
MSN Map
Please wait while loading the map...
Real estate property taxes paid for housing units in 2022:
This zip code:
0.7% ($2,011)
Virginia:
0.7% ($2,617)
Median real estate property taxes paid for housing units with mortgages in 2022: $1,740 (0.6%) Median real estate property taxes paid for housing units with no mortgage in 2022: $2,353 (0.9%)
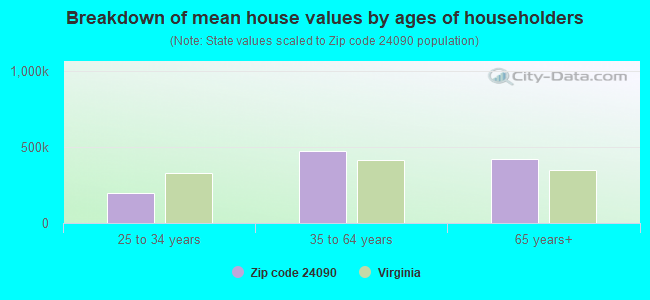
Estimated median house/condo value in 2022: $285,414
24090:
$285,414
Virginia:
$365,700
According to our research of Virginia and other state lists, there were 18 registered sex offenders living in 24090 zip code as of June 16, 2024. The ratio of all residents to sex offenders in zip code 24090 is 294 to 1. The ratio of registered sex offenders to all residents in this zip code is near the state average.
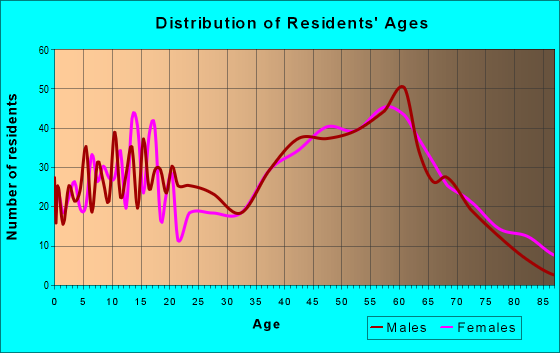
Median resident age:
This zip code:
46.9 years
Virginia median age:
39.0 years
Average household size:
This zip code:
2.4 people
Virginia:
2.5 people
Averages for the 2020 tax year for zip code 24090, filed in 2021:
Average Adjusted Gross Income (AGI) in 2020: $78,395 (Individual Income Tax Returns)
Here:
$78,395
State:
$86,446
Salary/wage: $64,824 (reported on 79.2% of returns)
Here:
$64,824
State:
$71,185
(% of AGI for various income ranges: 1102.9% for AGIs below $25k, 3476.2% for AGIs $25k-50k, 6141.9% for AGIs $50k-75k, 8645.0% for AGIs $75k-100k, 16221.5% for AGIs $100k-200k, 66142.5% for AGIs over 200k)
Taxable interest for individuals: $1,548 (reported on 38.0% of returns)
This zip code:
$1,548
Virginia:
$1,805
(% of AGI for various income ranges: 16.3% for AGIs below $25k, 42.1% for AGIs $25k-50k, 54.8% for AGIs $50k-75k, 80.6% for AGIs $75k-100k, 238.8% for AGIs $100k-200k, 510.0% for AGIs over 200k)
Ordinary dividends: $6,327 (reported on 26.7% of returns)
Here:
$6,327
State:
$8,327
(% of AGI for various income ranges: 32.0% for AGIs below $25k, 57.4% for AGIs $25k-50k, 153.3% for AGIs $50k-75k, 230.0% for AGIs $75k-100k, 379.2% for AGIs $100k-200k, 4255.0% for AGIs over 200k)
Net capital gain/loss in AGI: +$13,714 (reported on 22.6% of returns)
Here:
+$13,714
State:
+$24,644
(% of AGI for various income ranges: 20.0% for AGIs below $25k, 24.4% for AGIs $25k-50k, 192.9% for AGIs $50k-75k, 212.5% for AGIs $75k-100k, 675.4% for AGIs $100k-200k, 10447.5% for AGIs over 200k)
Profit/loss from business: +$8,191 (reported on 14.5% of returns)
Here:
+$8,191
State:
+$12,836
(% of AGI for various income ranges: 37.8% for AGIs below $25k, 135.4% for AGIs $25k-50k, 358.6% for AGIs $50k-75k, 224.4% for AGIs $75k-100k, 215.4% for AGIs $100k-200k, 665.0% for AGIs over 200k)
Taxable individual retirement arrangement distribution: $24,584 (reported on 14.0% of returns)
24090:
$24,584
Virginia:
$21,535
(% of AGI for various income ranges: 61.7% for AGIs below $25k, 136.4% for AGIs $25k-50k, 341.0% for AGIs $50k-75k, 559.4% for AGIs $75k-100k, 897.7% for AGIs $100k-200k, 7227.5% for AGIs over 200k)
Total itemized deductions: $37,441 (reported on 10.0% of returns)
Here:
$37,441
State:
$33,287
(% of AGI for various income ranges: 173.8% for AGIs $25k-50k, 278.1% for AGIs $50k-75k, 479.4% for AGIs $75k-100k, 1103.1% for AGIs $100k-200k, 8350.0% for AGIs over 200k)
Charity contributions: $15,110 (reported on 9.0% of returns)
Here:
$15,110
State:
$10,381
(% of AGI for various income ranges: 15.9% for AGIs below $25k, 102.9% for AGIs $50k-75k, 313.8% for AGIs $100k-200k, 4812.5% for AGIs over 200k)
Taxes paid: $7,927 (reported on 10.0% of returns)
24090:
$7,927
State:
$8,284
(% of AGI for various income ranges: 32.6% for AGIs $25k-50k, 45.2% for AGIs $50k-75k, 86.9% for AGIs $75k-100k, 305.8% for AGIs $100k-200k, 1470.0% for AGIs over 200k)
Earned income credit: $1,765 (reported on 10.4% of returns)
Here:
$1,765
State:
$2,214
(% of AGI for various income ranges: 48.0% for AGIs below $25k, 53.6% for AGIs $25k-50k)
Percentage of individuals using paid preparers for their 2020 taxes: 92.8%
Here:
93%
State:
92%
(% for various income ranges: 93.1% for AGIs below $25k, 92.0% for AGIs $25k-50k, 93.5% for AGIs $50k-75k, 95.7% for AGIs $75k-100k, 91.3% for AGIs $100k-200k, 92.3% for AGIs over 200k)
Averages for the 2012 tax year for zip code 24090, filed in 2013:
Average Adjusted Gross Income (AGI) in 2012: $65,525 (Individual Income Tax Returns)
Here:
$65,525
State:
$71,192
Salary/wage: $54,832 (reported on 82.4% of returns)
Here:
$54,832
State:
$59,229
(% of AGI for various income ranges: 72.1% for AGIs below $25k, 74.4% for AGIs $25k-50k, 69.7% for AGIs $50k-75k, 70.5% for AGIs $75k-100k, 69.5% for AGIs $100k-200k, 62.5% for AGIs over 200k)
Taxable interest for individuals: $1,525 (reported on 43.6% of returns)
This zip code:
$1,525
Virginia:
$1,600
(% of AGI for various income ranges: 1.9% for AGIs below $25k, 1.1% for AGIs $25k-50k, 1.1% for AGIs $50k-75k, 0.4% for AGIs $75k-100k, 1.1% for AGIs $100k-200k, 1.0% for AGIs over 200k)
Ordinary dividends: $4,598 (reported on 28.9% of returns)
Here:
$4,598
State:
$6,959
(% of AGI for various income ranges: 1.6% for AGIs below $25k, 1.7% for AGIs $25k-50k, 1.7% for AGIs $50k-75k, 1.6% for AGIs $75k-100k, 2.5% for AGIs $100k-200k, 2.2% for AGIs over 200k)
Net capital gain/loss in AGI: +$10,417 (reported on 20.1% of returns)
Here:
+$10,417
State:
+$16,672
(% of AGI for various income ranges: 0.6% for AGIs below $25k, 0.1% for AGIs $25k-50k, 0.8% for AGIs $75k-100k, 2.9% for AGIs $100k-200k, 9.9% for AGIs over 200k)
Profit/loss from business: +$11,165 (reported on 15.2% of returns)
Here:
+$11,165
State:
+$14,116
(% of AGI for various income ranges: 5.0% for AGIs below $25k, 2.9% for AGIs $25k-50k, 3.5% for AGIs $50k-75k, 2.0% for AGIs $75k-100k, 3.8% for AGIs $100k-200k)
Taxable individual retirement arrangement distribution: $15,882 (reported on 13.7% of returns)
24090:
$15,882
Virginia:
$16,667
(% of AGI for various income ranges: 4.0% for AGIs below $25k, 3.3% for AGIs $25k-50k, 3.1% for AGIs $50k-75k, 4.0% for AGIs $75k-100k, 5.4% for AGIs $100k-200k)
Total itemized deductions: $23,394 (21% of AGI, reported on 39.7% of returns)
Here:
$23,394
State:
$26,596
Here:
20.8% of AGI
State:
20.1% of AGI
(% of AGI for various income ranges: 10.0% for AGIs below $25k, 10.8% for AGIs $25k-50k, 14.6% for AGIs $50k-75k, 14.0% for AGIs $75k-100k, 16.6% for AGIs $100k-200k, 13.8% for AGIs over 200k)
Charity contributions: $4,851 (reported on 31.9% of returns)
Here:
$4,851
State:
$4,443
(% of AGI for various income ranges: 1.0% for AGIs below $25k, 1.4% for AGIs $25k-50k, 1.7% for AGIs $50k-75k, 2.5% for AGIs $75k-100k, 2.9% for AGIs $100k-200k, 2.9% for AGIs over 200k)
Taxes paid: $7,607 (reported on 39.7% of returns)
24090:
$7,607
State:
$9,951
(% of AGI for various income ranges: 1.6% for AGIs below $25k, 2.2% for AGIs $25k-50k, 3.7% for AGIs $50k-75k, 4.2% for AGIs $75k-100k, 6.0% for AGIs $100k-200k, 5.8% for AGIs over 200k)
Earned income credit: $1,888 (reported on 11.8% of returns)
Here:
$1,888
State:
$2,211
(% of AGI for various income ranges: 4.0% for AGIs below $25k, 0.9% for AGIs $25k-50k)
Percentage of individuals using paid preparers for their 2012 taxes: 53.4%
Here:
53%
State:
46%
(% for various income ranges: 49.2% for AGIs below $25k, 51.1% for AGIs $25k-50k, 55.2% for AGIs $50k-75k, 56.0% for AGIs $75k-100k, 56.7% for AGIs $100k-200k, 75.0% for AGIs over 200k)
Averages for the 2004 tax year for zip code 24090, filed in 2005:
Average Adjusted Gross Income (AGI) in 2004: $54,621 (Individual Income Tax Returns)
Here:
$54,621
State:
$56,704
Salary/wage: $45,226 (reported on 85.3% of returns)
Here:
$45,226
State:
$48,441
(% of AGI for various income ranges: 129.2% for AGIs below $10k, 72.5% for AGIs $10k-25k, 78.5% for AGIs $25k-50k, 77.9% for AGIs $50k-75k, 76.7% for AGIs $75k-100k, 60.0% for AGIs over 100k)
Taxable interest for individuals: $1,286 (reported on 53.4% of returns)
This zip code:
$1,286
Virginia:
$1,688
(% of AGI for various income ranges: 12.5% for AGIs below $10k, 2.4% for AGIs $10k-25k, 1.4% for AGIs $25k-50k, 1.2% for AGIs $50k-75k, 1.0% for AGIs $75k-100k, 0.9% for AGIs over 100k)
Taxable dividends: $3,126 (reported on 31.9% of returns)
Here:
$3,126
State:
$4,028
(% of AGI for various income ranges: 8.8% for AGIs below $10k, 1.2% for AGIs $10k-25k, 1.2% for AGIs $25k-50k, 1.2% for AGIs $50k-75k, 1.7% for AGIs $75k-100k, 2.4% for AGIs over 100k)
Net capital gain/loss: +$9,445 (reported on 23.6% of returns)
Here:
+$9,445
State:
+$14,375
(% of AGI for various income ranges: -2.0% for AGIs below $10k, 1.5% for AGIs $10k-25k, 0.9% for AGIs $25k-50k, -0.1% for AGIs $50k-75k, 1.2% for AGIs $75k-100k, 9.0% for AGIs over 100k)
Profit/loss from business: +$11,260 (reported on 16.4% of returns)
Here:
+$11,260
State:
+$13,342
(% of AGI for various income ranges: 4.6% for AGIs below $10k, 4.8% for AGIs $10k-25k, 1.7% for AGIs $25k-50k, 4.2% for AGIs $50k-75k, 2.7% for AGIs $75k-100k, 3.6% for AGIs over 100k)
IRA payment deduction: $3,344 (reported on 3.4% of returns)
24090:
$3,344
Virginia:
$2,943
(% of AGI for various income ranges: 0.4% for AGIs $10k-25k, 0.2% for AGIs $25k-50k, 0.3% for AGIs $50k-75k, 0.2% for AGIs $75k-100k, 0.1% for AGIs over 100k)
Total itemized deductions: $19,122 (20% of AGI, reported on 39.4% of returns)
Here:
$19,122
State:
$21,492
Here:
20.4% of AGI
State:
21.0% of AGI
(% of AGI for various income ranges: 19.4% for AGIs below $10k, 9.3% for AGIs $10k-25k, 12.8% for AGIs $25k-50k, 14.4% for AGIs $50k-75k, 16.0% for AGIs $75k-100k, 13.6% for AGIs over 100k)
Charity contributions deductions: $3,994 (4% of AGI, reported on 34.2% of returns)
Here:
$3,994
State:
$3,794
Here:
4.0% of AGI
State:
3.5% of AGI
(% of AGI for various income ranges: 1.4% for AGIs $10k-25k, 1.4% for AGIs $25k-50k, 1.6% for AGIs $50k-75k, 2.8% for AGIs $75k-100k, 3.5% for AGIs over 100k)
Total tax: $8,231 (reported on 81.7% of returns)
24090:
$8,231
State:
$9,537
(% of AGI for various income ranges: 3.2% for AGIs below $10k, 4.7% for AGIs $10k-25k, 6.6% for AGIs $25k-50k, 8.7% for AGIs $50k-75k, 10.0% for AGIs $75k-100k, 18.7% for AGIs over 100k)
Earned income credit: $1,514 (reported on 9.5% of returns)
Here:
$1,514
State:
$1,734
Percentage of individuals using paid preparers for their 2004 taxes: 55.5%
Here:
55%
State:
52%
(% for various income ranges: 44.2% for AGIs below $10k, 56.3% for AGIs $10k-25k, 54.1% for AGIs $25k-50k, 54.9% for AGIs $50k-75k, 56.5% for AGIs $75k-100k, 71.4% for AGIs over 100k)
Household received Food Stamps/SNAP in the past 12 months: 51 Household did not receive Food Stamps/SNAP in the past 12 months: 1,907
Women who had a birth in the past 12 months: 40 (26 now married, 13 unmarried) Women who did not have a birth in the past 12 months: 936 (455 now married, 478 unmarried)
Housing units in zip code 24090 with a mortgage: 943 (72 second mortgage, 27 both second mortgage and home equity loan) Houses without a mortgage: 20
Median monthly owner costs for units with a mortgage: $1,408 Median monthly owner costs for units without a mortgage: $549
Residents with income below the poverty level in 2022:
This zip code:
12.9%
Whole state:
10.6%
Residents with income below 50% of the poverty level in 2022:
This zip code:
7.4%
Whole state:
5.2%
Median number of rooms in houses and condos:
Here:
6.3
State:
7.0
Median number of rooms in apartments:
Here:
4.6
State:
4.3
Notable locations in this zip code not listed on our city pages
Notable locations in zip code 24090: Quarry Overlook (A), Wilson Creek Shelter (B), Camp Montgomery (C), Fincastle Volunteer Fire Department and Rescue Squad (D), Botetourt County Sheriffs Office (E). Display/hide their locations on the map
Churches in zip code 24090 include: North Fork Church (A), Ebenezer Church (B), Faith Church (C), Lapsley Run Church (D), Mount Moriah Church (E), Mount Pleasant Church (F), New Bethel Church (G), Pierce Chapel (H), Pleasant Dale Church (I). Display/hide their locations on the map
Streams, rivers, and creeks: Wilson Creek (A), Town Branch (B), Sukey Johnson Branch (C), Stone Coal Creek (D), Rocky Branch (E), Rabbit Creek (F), North Fork Catawba Creek (G), Curry Creek (H), Crush Run (I). Display/hide their locations on the map
In group quarters: 210 (-1 institutionalized population)
Size of family households: 802 2-persons, 296 3-persons, 164 4-persons, 73 5-persons, 20 6-persons, 3 7-or-more-persons
Size of nonfamily households: 552 1-person, 58 2-persons, 10 3-persons
584 married couples with children.
207 single-parent households (90 men, 117 women).
98.0% of residents of 24090 zip code speak English at home.
0.7% of residents speak Spanish at home (91% very well, 9% not well).
0.8% of residents speak other Indo-European language at home (51% very well, 27% well, 22% not well).
0.1% of residents speak Asian or Pacific Island language at home (100% very well).
0.3% of residents speak other language at home (100% very well).
Foreign born population: 48 (1.0%) (54.8% of them are naturalized citizens)
This zip code:
1.0%
Whole state:
12.7%
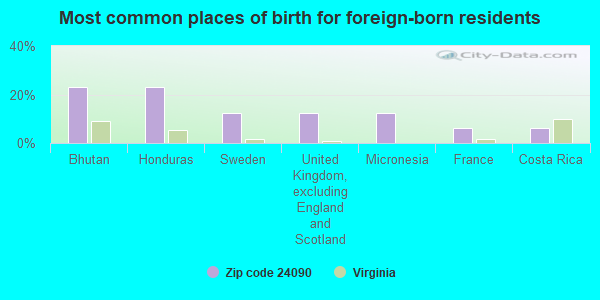
23%Bhutan
23%Honduras
12%Sweden
12%United Kingdom, excluding England and Scotland
12%Micronesia
6%France
6%Costa Rica
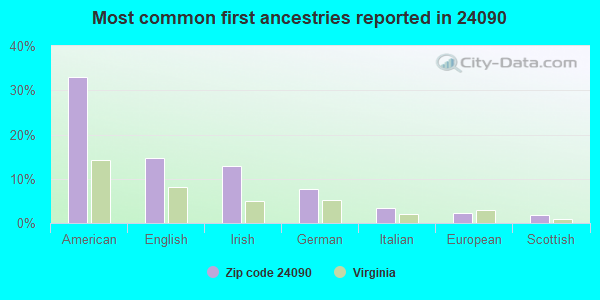
33%American
15%English
13%Irish
8%German
3%Italian
2%European
2%Scottish
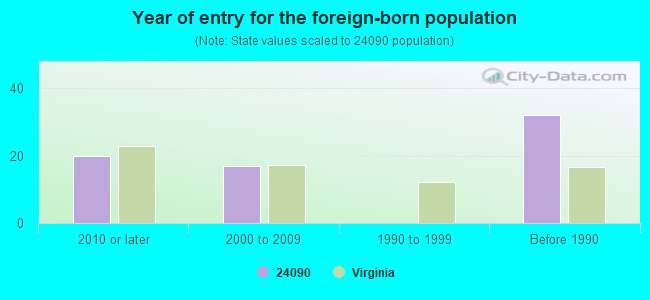
Year of entry for the foreign-born population
202010 or later
172000 to 2009
01990 to 1999
32Before 1990
Facilities with environmental interests located in this zip code:
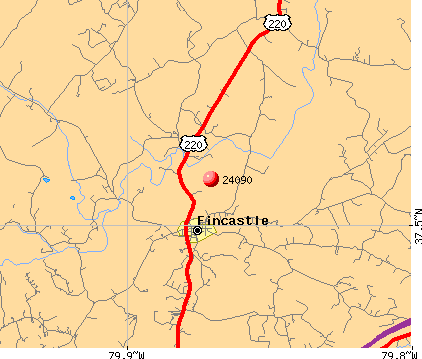
BOTETOURT CO VOCATIONAL SCHOOL (FINCASTLE BOTETOURT COUNTY in FINCASTLE, VA)
AIR MINOR (AIRS/AFS) STATE MASTER (Virginia pollutants databases) - CEDS-20151, AIR PROGRAM Business SIC and NAICS classification: ELEMENTARY AND SECONDARY SCHOOLS Alternative names: BOTETOURT COUNTY VOCATIONAL SCHOOL
BRECKINGRIDGE ELEMENTARY SCHOOL (331 SPRINGWOOD RD in FINCASTLE, VA)
AIR MINOR (AIRS/AFS) (National Center for Education Statistics) - STATE ID-0120220 Business SIC classification: ELEMENTARY AND SECONDARY SCHOOLS Organizations: BOTETOURT COUNTY PUBLIC SCHOOLS (SCHOOL DISTRICT)
Alternative names: BRECKINRIDGE ELEM.
(National Center for Education Statistics) - STATE ID-0120010 Organizations: BOTETOURT COUNTY PUBLIC SCHOOLS (SCHOOL DISTRICT)
CENTRAL ACADEMY MIDDLE (367 POOR FARM RD in FINCASTLE, VA)
(National Center for Education Statistics) - STATE ID-0120420 Organizations: BOTETOURT COUNTY PUBLIC SCHOOLS (SCHOOL DISTRICT)
BOTETOURT CTY PUBLIC SCHOOLS (ROUTE 2 in FINCASTLE, VA)
(Integrated Compliance Information System) - ICIS-03-1986-0400, FORMAL ENFORCEMENT ACTION Business SIC classification: ELEMENTARY AND SECONDARY SCHOOLS
CARRIES REELS PLASTICS GROUP (64 WEST WIND RD in FINCASTLE, VA)
Conditionally Exempt Small Quantity Generators, less than 100 kg/month of hazardous waste (Resource Conservation and Recovery Act (tracking hazardous waste))
Housing units lacking complete plumbing facilities: 3.0% Housing units lacking complete kitchen facilities: 3.1%
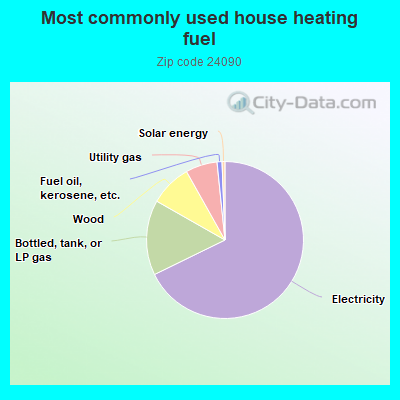
67.5%Electricity
15.4%Bottled, tank, or LP gas
8.6%Wood
6.5%Utility gas
1.0%Fuel oil, kerosene, etc.
0.6%Solar energy
Population in 1990: 2,843. Population change in the 1990s: +1,108 (+39.0%).
Place of birth for U.S.-born residents:
This state: 3,173
Northeast: 257
Midwest: 220
South: 802
West: 436
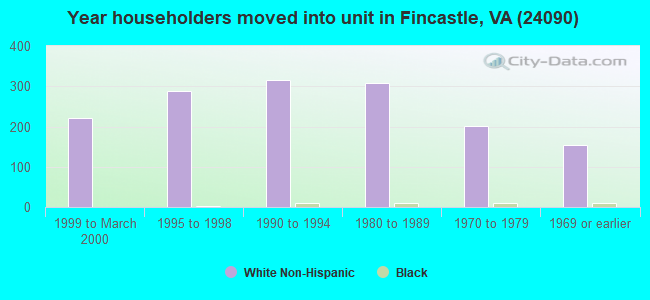
61% of the 24090 zip code residents lived in the same house 5 years ago. Out of people who lived in different houses, 40% lived in this county. Out of people who lived in different counties, 50% lived in Virginia.
91% of the 24090 zip code residents lived in the same house 1 year ago. Out of people who lived in different houses, 36% moved from this county. Out of people who lived in different houses, 29% moved from different county within same state. Out of people who lived in different houses, 36% moved from different state.
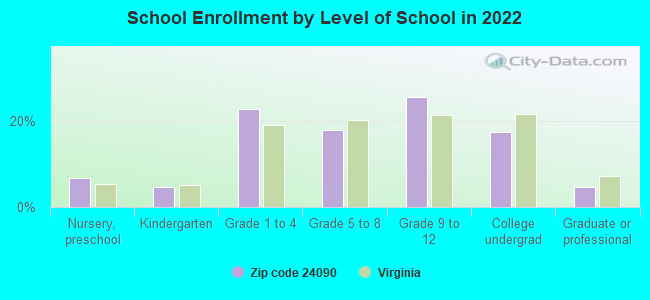
Private vs. public school enrollment:
Students in private schools in grades 1 to 8 (elementary and middle school): 24
Here:
7.9%
Virginia:
13.2%
Students in private schools in grades 9 to 12 (high school): 6
Here:
3.0%
Virginia:
10.2%
Students in private undergraduate colleges: 6
Here:
4.9%
Virginia:
18.7%
Occupation by median earnings in the past 12 months ($)
95,651Computer and mathematical occupations
69,944Health diagnosing and treating practitioners and other technical occupations
64,661Installation, maintenance, and repair occupations
63,869Transportation occupations
63,162Architecture and engineering occupations
60,468Life, physical, and social science occupations
Top industries in this zip code by the number of employees in 2005:
Health Care and Social Assistance: Nursing Care Facilities (50-99 employees: 2 establishments)
Other Services (except Public Administration): Religious Organizations (20-49: 1, 5-9: 1, 1-4: 4)
Finance and Insurance: Commercial Banking (20-49: 1)
Construction: New Single-Family Housing Construction (except Operative Builders) (5-9: 3, 1-4: 4)
Professional, Scientific, and Technical Services: Offices of Lawyers (10-19: 1, 5-9: 1, 1-4: 2)
Health Care and Social Assistance: Offices of Physicians (except Mental Health Specialists) (10-19: 1, 5-9: 1)
Administrative and Support and Waste Management and Remediation Services: Landscaping Services (5-9: 2, 1-4: 4)
Construction: Water and Sewer Line and Related Structures Construction (10-19: 1, 1-4: 1)
People in group quarters in 2010:
98 people in local jails and other municipal confinement facilities
46 people in nursing facilities/skilled-nursing facilities
12 people in workers' group living quarters and job corps centers
People in group quarters in 2000:
74 people in other noninstitutional group quarters
51 people in local jails and other confinement facilities (including police lockups)
Fatal accident statistics in 2014:
Fatal accident count: 1
Vehicles involved in fatal accidents: 1
Fatal accidents caused by drunken drivers: 0
Fatalities: 1
Persons involved in fatal accidents: 2
Pedestrians involved in fatal accidents: 0
Fatal accident statistics in 2013:
Fatal accident count: 1
Vehicles involved in fatal accidents: 1
Fatal accidents caused by drunken drivers: 0
Fatalities: 1
Persons involved in fatal accidents: 1
Pedestrians involved in fatal accidents: 0
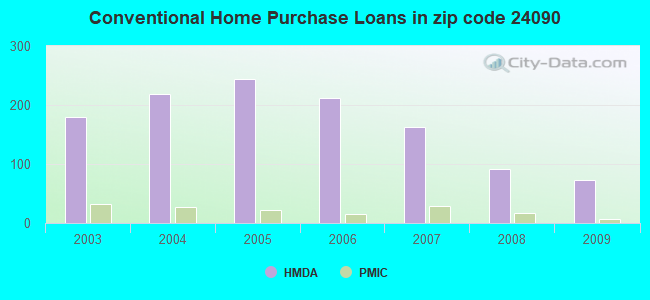
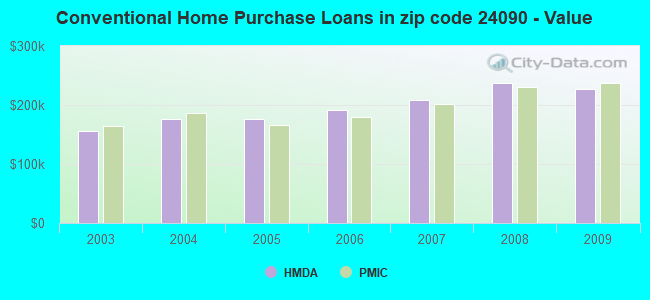
Home Mortgage Disclosure Act Aggregated Statistics For Year 2009 (Based on 6 partial tracts)
A) FHA, FSA/RHS & VA Home Purchase Loans
B) Conventional Home Purchase Loans
C) Refinancings
D) Home Improvement Loans
E) Loans on Dwellings For 5+ Families
F) Non-occupant Loans on < 5 Family Dwellings (A B C & D)
G) Loans On Manufactured Home Dwelling (A B C & D)
Number
Average Value
Number
Average Value
Number
Average Value
Number
Average Value
Number
Average Value
Number
Average Value
Number
Average Value
LOANS ORIGINATED
41
$176,728
73
$227,826
430
$208,720
28
$54,401
2
$557,425
21
$202,694
11
$87,214
APPLICATIONS APPROVED, NOT ACCEPTED
0
$0
4
$167,720
17
$250,795
2
$98,725
0
$0
0
$0
0
$0
APPLICATIONS DENIED
3
$193,970
8
$260,021
79
$208,703
9
$50,392
0
$0
5
$151,528
6
$83,703
APPLICATIONS WITHDRAWN
5
$116,890
9
$190,972
55
$207,469
4
$92,732
0
$0
3
$238,943
1
$126,930
FILES CLOSED FOR INCOMPLETENESS
1
$99,140
1
$358,560
19
$204,819
2
$118,245
0
$0
1
$132,710
0
$0
Aggregated Statistics For Year 2008 (Based on 6 partial tracts)
A) FHA, FSA/RHS & VA Home Purchase Loans
B) Conventional Home Purchase Loans
C) Refinancings
D) Home Improvement Loans
F) Non-occupant Loans on < 5 Family Dwellings (A B C & D)
G) Loans On Manufactured Home Dwelling (A B C & D)
Number
Average Value
Number
Average Value
Number
Average Value
Number
Average Value
Number
Average Value
Number
Average Value
LOANS ORIGINATED
24
$155,912
92
$237,393
202
$196,498
54
$48,644
20
$132,387
10
$59,122
APPLICATIONS APPROVED, NOT ACCEPTED
1
$219,180
8
$260,041
24
$180,087
4
$145,845
1
$320,120
0
$0
APPLICATIONS DENIED
9
$144,598
10
$173,719
91
$211,859
14
$41,484
3
$196,510
10
$80,072
APPLICATIONS WITHDRAWN
3
$155,883
6
$219,780
41
$191,958
5
$55,486
2
$90,230
4
$73,215
FILES CLOSED FOR INCOMPLETENESS
1
$206,000
2
$214,240
10
$207,555
1
$16,480
1
$181,280
0
$0
Aggregated Statistics For Year 2007 (Based on 6 partial tracts)
A) FHA, FSA/RHS & VA Home Purchase Loans
B) Conventional Home Purchase Loans
C) Refinancings
D) Home Improvement Loans
E) Loans on Dwellings For 5+ Families
F) Non-occupant Loans on < 5 Family Dwellings (A B C & D)
G) Loans On Manufactured Home Dwelling (A B C & D)
Number
Average Value
Number
Average Value
Number
Average Value
Number
Average Value
Number
Average Value
Number
Average Value
Number
Average Value
LOANS ORIGINATED
12
$185,398
162
$208,339
211
$167,010
65
$53,048
1
$103,000
27
$152,136
14
$81,101
APPLICATIONS APPROVED, NOT ACCEPTED
1
$114,540
18
$205,575
28
$122,791
5
$56,340
0
$0
1
$55,900
1
$68,140
APPLICATIONS DENIED
2
$62,625
24
$239,525
121
$148,283
27
$57,617
0
$0
4
$113,255
13
$92,195
APPLICATIONS WITHDRAWN
1
$66,370
14
$171,068
66
$161,603
9
$93,758
0
$0
2
$103,680
2
$98,465
FILES CLOSED FOR INCOMPLETENESS
0
$0
1
$193,120
14
$204,381
1
$50,240
0
$0
0
$0
0
$0
Aggregated Statistics For Year 2006 (Based on 6 partial tracts)
A) FHA, FSA/RHS & VA Home Purchase Loans
B) Conventional Home Purchase Loans
C) Refinancings
D) Home Improvement Loans
F) Non-occupant Loans on < 5 Family Dwellings (A B C & D)
G) Loans On Manufactured Home Dwelling (A B C & D)
Number
Average Value
Number
Average Value
Number
Average Value
Number
Average Value
Number
Average Value
Number
Average Value
LOANS ORIGINATED
12
$182,035
212
$190,751
222
$156,094
72
$45,630
39
$127,916
18
$74,729
APPLICATIONS APPROVED, NOT ACCEPTED
1
$234,860
25
$169,489
29
$121,689
9
$38,772
3
$82,767
5
$94,614
APPLICATIONS DENIED
1
$60,830
32
$170,164
115
$150,154
21
$75,279
5
$192,616
12
$83,853
APPLICATIONS WITHDRAWN
2
$115,770
18
$154,782
88
$143,353
7
$57,780
1
$97,760
4
$95,270
FILES CLOSED FOR INCOMPLETENESS
0
$0
9
$177,841
16
$148,132
2
$93,650
0
$0
0
$0
Aggregated Statistics For Year 2005 (Based on 6 partial tracts)
A) FHA, FSA/RHS & VA Home Purchase Loans
B) Conventional Home Purchase Loans
C) Refinancings
D) Home Improvement Loans
F) Non-occupant Loans on < 5 Family Dwellings (A B C & D)
G) Loans On Manufactured Home Dwelling (A B C & D)
Number
Average Value
Number
Average Value
Number
Average Value
Number
Average Value
Number
Average Value
Number
Average Value
LOANS ORIGINATED
10
$158,339
244
$176,959
226
$141,794
51
$22,837
23
$104,779
18
$74,316
APPLICATIONS APPROVED, NOT ACCEPTED
0
$0
26
$152,899
39
$120,304
7
$51,900
3
$39,463
7
$53,213
APPLICATIONS DENIED
3
$109,320
25
$135,555
117
$132,350
30
$31,539
5
$113,102
28
$71,687
APPLICATIONS WITHDRAWN
2
$231,695
18
$220,396
63
$127,418
5
$100,628
2
$152,390
4
$62,132
FILES CLOSED FOR INCOMPLETENESS
0
$0
10
$198,246
12
$144,813
3
$43,577
0
$0
0
$0
Aggregated Statistics For Year 2004 (Based on 6 partial tracts)
A) FHA, FSA/RHS & VA Home Purchase Loans
B) Conventional Home Purchase Loans
C) Refinancings
D) Home Improvement Loans
E) Loans on Dwellings For 5+ Families
F) Non-occupant Loans on < 5 Family Dwellings (A B C & D)
G) Loans On Manufactured Home Dwelling (A B C & D)
Number
Average Value
Number
Average Value
Number
Average Value
Number
Average Value
Number
Average Value
Number
Average Value
Number
Average Value
LOANS ORIGINATED
19
$123,587
218
$175,742
276
$134,632
42
$29,216
2
$1,553,910
21
$114,110
15
$73,233
APPLICATIONS APPROVED, NOT ACCEPTED
3
$138,477
19
$171,289
41
$111,968
4
$45,355
0
$0
2
$45,100
3
$52,390
APPLICATIONS DENIED
2
$80,620
34
$133,310
108
$128,053
21
$21,935
0
$0
3
$79,913
19
$78,952
APPLICATIONS WITHDRAWN
1
$63,720
17
$176,178
88
$118,346
7
$40,699
0
$0
0
$0
4
$100,452
FILES CLOSED FOR INCOMPLETENESS
1
$79,300
3
$254,440
12
$100,429
4
$32,102
0
$0
0
$0
1
$72,510
Aggregated Statistics For Year 2003 (Based on 6 partial tracts)
A) FHA, FSA/RHS & VA Home Purchase Loans
B) Conventional Home Purchase Loans
C) Refinancings
D) Home Improvement Loans
F) Non-occupant Loans on < 5 Family Dwellings (A B C & D)
2002 - 2018 National Fire Incident Reporting System (NFIRS) incidents
Based on the data from the years 2002 - 2018 the average number of fire incidents per year is 29. The highest number of reported fire incidents - 59 took place in 2010, and the least - 4 in 2002. The data has a rising trend.
When looking into fire subcategories, the most incidents belonged to: Structure Fires (49.3%), and Outside Fires (33.4%).
Fire incident types reported to NFIRS in Zip Code 24090
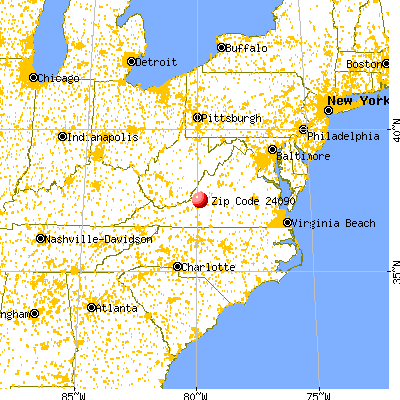


 Nearest zip codes: 24175, 24083, 24130, 24077, 24085, 24020.


 Based on the data from the years 2002 - 2018 the average number of fire incidents per year is 29. The highest number of reported fire incidents - 59 took place in 2010, and the least - 4 in 2002. The data has a rising trend.
 When looking into fire subcategories, the most incidents belonged to: Structure Fires (49.3%), and Outside Fires (33.4%).