Estimated zip code population in 2022: 646 Zip code population in 2010: 575 Zip code population in 2000: 522
Houses and condos: 506 Renter-occupied apartments: 88
% of renters here:
23%
State:
33%
March 2022 cost of living index in zip code 24139: 83.8 (less than average, U.S. average is 100)
Land area: 24.5 sq. mi. Water area: 1.6 sq. mi.
Population density: 26 people per square mile
(very low).
OSM Map
General Map
Google Map
MSN Map
OSM Map
General Map
Google Map
MSN Map
OSM Map
General Map
Google Map
MSN Map
OSM Map
General Map
Google Map
MSN Map
Please wait while loading the map...
Median real estate property taxes paid for housing units with mortgages in 2022: $200 (0.1%) Median real estate property taxes paid for housing units with no mortgage in 2022: $639 (0.8%)
Business Search- 14 Million verified businesses
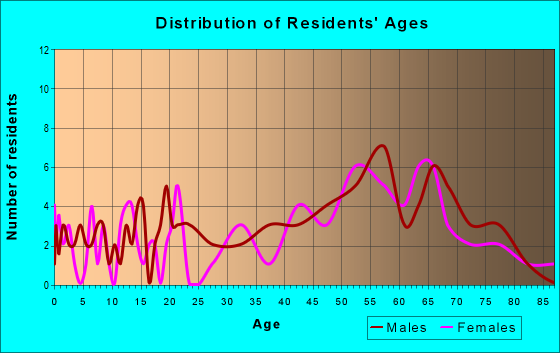
Males: 418
(64.8%)
Females: 227
(35.2%)
For population 25 years and over in 24139:
High school or higher: 77.6%
Bachelor's degree or higher: 18.8%
Graduate or professional degree: 14.2%
Mean travel time to work (commute): 38.1 minutes
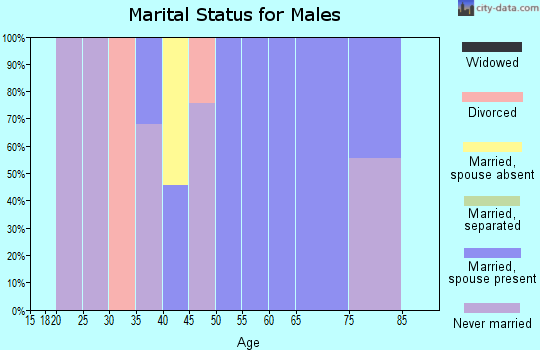
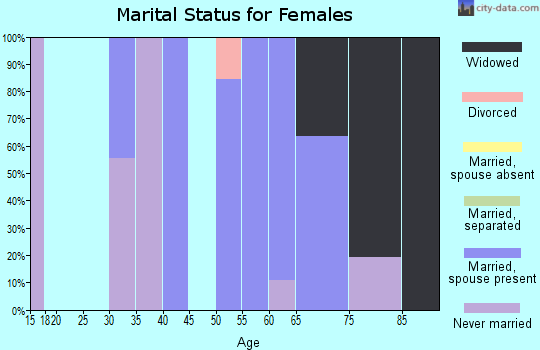
For population 15 years and over in 24139:
Never married: 32.4%
Now married: 59.1%
Separated: 0.9%
Widowed: 0.6%
Divorced: 7.1%
Zip code 24139 compared to state average:
Median household income significantly below state average.
Median house value significantly below state average.
Unemployed percentage significantly below state average.
Hispanic race population percentage significantly below state average.
Median age significantly above state average.
Foreign-born population percentage significantly below state average.
Length of stay since moving in significantly above state average.
Number of rooms per house below state average.
Percentage of population with a bachelor's degree or higher below state average.
Averages for the 2020 tax year for zip code 24139, filed in 2021:
Average Adjusted Gross Income (AGI) in 2020: $52,048 (Individual Income Tax Returns)
Here:
$52,048
State:
$86,446
Salary/wage: $42,871 (reported on 77.8% of returns)
Here:
$42,871
State:
$71,185
(% of AGI for various income ranges: 1114.3% for AGIs below $25k, 3430.0% for AGIs $25k-50k, 5693.3% for AGIs $50k-75k, 5327.5% for AGIs $75k-100k)
Taxable interest for individuals: $329 (reported on 25.9% of returns)
This zip code:
$329
Virginia:
$1,805
(% of AGI for various income ranges: 11.7% for AGIs $25k-50k, 40.0% for AGIs $75k-100k)
Ordinary dividends: $1,375 (reported on 14.8% of returns)
Here:
$1,375
State:
$8,327
(% of AGI for various income ranges: 183.3% for AGIs $50k-75k)
Net capital gain/loss in AGI: +$6,175 (reported on 14.8% of returns)
Here:
+$6,175
State:
+$24,644
(% of AGI for various income ranges: 823.3% for AGIs $50k-75k)
Taxable individual retirement arrangement distribution: $16,367 (reported on 11.1% of returns)
24139:
$16,367
Virginia:
$21,535
(% of AGI for various income ranges: 818.3% for AGIs $25k-50k)
Earned income credit: $2,280 (reported on 18.5% of returns)
Here:
$2,280
State:
$2,214
(% of AGI for various income ranges: 162.9% for AGIs below $25k)
Percentage of individuals using paid preparers for their 2020 taxes: 96.3%
Here:
96%
State:
92%
(% for various income ranges: 90.0% for AGIs below $25k, 100.0% for AGIs $25k-50k, 100.0% for AGIs $50k-75k, 100.0% for AGIs $75k-100k, 100.0% for AGIs $100k-200k)
Averages for the 2012 tax year for zip code 24139, filed in 2013:
Average Adjusted Gross Income (AGI) in 2012: $36,462 (Individual Income Tax Returns)
Here:
$36,462
State:
$71,192
Salary/wage: $32,795 (reported on 79.2% of returns)
Here:
$32,795
State:
$59,229
(% of AGI for various income ranges: 69.7% for AGIs below $25k, 80.4% for AGIs $25k-50k, 67.2% for AGIs $50k-75k, 69.5% for AGIs $75k-100k)
Taxable interest for individuals: $367 (reported on 25.0% of returns)
This zip code:
$367
Virginia:
$1,600
Taxable individual retirement arrangement distribution: $14,233 (reported on 12.5% of returns)
24139:
$14,233
Virginia:
$16,667
Total itemized deductions: $16,475 (24% of AGI, reported on 16.7% of returns)
Here:
$16,475
State:
$26,596
Here:
24.4% of AGI
State:
20.1% of AGI
Charity contributions: $1,567 (reported on 12.5% of returns)
Here:
$1,567
State:
$4,443
Taxes paid: $4,250 (reported on 16.7% of returns)
24139:
$4,250
State:
$9,951
Earned income credit: $2,083 (reported on 25.0% of returns)
Here:
$2,083
State:
$2,211
(% of AGI for various income ranges: 7.9% for AGIs below $25k)
Percentage of individuals using paid preparers for their 2012 taxes: 50.0%
Here:
50%
State:
46%
(% for various income ranges: 50.0% for AGIs below $25k, 60.0% for AGIs $25k-50k, 75.0% for AGIs $50k-75k)
Averages for the 2004 tax year for zip code 24139, filed in 2005:
Average Adjusted Gross Income (AGI) in 2004: $32,111 (Individual Income Tax Returns)
Here:
$32,111
State:
$56,704
Salary/wage: $28,620 (reported on 82.9% of returns)
Here:
$28,620
State:
$48,441
(% of AGI for various income ranges: 77.1% for AGIs below $10k, 75.2% for AGIs $10k-25k, 76.1% for AGIs $25k-50k, 86.0% for AGIs $50k-75k, 54.0% for AGIs $75k-100k)
Taxable interest for individuals: $1,347 (reported on 33.3% of returns)
This zip code:
$1,347
Virginia:
$1,688
Taxable dividends: $600 (reported on 9.3% of returns)
Here:
$600
State:
$4,028
Total itemized deductions: $13,794 (23% of AGI, reported on 15.7% of returns)
Here:
$13,794
State:
$21,492
Here:
23.3% of AGI
State:
21.0% of AGI
Charity contributions deductions: $1,385 (2% of AGI, reported on 12.0% of returns)
Here:
$1,385
State:
$3,794
Here:
2.2% of AGI
State:
3.5% of AGI
Total tax: $3,433 (reported on 72.7% of returns)
24139:
$3,433
State:
$9,537
(% of AGI for various income ranges: 1.4% for AGIs below $10k, 2.9% for AGIs $10k-25k, 7.0% for AGIs $25k-50k, 8.0% for AGIs $50k-75k, 13.4% for AGIs $75k-100k)
Earned income credit: $1,357 (reported on 25.9% of returns)
Here:
$1,357
State:
$1,734
Percentage of individuals using paid preparers for their 2004 taxes: 58.8%
Here:
59%
State:
52%
(% for various income ranges: 43.2% for AGIs below $10k, 56.7% for AGIs $10k-25k, 63.9% for AGIs $25k-50k, 103.7% for AGIs $50k-75k)
Household received Food Stamps/SNAP in the past 12 months: 143 Household did not receive Food Stamps/SNAP in the past 12 months: 257
Women who did not have a birth in the past 12 months: 21 (18 now married, 2 unmarried)
Housing units in zip code 24139 with a mortgage: 154 (14 second mortgage, 14 both second mortgage and home equity loan) Median monthly owner costs for units with a mortgage: $830 Median monthly owner costs for units without a mortgage: $286
Residents with income below the poverty level in 2022:
This zip code:
25.7%
Whole state:
10.6%
Residents with income below 50% of the poverty level in 2022:
This zip code:
20.5%
Whole state:
5.2%
Median number of rooms in houses and condos:
Here:
5.7
State:
7.0
Notable locations in this zip code not listed on our city pages
Streams, rivers, and creeks: Rorer Creek (A), Reddies Creek (B), Pigg River (C), Myers Creek (D), Muddy Run (E), Howell Creek (F), Potter Creek (G), Fryingpan Creek (H), Cliff Creek (I). Display/hide their locations on the map
Size of family households: 193 2-persons, 29 3-persons
Size of nonfamily households: 157 1-person, 6 2-persons
101.9% of residents of 24139 zip code speak English at home.
Foreign born population: 0 (0.0%)
:
0.0%
Whole state:
12.7%
24%American
24%English
16%Scottish
7%Irish
3%German
1%Scandinavian
Housing units lacking complete plumbing facilities: 1.6% Housing units lacking complete kitchen facilities: 5.4%
56.0%Electricity
25.3%Fuel oil, kerosene, etc.
10.8%Bottled, tank, or LP gas
4.6%Wood
4.0%No fuel used
Population in 1990: 415. Population change in the 1990s: +107 (+25.8%).
Place of birth for U.S.-born residents:
This state: 339
Northeast: 26
South: 272
West: 5
70% of the 24139 zip code residents lived in the same house 5 years ago. Out of people who lived in different houses, 58% lived in this county. Out of people who lived in different counties, 50% lived in Virginia.
101% of the 24139 zip code residents lived in the same house 1 year ago.
Students in private undergraduate colleges:
Here:
0.0%
Virginia:
18.7%
Companies with federal contracts located in this zip code:
ANNE E RYDER (1725 FISH HOOK TR in PITTSVILLE, VA; small business) : $20,520 in 4 contractsin 2004
$10,260 with Army for Guard Services. Signed on 2004-02-09. Completion date: 2004-04-27.
$10,260 with U.S. Army Corps of Engineers - civil program financing only for Guard Services. Signed on 2004-02-09. Completion date: 2004-04-27.
$0, same as above.Signed on 2004-02-09. Completion date: 2004-04-27.
$0 with Army for Guard Services. Signed on 2004-02-09. Completion date: 2004-04-27.
Top industries in this zip code by the number of employees in 2005:
Construction: Painting and Wall Covering Contractors (1-4 employees: 2 establishments)
Fatal accident statistics in 2014:
Fatal accident count: 1
Vehicles involved in fatal accidents: 1
Fatal accidents caused by drunken drivers: 1
Fatalities: 1
Persons involved in fatal accidents: 1
Pedestrians involved in fatal accidents: 0
Home Mortgage Disclosure Act Aggregated Statistics For Year 2009 (Based on 4 partial tracts)
A) FHA, FSA/RHS & VA Home Purchase Loans
B) Conventional Home Purchase Loans
C) Refinancings
D) Home Improvement Loans
F) Non-occupant Loans on < 5 Family Dwellings (A B C & D)
G) Loans On Manufactured Home Dwelling (A B C & D)
Number
Average Value
Number
Average Value
Number
Average Value
Number
Average Value
Number
Average Value
Number
Average Value
LOANS ORIGINATED
6
$121,455
8
$217,304
37
$182,089
4
$28,205
9
$323,774
4
$100,398
APPLICATIONS APPROVED, NOT ACCEPTED
0
$0
0
$0
2
$164,045
0
$0
0
$0
0
$0
APPLICATIONS DENIED
2
$93,415
4
$133,155
21
$124,845
1
$30,410
2
$225,880
6
$81,438
APPLICATIONS WITHDRAWN
2
$97,040
1
$129,780
7
$148,877
0
$0
1
$306,230
1
$78,120
FILES CLOSED FOR INCOMPLETENESS
1
$67,340
0
$0
3
$137,170
0
$0
0
$0
0
$0
Aggregated Statistics For Year 2008 (Based on 4 partial tracts)
A) FHA, FSA/RHS & VA Home Purchase Loans
B) Conventional Home Purchase Loans
C) Refinancings
D) Home Improvement Loans
F) Non-occupant Loans on < 5 Family Dwellings (A B C & D)
G) Loans On Manufactured Home Dwelling (A B C & D)
Number
Average Value
Number
Average Value
Number
Average Value
Number
Average Value
Number
Average Value
Number
Average Value
LOANS ORIGINATED
3
$111,837
10
$221,780
29
$157,785
5
$54,354
7
$250,167
6
$89,542
APPLICATIONS APPROVED, NOT ACCEPTED
0
$0
1
$74,240
4
$74,822
1
$14,820
0
$0
1
$65,860
APPLICATIONS DENIED
1
$91,840
2
$92,195
30
$121,360
5
$71,642
2
$160,915
7
$99,584
APPLICATIONS WITHDRAWN
0
$0
1
$234,090
8
$162,734
0
$0
1
$109,130
2
$98,795
FILES CLOSED FOR INCOMPLETENESS
0
$0
0
$0
2
$152,235
0
$0
0
$0
1
$51,290
Aggregated Statistics For Year 2007 (Based on 4 partial tracts)
A) FHA, FSA/RHS & VA Home Purchase Loans
B) Conventional Home Purchase Loans
C) Refinancings
D) Home Improvement Loans
F) Non-occupant Loans on < 5 Family Dwellings (A B C & D)
G) Loans On Manufactured Home Dwelling (A B C & D)
Number
Average Value
Number
Average Value
Number
Average Value
Number
Average Value
Number
Average Value
Number
Average Value
LOANS ORIGINATED
2
$77,640
23
$178,598
38
$138,416
6
$96,610
12
$269,761
11
$68,220
APPLICATIONS APPROVED, NOT ACCEPTED
0
$0
3
$168,710
11
$118,445
2
$112,760
1
$366,200
1
$120,440
APPLICATIONS DENIED
1
$47,560
7
$87,274
40
$123,446
8
$62,974
2
$201,130
9
$81,494
APPLICATIONS WITHDRAWN
1
$42,450
1
$95,410
21
$136,432
2
$28,165
1
$313,020
4
$56,595
FILES CLOSED FOR INCOMPLETENESS
1
$64,890
1
$291,510
2
$184,915
1
$17,120
1
$146,930
0
$0
Aggregated Statistics For Year 2006 (Based on 4 partial tracts)
A) FHA, FSA/RHS & VA Home Purchase Loans
B) Conventional Home Purchase Loans
C) Refinancings
D) Home Improvement Loans
F) Non-occupant Loans on < 5 Family Dwellings (A B C & D)
G) Loans On Manufactured Home Dwelling (A B C & D)
Number
Average Value
Number
Average Value
Number
Average Value
Number
Average Value
Number
Average Value
Number
Average Value
LOANS ORIGINATED
2
$145,310
29
$174,500
48
$139,737
6
$36,830
15
$247,632
10
$90,635
APPLICATIONS APPROVED, NOT ACCEPTED
0
$0
4
$125,322
8
$95,672
1
$34,530
1
$165,000
5
$57,212
APPLICATIONS DENIED
1
$58,630
10
$228,201
41
$101,133
8
$44,158
3
$500,157
13
$64,042
APPLICATIONS WITHDRAWN
0
$0
3
$106,110
24
$114,827
1
$137,760
1
$195,900
2
$95,140
FILES CLOSED FOR INCOMPLETENESS
0
$0
1
$321,800
2
$149,525
0
$0
0
$0
0
$0
Aggregated Statistics For Year 2005 (Based on 4 partial tracts)
A) FHA, FSA/RHS & VA Home Purchase Loans
B) Conventional Home Purchase Loans
C) Refinancings
D) Home Improvement Loans
F) Non-occupant Loans on < 5 Family Dwellings (A B C & D)
G) Loans On Manufactured Home Dwelling (A B C & D)
Number
Average Value
Number
Average Value
Number
Average Value
Number
Average Value
Number
Average Value
Number
Average Value
LOANS ORIGINATED
6
$88,382
30
$183,346
47
$109,830
9
$39,270
20
$209,595
13
$70,262
APPLICATIONS APPROVED, NOT ACCEPTED
0
$0
5
$104,222
9
$99,589
2
$36,960
2
$179,495
4
$64,198
APPLICATIONS DENIED
0
$0
13
$124,806
45
$87,794
9
$30,016
4
$169,652
14
$78,421
APPLICATIONS WITHDRAWN
0
$0
5
$155,204
20
$96,016
2
$45,840
2
$217,840
4
$63,218
FILES CLOSED FOR INCOMPLETENESS
0
$0
1
$199,680
3
$116,843
0
$0
1
$159,440
0
$0
Aggregated Statistics For Year 2004 (Based on 4 partial tracts)
A) FHA, FSA/RHS & VA Home Purchase Loans
B) Conventional Home Purchase Loans
C) Refinancings
D) Home Improvement Loans
F) Non-occupant Loans on < 5 Family Dwellings (A B C & D)
G) Loans On Manufactured Home Dwelling (A B C & D)
Number
Average Value
Number
Average Value
Number
Average Value
Number
Average Value
Number
Average Value
Number
Average Value
LOANS ORIGINATED
4
$121,722
30
$143,625
45
$114,489
5
$41,356
11
$209,425
10
$71,842
APPLICATIONS APPROVED, NOT ACCEPTED
0
$0
4
$130,812
10
$88,678
0
$0
2
$152,190
2
$53,515
APPLICATIONS DENIED
0
$0
12
$83,688
42
$98,516
7
$23,216
3
$97,357
13
$65,642
APPLICATIONS WITHDRAWN
0
$0
3
$87,753
23
$99,009
2
$51,100
2
$159,860
6
$69,775
FILES CLOSED FOR INCOMPLETENESS
0
$0
1
$66,690
4
$94,552
0
$0
0
$0
0
$0
Aggregated Statistics For Year 2003 (Based on 4 partial tracts)
A) FHA, FSA/RHS & VA Home Purchase Loans
B) Conventional Home Purchase Loans
C) Refinancings
D) Home Improvement Loans
F) Non-occupant Loans on < 5 Family Dwellings (A B C & D)
Number
Average Value
Number
Average Value
Number
Average Value
Number
Average Value
Number
Average Value
LOANS ORIGINATED
6
$84,933
24
$111,920
65
$110,504
15
$55,256
13
$171,981
APPLICATIONS APPROVED, NOT ACCEPTED
0
$0
3
$71,667
13
$81,433
0
$0
2
$124,830
APPLICATIONS DENIED
1
$58,270
12
$81,332
33
$102,459
4
$11,298
1
$89,500
APPLICATIONS WITHDRAWN
0
$0
2
$74,240
17
$89,119
1
$85,190
1
$81,430
FILES CLOSED FOR INCOMPLETENESS
0
$0
0
$0
3
$120,603
0
$0
0
$0
Aggregated Statistics For Year 2002 (Based on 2 partial tracts)
A) FHA, FSA/RHS & VA Home Purchase Loans
B) Conventional Home Purchase Loans
C) Refinancings
D) Home Improvement Loans
F) Non-occupant Loans on < 5 Family Dwellings (A B C & D)
Number
Average Value
Number
Average Value
Number
Average Value
Number
Average Value
Number
Average Value
LOANS ORIGINATED
1
$62,370
8
$93,161
20
$89,334
3
$18,163
6
$126,788
APPLICATIONS APPROVED, NOT ACCEPTED
0
$0
1
$57,650
5
$108,990
0
$0
1
$122,850
APPLICATIONS DENIED
0
$0
4
$40,320
20
$62,448
2
$13,860
1
$57,960
APPLICATIONS WITHDRAWN
1
$95,130
1
$14,810
8
$82,215
1
$32,760
1
$35,910
FILES CLOSED FOR INCOMPLETENESS
0
$0
1
$57,330
1
$38,430
0
$0
0
$0
Aggregated Statistics For Year 2001 (Based on 2 partial tracts)
A) FHA, FSA/RHS & VA Home Purchase Loans
B) Conventional Home Purchase Loans
C) Refinancings
D) Home Improvement Loans
F) Non-occupant Loans on < 5 Family Dwellings (A B C & D)
Number
Average Value
Number
Average Value
Number
Average Value
Number
Average Value
Number
Average Value
LOANS ORIGINATED
2
$77,020
7
$92,114
20
$80,577
4
$8,190
4
$151,358
APPLICATIONS APPROVED, NOT ACCEPTED
0
$0
2
$49,610
4
$73,472
1
$37,800
2
$29,135
APPLICATIONS DENIED
0
$0
6
$47,827
20
$56,936
2
$18,270
0
$0
APPLICATIONS WITHDRAWN
0
$0
1
$119,390
6
$69,405
0
$0
0
$0
FILES CLOSED FOR INCOMPLETENESS
0
$0
0
$0
2
$63,475
0
$0
0
$0
Aggregated Statistics For Year 2000 (Based on 2 partial tracts)
A) FHA, FSA/RHS & VA Home Purchase Loans
B) Conventional Home Purchase Loans
C) Refinancings
D) Home Improvement Loans
F) Non-occupant Loans on < 5 Family Dwellings (A B C & D)
Number
Average Value
Number
Average Value
Number
Average Value
Number
Average Value
Number
Average Value
LOANS ORIGINATED
1
$79,380
9
$81,724
10
$108,140
4
$6,692
3
$94,607
APPLICATIONS APPROVED, NOT ACCEPTED
0
$0
3
$54,390
2
$53,710
1
$14,490
0
$0
APPLICATIONS DENIED
0
$0
8
$48,865
12
$47,171
2
$17,955
0
$0
APPLICATIONS WITHDRAWN
1
$117,500
1
$49,140
4
$67,252
0
$0
0
$0
FILES CLOSED FOR INCOMPLETENESS
0
$0
0
$0
1
$32,450
0
$0
0
$0
Aggregated Statistics For Year 1999 (Based on 2 partial tracts)
A) FHA, FSA/RHS & VA Home Purchase Loans
B) Conventional Home Purchase Loans
C) Refinancings
D) Home Improvement Loans
F) Non-occupant Loans on < 5 Family Dwellings (A B C & D)
Detailed PMIC statistics for the following Tracts:0103.00
, 0305.01
2003 - 2018 National Fire Incident Reporting System (NFIRS) incidents
Based on the data from the years 2003 - 2018 the average number of fires per year is 7. The highest number of reported fire incidents - 17 took place in 2007, and the least - 0 in 2011. The data has an increasing trend.
When looking into fire subcategories, the most reports belonged to: Outside Fires (43.9%), and Structure Fires (40.4%).
Fire incident types reported to NFIRS in Zip Code 24139


 Nearest zip codes: 24161, 24104, 24571, 24531, 24557, 24137.


 : $20,520 in 4 contracts in 2004


 Based on the data from the years 2003 - 2018 the average number of fires per year is 7. The highest number of reported fire incidents - 17 took place in 2007, and the least - 0 in 2011. The data has an increasing trend.
 When looking into fire subcategories, the most reports belonged to: Outside Fires (43.9%), and Structure Fires (40.4%).