Estimated zip code population in 2022: 912 Zip code population in 2010: 1,253 Zip code population in 2000: 1,380
Houses and condos: 713 Renter-occupied apartments: 122
% of renters here:
23%
State:
33%
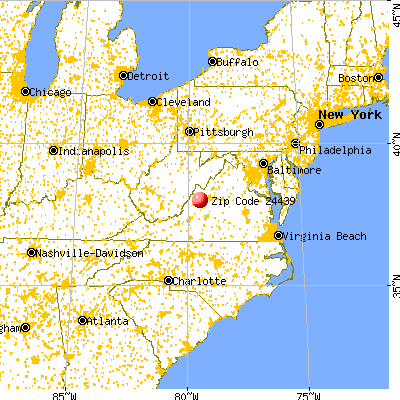
March 2022 cost of living index in zip code 24439: 84.9 (less than average, U.S. average is 100)
Land area: 94.8 sq. mi. Water area: 1.2 sq. mi.
Population density: 10 people per square mile
(very low).
OSM Map
General Map
Google Map
MSN Map
OSM Map
General Map
Google Map
MSN Map
OSM Map
General Map
Google Map
MSN Map
OSM Map
General Map
Google Map
MSN Map
Please wait while loading the map...
Real estate property taxes paid for housing units in 2022:
This zip code:
0.5% ($885)
Virginia:
0.7% ($2,617)
Median real estate property taxes paid for housing units with mortgages in 2022: $1,690 (0.6%) Median real estate property taxes paid for housing units with no mortgage in 2022: $835 (0.5%)
Business Search- 14 Million verified businesses
Males: 457
(50.1%)
Females: 454
(49.9%)
For population 25 years and over in 24439:
High school or higher: 78.0%
Bachelor's degree or higher: 6.4%
Graduate or professional degree: 5.0%
Unemployed: 3.6%
Mean travel time to work (commute): 34.9 minutes
For population 15 years and over in 24439:
Never married: 20.4%
Now married: 39.5%
Separated: 1.4%
Widowed: 13.4%
Divorced: 25.3%
Zip code 24439 compared to state average:
Median household income significantly below state average.
Median house value below state average.
Black race population percentage significantly below state average.
Hispanic race population percentage significantly below state average.
Median age significantly above state average.
Foreign-born population percentage significantly below state average.
Length of stay since moving in significantly above state average.
Number of college students below state average.
Percentage of population with a bachelor's degree or higher significantly below state average.
Averages for the 2020 tax year for zip code 24439, filed in 2021:
Average Adjusted Gross Income (AGI) in 2020: $43,265 (Individual Income Tax Returns)
Here:
$43,265
State:
$86,446
Salary/wage: $37,307 (reported on 85.4% of returns)
Here:
$37,307
State:
$71,185
(% of AGI for various income ranges: 1168.7% for AGIs below $25k, 3472.3% for AGIs $25k-50k, 6011.7% for AGIs $50k-75k, 4840.0% for AGIs $75k-100k)
Taxable interest for individuals: $812 (reported on 16.7% of returns)
This zip code:
$812
Virginia:
$1,805
(% of AGI for various income ranges: 20.0% for AGIs below $25k, 58.3% for AGIs $50k-75k)
Ordinary dividends: $2,025 (reported on 8.3% of returns)
Here:
$2,025
State:
$8,327
(% of AGI for various income ranges: 12.7% for AGIs below $25k, 103.3% for AGIs $50k-75k)
Net capital gain/loss in AGI: +$6,825 (reported on 8.3% of returns)
Here:
+$6,825
State:
+$24,644
(% of AGI for various income ranges: 455.0% for AGIs $50k-75k)
Profit/loss from business: +$7,080 (reported on 10.4% of returns)
Here:
+$7,080
State:
+$12,836
(% of AGI for various income ranges: 62.7% for AGIs below $25k, 200.0% for AGIs $25k-50k)
Taxable individual retirement arrangement distribution: $10,450 (reported on 4.2% of returns)
24439:
$10,450
Virginia:
$21,535
(% of AGI for various income ranges: 139.3% for AGIs below $25k)
Earned income credit: $2,008 (reported on 25.0% of returns)
Here:
$2,008
State:
$2,214
(% of AGI for various income ranges: 94.0% for AGIs below $25k, 76.9% for AGIs $25k-50k)
Percentage of individuals using paid preparers for their 2020 taxes: 93.8%
Here:
94%
State:
92%
(% for various income ranges: 94.7% for AGIs below $25k, 93.3% for AGIs $25k-50k, 87.5% for AGIs $50k-75k, 100.0% for AGIs $75k-100k, 100.0% for AGIs $100k-200k)
Averages for the 2012 tax year for zip code 24439, filed in 2013:
Average Adjusted Gross Income (AGI) in 2012: $34,309 (Individual Income Tax Returns)
Here:
$34,309
State:
$71,192
Salary/wage: $29,502 (reported on 89.4% of returns)
Here:
$29,502
State:
$59,229
(% of AGI for various income ranges: 78.4% for AGIs below $25k, 82.4% for AGIs $25k-50k, 78.4% for AGIs $50k-75k, 66.6% for AGIs $75k-100k)
Taxable interest for individuals: $1,082 (reported on 23.4% of returns)
This zip code:
$1,082
Virginia:
$1,600
(% of AGI for various income ranges: 1.0% for AGIs below $25k, 1.4% for AGIs $25k-50k, 0.4% for AGIs $50k-75k)
Ordinary dividends: $1,600 (reported on 10.6% of returns)
Here:
$1,600
State:
$6,959
Profit/loss from business: +$6,900 (reported on 8.5% of returns)
Here:
+$6,900
State:
+$14,116
Taxable individual retirement arrangement distribution: $5,667 (reported on 6.4% of returns)
24439:
$5,667
Virginia:
$16,667
Total itemized deductions: $20,157 (29% of AGI, reported on 14.9% of returns)
Here:
$20,157
State:
$26,596
Here:
28.7% of AGI
State:
20.1% of AGI
(% of AGI for various income ranges: 15.9% for AGIs below $25k, 10.5% for AGIs $50k-75k, 13.4% for AGIs $75k-100k)
Charity contributions: $3,640 (reported on 10.6% of returns)
Here:
$3,640
State:
$4,443
Taxes paid: $5,671 (reported on 14.9% of returns)
24439:
$5,671
State:
$9,951
(% of AGI for various income ranges: 1.7% for AGIs $25k-50k, 2.4% for AGIs $50k-75k, 5.4% for AGIs $75k-100k)
Earned income credit: $2,064 (reported on 23.4% of returns)
Here:
$2,064
State:
$2,211
(% of AGI for various income ranges: 5.6% for AGIs below $25k, 1.1% for AGIs $25k-50k)
Percentage of individuals using paid preparers for their 2012 taxes: 51.1%
Here:
51%
State:
46%
(% for various income ranges: 45.5% for AGIs below $25k, 53.3% for AGIs $25k-50k, 66.7% for AGIs $50k-75k, 50.0% for AGIs $75k-100k)
Averages for the 2004 tax year for zip code 24439, filed in 2005:
Average Adjusted Gross Income (AGI) in 2004: $30,899 (Individual Income Tax Returns)
Here:
$30,899
State:
$56,704
Salary/wage: $27,056 (reported on 86.8% of returns)
Here:
$27,056
State:
$48,441
(% of AGI for various income ranges: 112.0% for AGIs below $10k, 82.6% for AGIs $10k-25k, 84.4% for AGIs $25k-50k, 81.9% for AGIs $50k-75k, 110.3% for AGIs $75k-100k)
Taxable interest for individuals: $1,026 (reported on 31.2% of returns)
This zip code:
$1,026
Virginia:
$1,688
(% of AGI for various income ranges: 10.2% for AGIs below $10k, 2.4% for AGIs $10k-25k, 0.5% for AGIs $25k-50k, 0.6% for AGIs $50k-75k, 1.0% for AGIs $75k-100k)
Taxable dividends: $1,633 (reported on 9.9% of returns)
Here:
$1,633
State:
$4,028
Net capital gain/loss: +$3,674 (reported on 8.7% of returns)
Here:
+$3,674
State:
+$14,375
Profit/loss from business: +$5,846 (reported on 10.5% of returns)
Here:
+$5,846
State:
+$13,342
Total itemized deductions: $13,405 (23% of AGI, reported on 16.0% of returns)
Here:
$13,405
State:
$21,492
Here:
23.5% of AGI
State:
21.0% of AGI
(% of AGI for various income ranges: 7.1% for AGIs $10k-25k, 6.0% for AGIs $25k-50k, 9.1% for AGIs $50k-75k, 16.3% for AGIs $75k-100k)
Charity contributions deductions: $2,130 (3% of AGI, reported on 11.0% of returns)
Here:
$2,130
State:
$3,794
Here:
3.5% of AGI
State:
3.5% of AGI
Total tax: $3,238 (reported on 70.8% of returns)
24439:
$3,238
State:
$9,537
(% of AGI for various income ranges: 2.2% for AGIs below $10k, 4.5% for AGIs $10k-25k, 5.8% for AGIs $25k-50k, 7.7% for AGIs $50k-75k, 11.7% for AGIs $75k-100k, 13.3% for AGIs over 100k)
Earned income credit: $1,785 (reported on 21.7% of returns)
Here:
$1,785
State:
$1,734
Percentage of individuals using paid preparers for their 2004 taxes: 56.4%
Here:
56%
State:
52%
(% for various income ranges: 44.6% for AGIs below $10k, 60.4% for AGIs $10k-25k, 56.2% for AGIs $25k-50k, 65.3% for AGIs $50k-75k, 94.7% for AGIs $75k-100k)
Household received Food Stamps/SNAP in the past 12 months: 79 Household did not receive Food Stamps/SNAP in the past 12 months: 466
Women who had a birth in the past 12 months: 1 (1 now married, 0 unmarried) Women who did not have a birth in the past 12 months: 126 (42 now married, 84 unmarried)
Housing units in zip code 24439 with a mortgage: 96 (19 second mortgage, 19 both second mortgage and home equity loan) Houses without a mortgage: 34
Median monthly owner costs for units with a mortgage: $1,017 Median monthly owner costs for units without a mortgage: $273
Residents with income below the poverty level in 2022:
This zip code:
20.1%
Whole state:
10.6%
Residents with income below 50% of the poverty level in 2022:
This zip code:
8.3%
Whole state:
5.2%
Median number of rooms in houses and condos:
Here:
4.9
State:
7.0
Median number of rooms in apartments:
Here:
4.1
State:
4.3
Notable locations in this zip code not listed on our city pages
Streams, rivers, and creeks: Toma Run (A), Smith Creek (B), Mill Creek (C), Grassy Run (D), Goshen Branch (E), Gochenour Branch (F), Glover Run (G), Glendye Branch (H), Elephant Creek (I). Display/hide their locations on the map
Size of family households: 151 2-persons, 26 3-persons, 8 4-persons, 4 5-persons, 1 6-persons
Size of nonfamily households: 262 1-person, 89 2-persons, 2 4-persons
26 married couples with children.
21 single-parent households (21 women).
100.3% of residents of 24439 zip code speak English at home.
Foreign born population: 6 (0.7%) (100.0% of them are naturalized citizens)
This zip code:
0.7%
Whole state:
12.7%
37%American
12%English
11%Irish
8%German
6%Scotch-Irish
4%Italian
2%French
Year of entry for the foreign-born population
02010 or later
02000 to 2009
01990 to 1999
5Before 1990
Facilities with environmental interests located in this zip code:
BURKE-PARSONS-BOWLBY (9223 MAURY RIVER ROAD in GOSHEN, VA)
AIR SYNTHETIC MINOR (AIRS/AFS) STATE MASTER (Virginia pollutants databases) - CEDS-80709, AIR PROGRAM CRITERIA AND HAZARDOUS AIR POLLUTANT INVENTORY (Inventory of air pollution sources) National Pollutant Discharge Elimination System NON-MAJOR (Tracking pollutant discharge elimination systems) - permit HAZARDOUS WASTE BIENNIAL REPORTER (Resource Conservation and Recovery Act (tracking hazardous waste)) - ICIS-, ENFORCEMENT/COMPLIANCE ACTIVITY Large Quantity Generators, more that 1000 kg of hazardous waste/month (Resource Conservation and Recovery Act (tracking hazardous waste)) - ICIS-, ENFORCEMENT/COMPLIANCE ACTIVITY TRI REPORTER (Tracking of toxic chemicals releasing facilities) Business SIC classification: WOOD PRESERVING Business NAICS classification: WOOD PRESERVATION.; WOOD PRESERVATION.; WOOD PRESERVATION. Organizations: BURKE PARSONS BOWLBY CORPORATION (CONTACT/OPERATOR)
Alternative names: BURKE-PARSON-BOWLBY CORP THE
Housing units lacking complete plumbing facilities: 13.7% Housing units lacking complete kitchen facilities: 9.6%
35.8%Electricity
32.2%Wood
19.1%Fuel oil, kerosene, etc.
13.3%Bottled, tank, or LP gas
Population in 1990: 1,173. Population change in the 1990s: +207 (+17.6%).
Place of birth for U.S.-born residents:
This state: 738
Northeast: 60
Midwest: 21
South: 50
West: 28
69% of the 24439 zip code residents lived in the same house 5 years ago. Out of people who lived in different houses, 56% lived in this county. Out of people who lived in different counties, 50% lived in Virginia.
93% of the 24439 zip code residents lived in the same house 1 year ago. Out of people who lived in different houses, 50% moved from this county. Out of people who lived in different houses, 50% moved from different county within same state.
Private vs. public school enrollment:
Students in private schools in grades 1 to 8 (elementary and middle school):
Here:
0.0%
Virginia:
13.2%
Students in private schools in grades 9 to 12 (high school):
Here:
0.0%
Virginia:
10.2%
Students in private undergraduate colleges:
Here:
0.0%
Virginia:
18.7%
Occupation by median earnings in the past 12 months ($)
110,833Farming, fishing, and forestry occupations
89,094Installation, maintenance, and repair occupations
69,113Management occupations
66,980Office and administrative support occupations
23,158Healthcare support occupations
22,804Production occupations
Companies with federal contracts located in this zip code:
CASTA LINE TROUT FARMS (97 GOLDEN BROOK LN in GOSHEN, VA; small business) : $82,580 in 6 contractsfrom 2002 to 2005
Contracts for Fish Hatchery Services by Army Signed by year:2000: $0; 2001: $0; 2002: $6,120; 2003: $19,440; 2004: $18,868; 2005: $38,152; 2006: $0.
Biggest contracts:
$19,076 with Army for Fish Hatchery Services. Signed on 2005-12-08. Completion date: 2006-05-31.
$19,076, same as above.Signed on 2005-12-08. Completion date: 2006-05-31.
$18,868, same as above.Signed on 2004-12-02. Completion date: 2005-04-30.
$16,920, same as above.Signed on 2003-11-06. Completion date: 2004-05-31.
Top industries in this zip code by the number of employees in 2005:
Accommodation and Food Services: Recreational and Vacation Camps (except Campgrounds) (20-49 employees: 1 establishment, 1-4 employees: 2 establishments)
Health Care and Social Assistance: Community Food Services (1-4: 1)
Construction: Masonry Contractors (1-4: 1)
Accommodation and Food Services: Food Service Contractors (1-4: 1)
People in group quarters in 2000:
13 people in nursing homes
4 people in agriculture workers' dormitories on farms
Fatal accident statistics in 2014:
Fatal accident count: 1
Vehicles involved in fatal accidents: 1
Fatal accidents caused by drunken drivers: 0
Fatalities: 1
Persons involved in fatal accidents: 1
Pedestrians involved in fatal accidents: 0
Fatal accident statistics in 2013:
Fatal accident count: 1
Vehicles involved in fatal accidents: 1
Fatal accidents caused by drunken drivers: 0
Fatalities: 1
Persons involved in fatal accidents: 2
Pedestrians involved in fatal accidents: 0
2002 - 2018 National Fire Incident Reporting System (NFIRS) incidents
Based on the data from the years 2002 - 2018 the average number of fire incidents per year is 12. The highest number of reported fire incidents - 25 took place in 2009, and the least - 2 in 2003. The data has a rising trend.
When looking into fire subcategories, the most incidents belonged to: Structure Fires (57.5%), and Outside Fires (28.0%).
Fire incident types reported to NFIRS in Zip Code 24439


 Nearest zip codes: 24473, 24432, 24430, 24460, 24415, 24459.


 Based on the data from the years 2002 - 2018 the average number of fire incidents per year is 12. The highest number of reported fire incidents - 25 took place in 2009, and the least - 2 in 2003. The data has a rising trend.
 When looking into fire subcategories, the most incidents belonged to: Structure Fires (57.5%), and Outside Fires (28.0%).