Estimated median house/condo value in 2022: $68,082
25039:
$68,082
West Virginia:
$155,100
According to our research of West Virginia and other state lists, there were 2 registered sex offenders living in 25039 zip code as of May 03, 2024. The ratio of all residents to sex offenders in zip code 25039 is 515 to 1. The ratio of registered sex offenders to all residents in this zip code is lower than the state average.
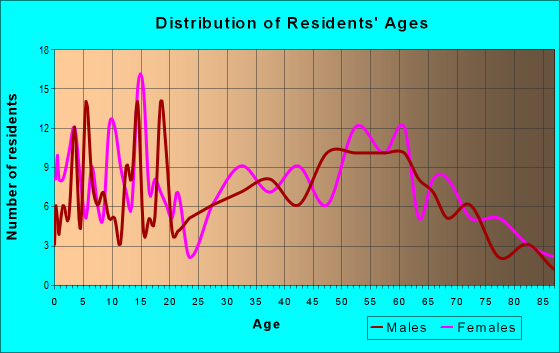
Median resident age:
This zip code:
46.3 years
West Virginia median age:
42.9 years
Average household size:
This zip code:
2.7 people
West Virginia:
2.3 people
Averages for the 2020 tax year for zip code 25039, filed in 2021:
Average Adjusted Gross Income (AGI) in 2020: $41,362 (Individual Income Tax Returns)
Here:
$41,362
State:
$56,292
Salary/wage: $36,735 (reported on 85.0% of returns)
Here:
$36,735
State:
$49,093
(% of AGI for various income ranges: 1039.1% for AGIs below $25k, 3184.0% for AGIs $25k-50k, 6760.0% for AGIs $50k-75k, 5466.0% for AGIs $75k-100k)
Taxable interest for individuals: $133 (reported on 15.0% of returns)
This zip code:
$133
West Virginia:
$1,141
(% of AGI for various income ranges: 2.7% for AGIs below $25k, 12.5% for AGIs $50k-75k)
Ordinary dividends: $1,750 (reported on 5.0% of returns)
Here:
$1,750
State:
$5,456
(% of AGI for various income ranges: 31.8% for AGIs below $25k)
Earned income credit: $1,970 (reported on 25.0% of returns)
Here:
$1,970
State:
$2,258
(% of AGI for various income ranges: 111.8% for AGIs below $25k, 74.0% for AGIs $25k-50k)
Percentage of individuals using paid preparers for their 2020 taxes: 92.5%
Here:
92%
State:
93%
(% for various income ranges: 93.3% for AGIs below $25k, 91.7% for AGIs $25k-50k, 83.3% for AGIs $50k-75k, 100.0% for AGIs $75k-100k, 100.0% for AGIs $100k-200k)
Averages for the 2012 tax year for zip code 25039, filed in 2013:
Average Adjusted Gross Income (AGI) in 2012: $35,380 (Individual Income Tax Returns)
Here:
$35,380
State:
$48,628
Salary/wage: $32,155 (reported on 89.8% of returns)
Here:
$32,155
State:
$42,328
(% of AGI for various income ranges: 74.5% for AGIs below $25k, 81.8% for AGIs $25k-50k, 79.8% for AGIs $50k-75k, 90.9% for AGIs $75k-100k, 78.8% for AGIs $100k-200k)
Taxable interest for individuals: $314 (reported on 14.3% of returns)
This zip code:
$314
West Virginia:
$1,211
Ordinary dividends: $400 (reported on 6.1% of returns)
Here:
$400
State:
$4,262
Profit/loss from business: +$4,550 (reported on 4.1% of returns)
Here:
+$4,550
State:
+$13,636
Total itemized deductions: $14,333 (16% of AGI, reported on 6.1% of returns)
Here:
$14,333
State:
$21,148
Here:
16.0% of AGI
State:
18.1% of AGI
Taxes paid: $5,767 (reported on 6.1% of returns)
25039:
$5,767
State:
$8,103
Earned income credit: $2,285 (reported on 26.5% of returns)
Here:
$2,285
State:
$2,140
(% of AGI for various income ranges: 8.2% for AGIs below $25k, 1.5% for AGIs $25k-50k)
Percentage of individuals using paid preparers for their 2012 taxes: 44.9%
Here:
45%
State:
49%
(% for various income ranges: 40.0% for AGIs below $25k, 54.5% for AGIs $25k-50k, 50.0% for AGIs $50k-75k, 75.0% for AGIs $75k-100k)
Averages for the 2004 tax year for zip code 25039, filed in 2005:
Average Adjusted Gross Income (AGI) in 2004: $28,733 (Individual Income Tax Returns)
Here:
$28,733
State:
$37,498
Salary/wage: $28,582 (reported on 86.9% of returns)
Here:
$28,582
State:
$33,645
(% of AGI for various income ranges: 84.3% for AGIs below $10k, 78.5% for AGIs $10k-25k, 85.7% for AGIs $25k-50k, 93.0% for AGIs $50k-75k, 152.0% for AGIs $75k-100k)
Taxable interest for individuals: $658 (reported on 23.5% of returns)
This zip code:
$658
West Virginia:
$1,465
(% of AGI for various income ranges: 1.9% for AGIs below $10k, 1.4% for AGIs $10k-25k, 0.3% for AGIs $25k-50k, 0.2% for AGIs $50k-75k, 0.4% for AGIs $75k-100k)
Taxable dividends: $405 (reported on 7.4% of returns)
Here:
$405
State:
$2,913
Net capital gain/loss: +$562 (reported on 3.2% of returns)
Here:
+$562
State:
+$6,331
Profit/loss from business: +$2,273 (reported on 6.6% of returns)
Here:
+$2,273
State:
+$11,074
Total itemized deductions: $13,393 (17% of AGI, reported on 5.6% of returns)
Here:
$13,393
State:
$16,976
Here:
17.3% of AGI
State:
19.0% of AGI
Charity contributions deductions: $2,474 (3% of AGI, reported on 3.8% of returns)
Here:
$2,474
State:
$3,529
Here:
3.3% of AGI
State:
3.7% of AGI
Total tax: $3,397 (reported on 64.3% of returns)
25039:
$3,397
State:
$5,372
(% of AGI for various income ranges: 1.7% for AGIs below $10k, 2.8% for AGIs $10k-25k, 6.5% for AGIs $25k-50k, 8.8% for AGIs $50k-75k, 11.0% for AGIs $75k-100k, 15.9% for AGIs over 100k)
Earned income credit: $1,827 (reported on 27.9% of returns)
Here:
$1,827
State:
$1,662
Percentage of individuals using paid preparers for their 2004 taxes: 54.0%
Here:
54%
State:
55%
(% for various income ranges: 51.6% for AGIs below $10k, 56.8% for AGIs $10k-25k, 55.2% for AGIs $25k-50k, 50.0% for AGIs $50k-75k, 76.2% for AGIs $75k-100k)
Household received Food Stamps/SNAP in the past 12 months: 44 Household did not receive Food Stamps/SNAP in the past 12 months: 226
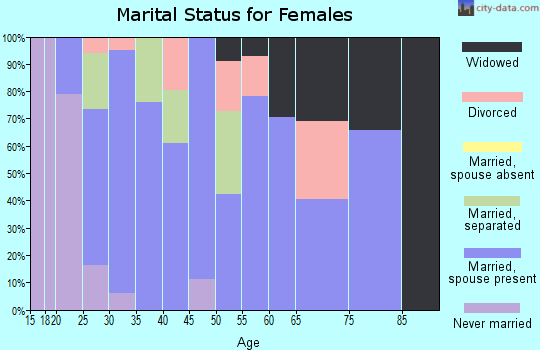
Women who had a birth in the past 12 months: 12 (5 now married, 6 unmarried) Women who did not have a birth in the past 12 months: 138 (55 now married, 83 unmarried)
Housing units in zip code 25039 with a mortgage: 56 (4 second mortgage, 4 both second mortgage and home equity loan) Houses without a mortgage: 5
Median monthly owner costs for units with a mortgage: $1,008 Median monthly owner costs for units without a mortgage: $441
Residents with income below the poverty level in 2022:
This zip code:
20.9%
Whole state:
17.9%
Residents with income below 50% of the poverty level in 2022:
This zip code:
20.2%
Whole state:
9.7%
Median number of rooms in houses and condos:
Here:
6.2
State:
6.5
Median number of rooms in apartments:
Here:
4.7
State:
4.7
Notable locations in this zip code not listed on our city pages
Notable locations in zip code 25039: Kanawha County Emergency Ambulance Authority Station 68 (A), Cedar Grove Volunteer Fire Department (B). Display/hide their locations on the map
Size of family households: 111 2-persons, 63 3-persons, 30 4-persons, 22 5-persons
Size of nonfamily households: 45 1-person
27 married couples with children.
28 single-parent households (11 men, 17 women).
All residents speak English at home
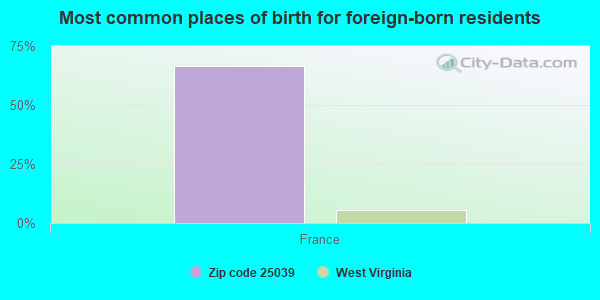
Foreign born population: 3 (0.5%) (100.0% of them are naturalized citizens)
This zip code:
0.5%
Whole state:
1.8%
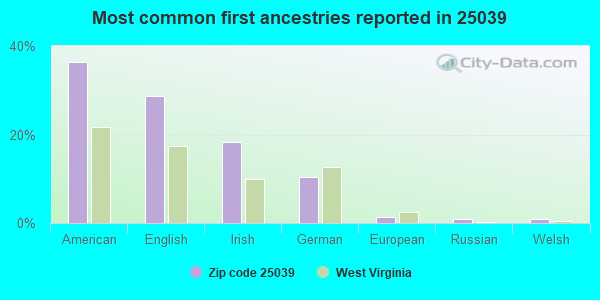
67%France
36%American
29%English
18%Irish
10%German
1%European
1%Russian
1%Welsh
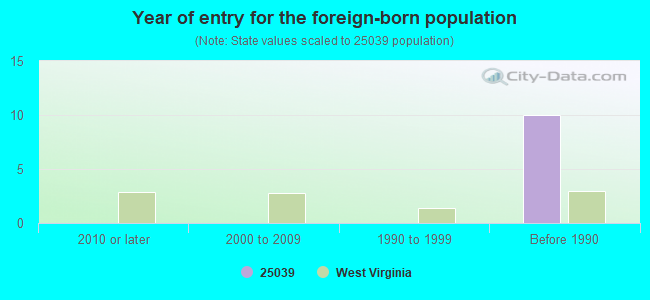
Year of entry for the foreign-born population
02010 or later
02000 to 2009
01990 to 1999
10Before 1990
Facilities with environmental interests located in this zip code:
CEDAR GROVE COMMUNITY ELEMENTARY SCHOOL (JOHN STREET in CEDAR GROVE, WV)
COMPLIANCE ACTIVITY (Tracking inspections of insecticide, fungicide, and rodenticide, and toxic substances) (National Center for Education Statistics) - STATE ID-39213 Organizations: KANAWHA COUNTY SCHOOL DISTRICT (SCHOOL DISTRICT)
Alternative names: CEDAR GROVE COMMUNITY SCHOOL
FANNIN SALVAGE (KELLEY'S CREEK P.O. BOX 405 in CEDAR GROVE, WV)
(Integrated Compliance Information System) - ICIS-03-1990-0001, FORMAL ENFORCEMENT ACTION COMPLIANCE ACTIVITY (Tracking inspections of insecticide, fungicide, and rodenticide, and toxic substances) Business SIC classification: SPECIAL WAREHOUSING AND STORAGE; MISCELLANEOUS RETAIL STORES
EXXON RAS #29794 (704 US RT 60 E in CEDAR GROVE, WV)
(Resource Conservation and Recovery Act (tracking hazardous waste)) Organizations: OPERNAME (CONTACT/OPERATOR)
, EXXON MOBIL (CONTACT/OWNER)
CEDAR GROVE TOWN OF (302 ALEXANDER STREET in CEDAR GROVE, WV)
National Pollutant Discharge Elimination System NON-MAJOR (Tracking pollutant discharge elimination systems) - permit Business SIC classification: SEWERAGE SYSTEMS Organizations: CEDAR GROVE, TOWN OF (CONTACT/OWNER)
Alternative names: TOWN OF CEDAR GROVE
CEDAR GROVE EXXON (P O BOX 787 in CEDAR GROVE, WV)
(Resource Conservation and Recovery Act (tracking hazardous waste))
BERRY TRUCKING CO INC (OLD RT 60 AND KELLYS CREEK RD in CEDAR GROVE, WV)
Conditionally Exempt Small Quantity Generators, less than 100 kg/month of hazardous waste (Resource Conservation and Recovery Act (tracking hazardous waste)) - notification Organizations: MARGET BERRY (CONTACT/OWNER)
CGST-BUFF LICK COMPRESSOR STATION (KELLEYS CREEK RD in CEDAR GROVE, WV)
Conditionally Exempt Small Quantity Generators, less than 100 kg/month of hazardous waste (Resource Conservation and Recovery Act (tracking hazardous waste)) - notification Organizations: COLUMBIA GAS TRANSMISSION CORP (CONTACT/OWNER)
CEDAR GROVE MUNICIPAL BUILDING (302 ALEXANDER ST in CEDAR GROVE, WV)
COMPLIANCE ACTIVITY (Tracking inspections of insecticide, fungicide, and rodenticide, and toxic substances)
Housing units lacking complete plumbing facilities: 2.1%
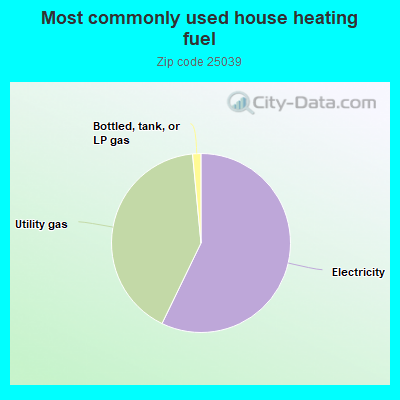
57.3%Electricity
41.4%Utility gas
1.5%Bottled, tank, or LP gas
Population in 1990: 3,463.
Place of birth for U.S.-born residents:
This state: 677
South: 32
West: 1
66% of the 25039 zip code residents lived in the same house 5 years ago. Out of people who lived in different houses, 84% lived in this county. Out of people who lived in different counties, 50% lived in West Virginia.
97% of the 25039 zip code residents lived in the same house 1 year ago. Out of people who lived in different houses, 18% moved from this county. Out of people who lived in different houses, 24% moved from different county within same state. Out of people who lived in different houses, 59% moved from different state.
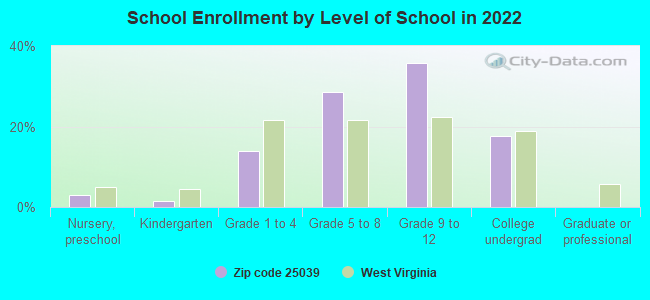
Private vs. public school enrollment:
Students in private schools in grades 1 to 8 (elementary and middle school):
Here:
0.0%
West Virginia:
12.2%
Students in private schools in grades 9 to 12 (high school):
Here:
0.0%
West Virginia:
8.8%
Students in private undergraduate colleges: 26
Here:
91.4%
West Virginia:
17.3%
Occupation by median earnings in the past 12 months ($)
59,249Transportation occupations
37,988Office and administrative support occupations
30,395Health technologists and technicians
20,596Building and grounds cleaning and maintenance occupations
18,304Sales and related occupations
Top industries in this zip code by the number of employees in 2005:
Mining: Crude Petroleum and Natural Gas Extraction (10-19 employees: 1 establishment)
Health Care and Social Assistance: All Other Outpatient Care Centers (10-19: 1)
Other Services (except Public Administration): Commercial and Industrial Machinery and Equipment (except Automotive and Electronic) Repair and Maintenance (5-9: 1, 1-4: 1)
Other Services (except Public Administration): Funeral Homes and Funeral Services (5-9: 1)
Health Care and Social Assistance: Homes for the Elderly (1-4: 1)
People in group quarters in 2010:
3 people in nursing facilities/skilled-nursing facilities
2 people in workers' group living quarters and job corps centers
People in group quarters in 2000:
6 people in other noninstitutional group quarters
Fatal accident statistics in 2013:
Fatal accident count: 1
Vehicles involved in fatal accidents: 2
Fatal accidents caused by drunken drivers: 0
Fatalities: 1
Persons involved in fatal accidents: 2
Pedestrians involved in fatal accidents: 0
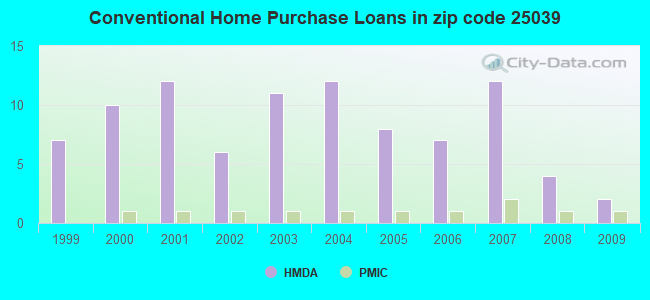
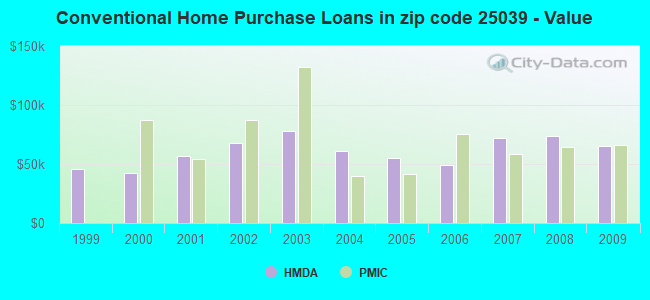
Home Mortgage Disclosure Act Aggregated Statistics For Year 2009 (Based on 2 partial tracts)
A) FHA, FSA/RHS & VA Home Purchase Loans
B) Conventional Home Purchase Loans
C) Refinancings
D) Home Improvement Loans
G) Loans On Manufactured Home Dwelling (A B C & D)
Number
Average Value
Number
Average Value
Number
Average Value
Number
Average Value
Number
Average Value
LOANS ORIGINATED
1
$77,080
2
$65,425
10
$70,676
5
$33,006
2
$32,480
APPLICATIONS APPROVED, NOT ACCEPTED
0
$0
1
$63,710
1
$55,320
0
$0
2
$38,695
APPLICATIONS DENIED
1
$86,090
3
$67,753
6
$84,952
3
$19,270
3
$60,607
APPLICATIONS WITHDRAWN
0
$0
1
$75,210
2
$81,275
0
$0
0
$0
FILES CLOSED FOR INCOMPLETENESS
0
$0
0
$0
1
$107,850
0
$0
0
$0
Aggregated Statistics For Year 2008 (Based on 2 partial tracts)
A) FHA, FSA/RHS & VA Home Purchase Loans
B) Conventional Home Purchase Loans
C) Refinancings
D) Home Improvement Loans
F) Non-occupant Loans on < 5 Family Dwellings (A B C & D)
G) Loans On Manufactured Home Dwelling (A B C & D)
Number
Average Value
Number
Average Value
Number
Average Value
Number
Average Value
Number
Average Value
Number
Average Value
LOANS ORIGINATED
2
$101,785
4
$73,582
9
$72,900
3
$29,527
2
$33,410
2
$61,230
APPLICATIONS APPROVED, NOT ACCEPTED
0
$0
1
$76,150
1
$50,660
1
$36,990
0
$0
1
$15,540
APPLICATIONS DENIED
1
$44,440
4
$71,408
9
$97,522
3
$16,887
0
$0
5
$71,856
APPLICATIONS WITHDRAWN
0
$0
0
$0
4
$84,382
0
$0
1
$101,320
0
$0
FILES CLOSED FOR INCOMPLETENESS
0
$0
0
$0
0
$0
0
$0
0
$0
0
$0
Aggregated Statistics For Year 2007 (Based on 2 partial tracts)
A) FHA, FSA/RHS & VA Home Purchase Loans
B) Conventional Home Purchase Loans
C) Refinancings
D) Home Improvement Loans
F) Non-occupant Loans on < 5 Family Dwellings (A B C & D)
G) Loans On Manufactured Home Dwelling (A B C & D)
Number
Average Value
Number
Average Value
Number
Average Value
Number
Average Value
Number
Average Value
Number
Average Value
LOANS ORIGINATED
1
$45,070
12
$71,691
15
$66,304
5
$27,350
2
$53,770
5
$42,206
APPLICATIONS APPROVED, NOT ACCEPTED
1
$68,380
2
$41,805
2
$69,000
1
$50,660
0
$0
1
$43,820
APPLICATIONS DENIED
0
$0
8
$64,646
7
$58,609
4
$26,030
2
$36,210
5
$39,348
APPLICATIONS WITHDRAWN
0
$0
2
$64,180
3
$65,890
1
$47,240
0
$0
1
$70,240
FILES CLOSED FOR INCOMPLETENESS
0
$0
0
$0
1
$71,790
0
$0
0
$0
1
$55,630
Aggregated Statistics For Year 2006 (Based on 2 partial tracts)
A) FHA, FSA/RHS & VA Home Purchase Loans
B) Conventional Home Purchase Loans
C) Refinancings
D) Home Improvement Loans
F) Non-occupant Loans on < 5 Family Dwellings (A B C & D)
G) Loans On Manufactured Home Dwelling (A B C & D)
Number
Average Value
Number
Average Value
Number
Average Value
Number
Average Value
Number
Average Value
Number
Average Value
LOANS ORIGINATED
2
$60,295
7
$48,884
10
$65,019
5
$22,812
3
$38,437
4
$39,705
APPLICATIONS APPROVED, NOT ACCEPTED
0
$0
3
$61,227
1
$60,610
2
$17,560
0
$0
2
$47,395
APPLICATIONS DENIED
2
$30,460
6
$54,132
10
$52,245
7
$23,976
2
$31,855
9
$39,402
APPLICATIONS WITHDRAWN
0
$0
3
$53,043
1
$97,280
1
$55,010
0
$0
1
$33,880
FILES CLOSED FOR INCOMPLETENESS
0
$0
0
$0
1
$40,400
0
$0
0
$0
0
$0
Aggregated Statistics For Year 2005 (Based on 2 partial tracts)
A) FHA, FSA/RHS & VA Home Purchase Loans
B) Conventional Home Purchase Loans
C) Refinancings
D) Home Improvement Loans
F) Non-occupant Loans on < 5 Family Dwellings (A B C & D)
G) Loans On Manufactured Home Dwelling (A B C & D)
Number
Average Value
Number
Average Value
Number
Average Value
Number
Average Value
Number
Average Value
Number
Average Value
LOANS ORIGINATED
2
$91,065
8
$55,478
12
$60,632
8
$18,531
2
$25,485
5
$46,434
APPLICATIONS APPROVED, NOT ACCEPTED
0
$0
1
$79,250
2
$90,285
1
$12,430
0
$0
2
$45,065
APPLICATIONS DENIED
0
$0
9
$46,689
12
$84,589
6
$27,713
2
$32,635
8
$47,708
APPLICATIONS WITHDRAWN
0
$0
2
$29,680
3
$98,627
1
$95,420
0
$0
0
$0
FILES CLOSED FOR INCOMPLETENESS
0
$0
0
$0
0
$0
0
$0
0
$0
0
$0
Aggregated Statistics For Year 2004 (Based on 2 partial tracts)
B) Conventional Home Purchase Loans
C) Refinancings
D) Home Improvement Loans
F) Non-occupant Loans on < 5 Family Dwellings (A B C & D)
G) Loans On Manufactured Home Dwelling (A B C & D)
Number
Average Value
Number
Average Value
Number
Average Value
Number
Average Value
Number
Average Value
LOANS ORIGINATED
12
$61,176
19
$67,460
6
$16,938
4
$41,570
5
$41,212
APPLICATIONS APPROVED, NOT ACCEPTED
3
$68,583
6
$48,018
1
$9,950
0
$0
4
$44,988
APPLICATIONS DENIED
9
$56,980
10
$65,454
5
$16,970
1
$18,030
9
$42,649
APPLICATIONS WITHDRAWN
2
$59,050
7
$67,754
1
$28,900
1
$63,090
2
$28,125
FILES CLOSED FOR INCOMPLETENESS
0
$0
1
$95,420
0
$0
0
$0
0
$0
Aggregated Statistics For Year 2003 (Based on 2 partial tracts)
A) FHA, FSA/RHS & VA Home Purchase Loans
B) Conventional Home Purchase Loans
C) Refinancings
D) Home Improvement Loans
F) Non-occupant Loans on < 5 Family Dwellings (A B C & D)
Number
Average Value
Number
Average Value
Number
Average Value
Number
Average Value
Number
Average Value
LOANS ORIGINATED
0
$0
11
$78,378
20
$59,067
9
$15,540
2
$46,620
APPLICATIONS APPROVED, NOT ACCEPTED
0
$0
4
$72,260
3
$59,673
4
$17,715
0
$0
APPLICATIONS DENIED
1
$87,960
6
$41,698
13
$57,020
8
$18,454
1
$12,430
APPLICATIONS WITHDRAWN
0
$0
2
$58,895
3
$67,133
1
$5,280
0
$0
FILES CLOSED FOR INCOMPLETENESS
0
$0
0
$0
0
$0
0
$0
0
$0
Aggregated Statistics For Year 2002 (Based on 2 partial tracts)
A) FHA, FSA/RHS & VA Home Purchase Loans
B) Conventional Home Purchase Loans
C) Refinancings
D) Home Improvement Loans
F) Non-occupant Loans on < 5 Family Dwellings (A B C & D)
Number
Average Value
Number
Average Value
Number
Average Value
Number
Average Value
Number
Average Value
LOANS ORIGINATED
1
$77,700
6
$67,650
24
$63,131
5
$13,614
2
$52,525
APPLICATIONS APPROVED, NOT ACCEPTED
0
$0
2
$38,075
4
$81,818
1
$13,990
0
$0
APPLICATIONS DENIED
1
$32,630
6
$36,208
8
$55,634
6
$9,532
0
$0
APPLICATIONS WITHDRAWN
0
$0
1
$44,440
4
$65,422
1
$13,050
0
$0
FILES CLOSED FOR INCOMPLETENESS
0
$0
0
$0
2
$78,630
0
$0
0
$0
Aggregated Statistics For Year 2001 (Based on 2 partial tracts)
A) FHA, FSA/RHS & VA Home Purchase Loans
B) Conventional Home Purchase Loans
C) Refinancings
D) Home Improvement Loans
F) Non-occupant Loans on < 5 Family Dwellings (A B C & D)
Number
Average Value
Number
Average Value
Number
Average Value
Number
Average Value
Number
Average Value
LOANS ORIGINATED
2
$59,365
12
$57,058
16
$52,448
4
$14,298
2
$30,460
APPLICATIONS APPROVED, NOT ACCEPTED
0
$0
4
$43,745
3
$69,517
2
$12,585
0
$0
APPLICATIONS DENIED
0
$0
11
$46,903
13
$51,545
5
$5,968
1
$20,510
APPLICATIONS WITHDRAWN
1
$35,430
2
$46,775
6
$54,338
1
$9,950
1
$26,420
FILES CLOSED FOR INCOMPLETENESS
0
$0
0
$0
2
$47,710
0
$0
0
$0
Aggregated Statistics For Year 2000 (Based on 2 partial tracts)
A) FHA, FSA/RHS & VA Home Purchase Loans
B) Conventional Home Purchase Loans
C) Refinancings
D) Home Improvement Loans
F) Non-occupant Loans on < 5 Family Dwellings (A B C & D)
Number
Average Value
Number
Average Value
Number
Average Value
Number
Average Value
Number
Average Value
LOANS ORIGINATED
0
$0
10
$42,735
12
$52,655
7
$11,456
2
$63,560
APPLICATIONS APPROVED, NOT ACCEPTED
2
$37,450
7
$44,577
2
$31,855
2
$15,075
0
$0
APPLICATIONS DENIED
1
$12,740
18
$33,843
6
$47,967
5
$10,692
2
$36,055
APPLICATIONS WITHDRAWN
0
$0
2
$26,265
3
$45,273
0
$0
0
$0
FILES CLOSED FOR INCOMPLETENESS
0
$0
0
$0
1
$31,080
0
$0
0
$0
Aggregated Statistics For Year 1999 (Based on 1 partial tract)
A) FHA, FSA/RHS & VA Home Purchase Loans
B) Conventional Home Purchase Loans
C) Refinancings
D) Home Improvement Loans
F) Non-occupant Loans on < 5 Family Dwellings (A B C & D)
Detailed PMIC statistics for the following Tracts:0118.00
2002 - 2018 National Fire Incident Reporting System (NFIRS) incidents
Based on the data from the years 2002 - 2018 the average number of fires per year is 12. The highest number of reported fire incidents - 34 took place in 2007, and the least - 1 in 2002. The data has a rising trend.
When looking into fire subcategories, the most reports belonged to: Structure Fires (47.5%), and Outside Fires (32.4%).
Fire incident types reported to NFIRS in Zip Code 25039


 Nearest zip codes: 25126, 25162, 25102, 25110, 25103, 25156.


 Based on the data from the years 2002 - 2018 the average number of fires per year is 12. The highest number of reported fire incidents - 34 took place in 2007, and the least - 1 in 2002. The data has a rising trend.
 When looking into fire subcategories, the most reports belonged to: Structure Fires (47.5%), and Outside Fires (32.4%).