Estimated zip code population in 2022: 3,001 Zip code population in 2010: 2,611 Zip code population in 2000: 2,541
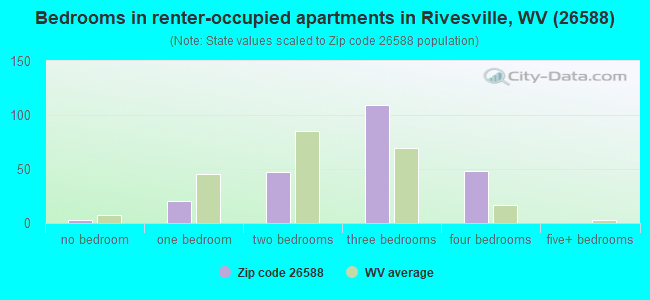
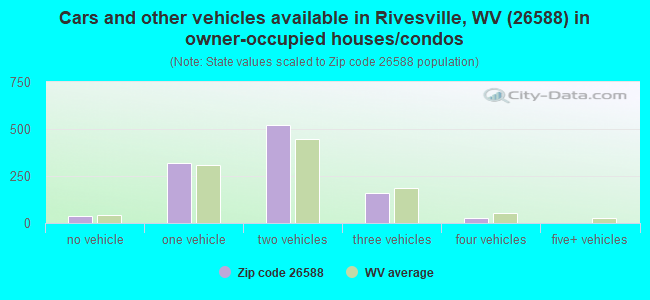
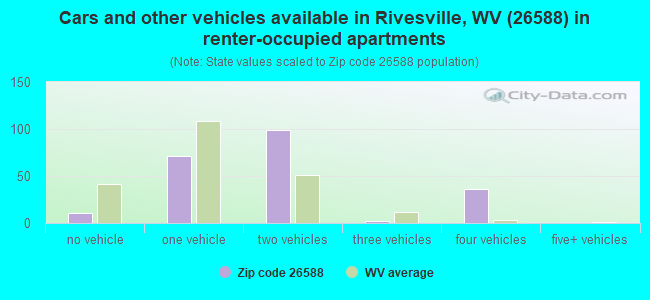
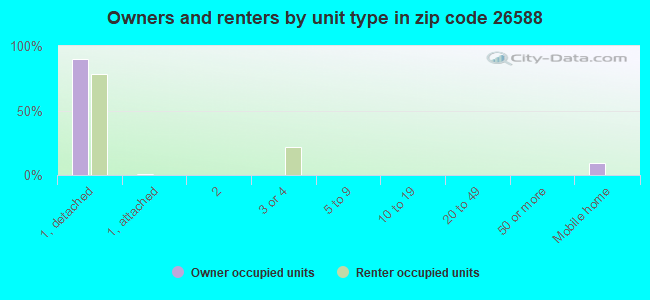
Houses and condos: 1,434 Renter-occupied apartments: 218
% of renters here:
17%
State:
26%
March 2022 cost of living index in zip code 26588: 85.2 (less than average, U.S. average is 100)
Land area: 27.5 sq. mi. Water area: 0.4 sq. mi.
Population density: 109 people per square mile
(very low).
OSM Map
General Map
Google Map
MSN Map
OSM Map
General Map
Google Map
MSN Map
OSM Map
General Map
Google Map
MSN Map
OSM Map
General Map
Google Map
MSN Map
Please wait while loading the map...
Real estate property taxes paid for housing units in 2022:
This zip code:
0.5% ($816)
West Virginia:
0.5% ($821)
Median real estate property taxes paid for housing units with mortgages in 2022: $905 (0.5%) Median real estate property taxes paid for housing units with no mortgage in 2022: $685 (0.6%)
Business Search- 14 Million verified businesses
Males: 1,459
(48.6%)
Females: 1,543
(51.4%)
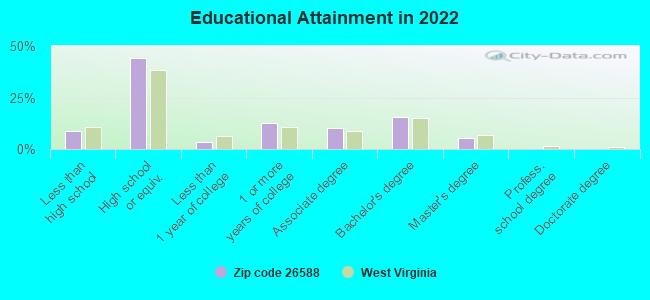
For population 25 years and over in 26588:
High school or higher: 91.3%
Bachelor's degree or higher: 20.8%
Graduate or professional degree: 5.3%
Unemployed: 6.1%
Mean travel time to work (commute): 27.5 minutes
For population 15 years and over in 26588:
Never married: 28.5%
Now married: 53.7%
Separated: 0.3%
Widowed: 6.6%
Divorced: 10.9%
Zip code 26588 compared to state average:
Black race population percentage significantly below state average.
Median age above state average.
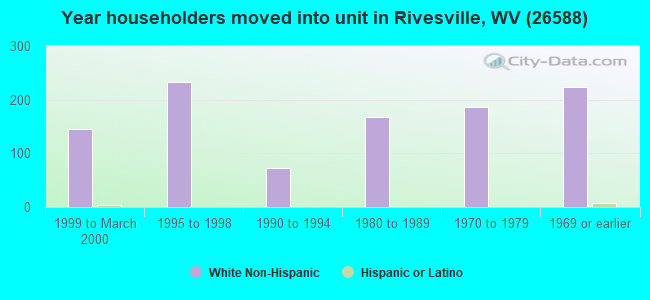
Length of stay since moving in significantly above state average.
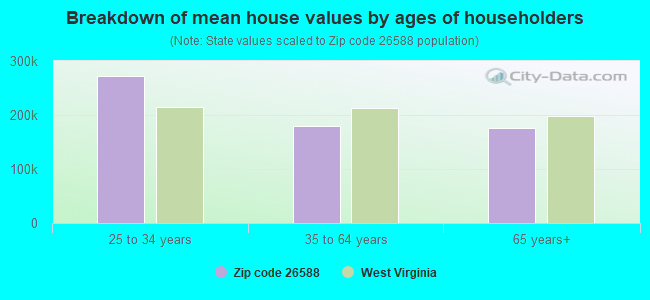
Estimated median house/condo value in 2022: $172,014
26588:
$172,014
West Virginia:
$155,100
According to our research of West Virginia and other state lists, there were 6 registered sex offenders living in 26588 zip code as of June 20, 2024. The ratio of all residents to sex offenders in zip code 26588 is 455 to 1. The ratio of registered sex offenders to all residents in this zip code is lower than the state average.
Median resident age:
This zip code:
47.5 years
West Virginia median age:
42.9 years
Average household size:
This zip code:
2.4 people
West Virginia:
2.3 people
Averages for the 2020 tax year for zip code 26588, filed in 2021:
Average Adjusted Gross Income (AGI) in 2020: $49,191 (Individual Income Tax Returns)
Here:
$49,191
State:
$56,292
Salary/wage: $46,446 (reported on 78.1% of returns)
Here:
$46,446
State:
$49,093
(% of AGI for various income ranges: 1010.6% for AGIs below $25k, 3096.2% for AGIs $25k-50k, 5901.8% for AGIs $50k-75k, 8791.0% for AGIs $75k-100k, 15297.5% for AGIs $100k-200k)
Taxable interest for individuals: $461 (reported on 24.1% of returns)
This zip code:
$461
West Virginia:
$1,141
(% of AGI for various income ranges: 12.0% for AGIs below $25k, 12.1% for AGIs $25k-50k, 22.4% for AGIs $50k-75k, 26.0% for AGIs $75k-100k, 9.2% for AGIs $100k-200k)
Ordinary dividends: $1,121 (reported on 10.2% of returns)
Here:
$1,121
State:
$5,456
(% of AGI for various income ranges: 6.3% for AGIs below $25k, 13.8% for AGIs $25k-50k, 42.4% for AGIs $50k-75k, 19.2% for AGIs $100k-200k)
Net capital gain/loss in AGI: +$1,967 (reported on 8.8% of returns)
Here:
+$1,967
State:
+$11,656
(% of AGI for various income ranges: 8.0% for AGIs below $25k, 19.0% for AGIs $25k-50k, 41.2% for AGIs $50k-75k, 69.2% for AGIs $100k-200k)
Profit/loss from business: +$7,208 (reported on 9.5% of returns)
Here:
+$7,208
State:
+$12,084
(% of AGI for various income ranges: 44.3% for AGIs below $25k, 115.9% for AGIs $25k-50k, 160.6% for AGIs $50k-75k, 144.2% for AGIs $100k-200k)
Taxable individual retirement arrangement distribution: $12,958 (reported on 8.8% of returns)
26588:
$12,958
West Virginia:
$15,311
(% of AGI for various income ranges: 41.7% for AGIs below $25k, 93.8% for AGIs $25k-50k, 257.6% for AGIs $50k-75k, 582.5% for AGIs $100k-200k)
Earned income credit: $2,123 (reported on 16.1% of returns)
Here:
$2,123
State:
$2,258
(% of AGI for various income ranges: 78.9% for AGIs below $25k, 65.9% for AGIs $25k-50k)
Percentage of individuals using paid preparers for their 2020 taxes: 92.7%
Here:
93%
State:
93%
(% for various income ranges: 93.8% for AGIs below $25k, 91.9% for AGIs $25k-50k, 90.9% for AGIs $50k-75k, 92.3% for AGIs $75k-100k, 94.1% for AGIs $100k-200k)
Averages for the 2012 tax year for zip code 26588, filed in 2013:
Average Adjusted Gross Income (AGI) in 2012: $41,591 (Individual Income Tax Returns)
Here:
$41,591
State:
$48,628
Salary/wage: $40,391 (reported on 81.1% of returns)
Here:
$40,391
State:
$42,328
(% of AGI for various income ranges: 69.0% for AGIs below $25k, 72.9% for AGIs $25k-50k, 87.2% for AGIs $50k-75k, 85.5% for AGIs $75k-100k, 76.4% for AGIs $100k-200k)
Taxable interest for individuals: $950 (reported on 23.6% of returns)
This zip code:
$950
West Virginia:
$1,211
(% of AGI for various income ranges: 0.8% for AGIs below $25k, 1.1% for AGIs $25k-50k, 0.4% for AGIs $50k-75k, 0.3% for AGIs $100k-200k)
Ordinary dividends: $1,383 (reported on 9.4% of returns)
Here:
$1,383
State:
$4,262
(% of AGI for various income ranges: 0.6% for AGIs below $25k, 0.7% for AGIs $25k-50k, 0.2% for AGIs $50k-75k, 0.2% for AGIs $100k-200k)
Net capital gain/loss in AGI: +$1,650 (reported on 6.3% of returns)
Here:
+$1,650
State:
+$8,875
(% of AGI for various income ranges: 0.9% for AGIs below $25k, 0.3% for AGIs $50k-75k, 0.3% for AGIs $100k-200k)
Profit/loss from business: +$8,700 (reported on 8.7% of returns)
Here:
+$8,700
State:
+$13,636
(% of AGI for various income ranges: 3.9% for AGIs below $25k, 3.5% for AGIs $25k-50k, 1.2% for AGIs $50k-75k, 1.4% for AGIs $75k-100k)
Taxable individual retirement arrangement distribution: $10,540 (reported on 7.9% of returns)
26588:
$10,540
West Virginia:
$11,787
(% of AGI for various income ranges: 2.0% for AGIs below $25k, 3.5% for AGIs $25k-50k, 5.5% for AGIs $75k-100k)
Total itemized deductions: $14,627 (18% of AGI, reported on 11.8% of returns)
Here:
$14,627
State:
$21,148
Here:
17.8% of AGI
State:
18.1% of AGI
(% of AGI for various income ranges: 3.4% for AGIs $25k-50k, 3.9% for AGIs $50k-75k, 4.4% for AGIs $75k-100k, 7.1% for AGIs $100k-200k)
Charity contributions: $2,557 (reported on 5.5% of returns)
Here:
$2,557
State:
$4,508
(% of AGI for various income ranges: 1.0% for AGIs $50k-75k, 0.5% for AGIs $100k-200k)
Taxes paid: $6,093 (reported on 11.8% of returns)
26588:
$6,093
State:
$8,103
(% of AGI for various income ranges: 0.8% for AGIs $25k-50k, 1.3% for AGIs $50k-75k, 1.8% for AGIs $75k-100k, 3.8% for AGIs $100k-200k)
Earned income credit: $2,000 (reported on 18.9% of returns)
Here:
$2,000
State:
$2,140
(% of AGI for various income ranges: 5.5% for AGIs below $25k, 0.9% for AGIs $25k-50k)
Percentage of individuals using paid preparers for their 2012 taxes: 48.0%
Here:
48%
State:
49%
(% for various income ranges: 44.4% for AGIs below $25k, 46.9% for AGIs $25k-50k, 45.0% for AGIs $50k-75k, 54.5% for AGIs $75k-100k, 70.0% for AGIs $100k-200k)
Averages for the 2004 tax year for zip code 26588, filed in 2005:
Average Adjusted Gross Income (AGI) in 2004: $31,240 (Individual Income Tax Returns)
Here:
$31,240
State:
$37,498
Salary/wage: $30,772 (reported on 85.3% of returns)
Here:
$30,772
State:
$33,645
(% of AGI for various income ranges: 83.4% for AGIs below $10k, 73.3% for AGIs $10k-25k, 85.0% for AGIs $25k-50k, 91.1% for AGIs $50k-75k, 94.2% for AGIs $75k-100k, 70.8% for AGIs over 100k)
Taxable interest for individuals: $1,163 (reported on 36.7% of returns)
This zip code:
$1,163
West Virginia:
$1,465
(% of AGI for various income ranges: 3.6% for AGIs below $10k, 2.6% for AGIs $10k-25k, 1.6% for AGIs $25k-50k, 1.1% for AGIs $50k-75k, 0.2% for AGIs $75k-100k, 0.3% for AGIs over 100k)
Taxable dividends: $709 (reported on 11.8% of returns)
Here:
$709
State:
$2,913
(% of AGI for various income ranges: 0.4% for AGIs below $10k, 0.7% for AGIs $10k-25k, 0.2% for AGIs $25k-50k, 0.1% for AGIs $50k-75k, 0.1% for AGIs $75k-100k, 0.2% for AGIs over 100k)
Net capital gain/loss: +$1,264 (reported on 7.3% of returns)
Here:
+$1,264
State:
+$6,331
(% of AGI for various income ranges: 0.1% for AGIs $10k-25k, 0.2% for AGIs $25k-50k, -0.0% for AGIs $50k-75k, -0.2% for AGIs $75k-100k, 2.2% for AGIs over 100k)
Profit/loss from business: +$5,516 (reported on 9.7% of returns)
Here:
+$5,516
State:
+$11,074
(% of AGI for various income ranges: 5.8% for AGIs below $10k, 4.7% for AGIs $10k-25k, 1.8% for AGIs $25k-50k, 0.2% for AGIs $50k-75k, 1.0% for AGIs $75k-100k)
IRA payment deduction: $2,552 (reported on 2.3% of returns)
26588:
$2,552
West Virginia:
$2,796
Total itemized deductions: $12,602 (18% of AGI, reported on 9.0% of returns)
Here:
$12,602
State:
$16,976
Here:
18.5% of AGI
State:
19.0% of AGI
(% of AGI for various income ranges: 3.1% for AGIs $10k-25k, 2.1% for AGIs $25k-50k, 4.2% for AGIs $50k-75k, 5.2% for AGIs $75k-100k, 5.8% for AGIs over 100k)
Charity contributions deductions: $2,050 (3% of AGI, reported on 6.4% of returns)
Here:
$2,050
State:
$3,529
Here:
3.0% of AGI
State:
3.7% of AGI
(% of AGI for various income ranges: 0.3% for AGIs $25k-50k, 0.7% for AGIs $50k-75k, 0.7% for AGIs $75k-100k, 0.3% for AGIs over 100k)
Total tax: $3,540 (reported on 71.3% of returns)
26588:
$3,540
State:
$5,372
(% of AGI for various income ranges: 1.5% for AGIs below $10k, 3.8% for AGIs $10k-25k, 6.1% for AGIs $25k-50k, 8.9% for AGIs $50k-75k, 11.0% for AGIs $75k-100k, 15.8% for AGIs over 100k)
Earned income credit: $1,586 (reported on 19.4% of returns)
Here:
$1,586
State:
$1,662
Percentage of individuals using paid preparers for their 2004 taxes: 53.4%
Here:
53%
State:
55%
(% for various income ranges: 39.4% for AGIs below $10k, 53.5% for AGIs $10k-25k, 57.5% for AGIs $25k-50k, 61.3% for AGIs $50k-75k, 59.4% for AGIs $75k-100k, 78.9% for AGIs over 100k)
Household received Food Stamps/SNAP in the past 12 months: 276 Household did not receive Food Stamps/SNAP in the past 12 months: 1,002
Women who had a birth in the past 12 months: 2 (0 now married, 1 unmarried) Women who did not have a birth in the past 12 months: 575 (246 now married, 329 unmarried)
Housing units in zip code 26588 with a mortgage: 579 Houses without a mortgage: 5
Median monthly owner costs for units with a mortgage: $1,037 Median monthly owner costs for units without a mortgage: $372
Residents with income below the poverty level in 2022:
This zip code:
9.9%
Whole state:
17.9%
Residents with income below 50% of the poverty level in 2022:
This zip code:
8.0%
Whole state:
9.7%
Median number of rooms in houses and condos:
Here:
6.1
State:
6.5
Median number of rooms in apartments:
Here:
5.0
State:
4.7
Notable locations in this zip code not listed on our city pages
Notable locations in zip code 26588: Rivesville Volunteer Fire Department (A), Rivesville City Hall (B), Baxter Volunteer Fire Department (C). Display/hide their locations on the map
Churches in zip code 26588 include: Marvin Chapel (A), Highlawn United Methodist Church (B), Free United Methodist Church (C), Rivesville United Methodist Church (D), Baxter United Methodist Church (E), Morgan Chapel (F), Morganland Chapel (G). Display/hide their locations on the map
Cemeteries: McCurdysville Cemetery (1), Hood Cemetery (2), Hawkinberry Cemetery (3), Ministers Cemetery (4), Hoodsville Cemetery (5), Barb Cemetery (6), Tennant Cemetery (7). Display/hide their locations on the map
Streams, rivers, and creeks: Stewart Run (A), Shuman Run (B), Robinson Run (C), Pharaoh Run (D), Paw Paw Creek (E), Parker Run (F), Panther Lick Run (G), Ministers Run (H), Lewis Run (I). Display/hide their locations on the map
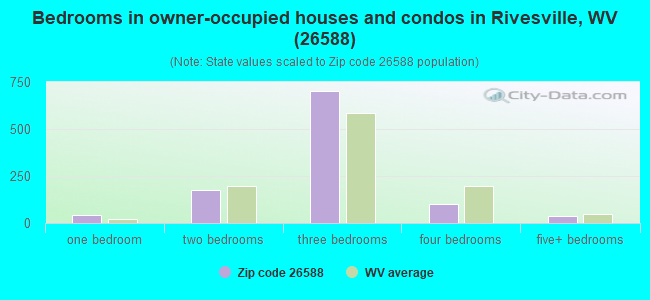
Size of family households: 399 2-persons, 341 3-persons, 155 4-persons, 36 6-persons
Size of nonfamily households: 280 1-person, 46 2-persons, 24 3-persons
360 married couples with children.
24 single-parent households (17 men, 7 women).
97.6% of residents of 26588 zip code speak English at home.
1.1% of residents speak other Indo-European language at home (100% very well).
0.2% of residents speak Asian or Pacific Island language at home (100% well).
0.6% of residents speak other language at home (100% very well).
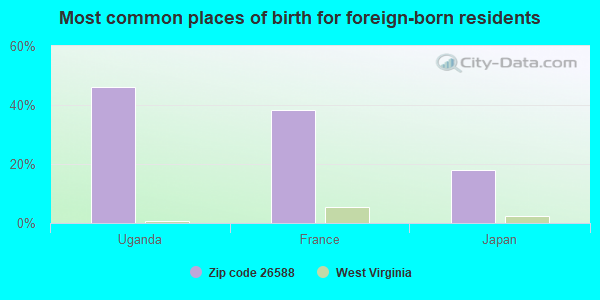
Foreign born population: 43 (1.4%) (54.1% of them are naturalized citizens)
This zip code:
1.4%
Whole state:
1.8%
46%Uganda
38%France
18%Japan
26%English
23%German
18%Irish
10%American
8%Italian
3%Scotch-Irish
2%Polish
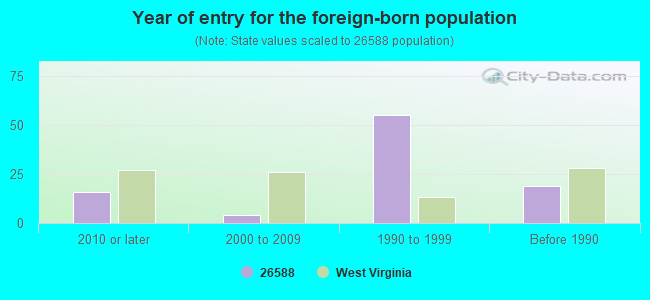
Year of entry for the foreign-born population
162010 or later
42000 to 2009
551990 to 1999
19Before 1990
Facilities with environmental interests located in this zip code:
BL & S COAL (1.5 MI E OF RIVESVILLE, OFF RTE 1913 in RIVESVILLE, WV)
ENFORCEMENT/COMPLIANCE ACTIVITY (Integrated Compliance Information System) - ICIS-03-2000-0046, FORMAL ENFORCEMENT ACTION (Integrated Compliance Information System) - ICIS-03-2000-0046, FORMAL ENFORCEMENT ACTION Business SIC classification: BITUMINOUS COAL AND LIGNITE SURFACE MINING; COAL MINING SERVICES
BERRYS TRUCKING (RTE 19 NO & 1ST ST SO CORNER in RIVESVILLE, WV)
(Resource Conservation and Recovery Act (tracking hazardous waste)) Organizations: ROBERT BERRY (CONTACT/OWNER)
BOBS AUTO RPR (1/8 MI UP HAWKINBERRY HOLLOW in RIVESVILLE, WV)
(Resource Conservation and Recovery Act (tracking hazardous waste)) Organizations: ROBERT MANNING (CONTACT/OWNER)
Housing units lacking complete plumbing facilities: 2.1% Housing units lacking complete kitchen facilities: 2.0%
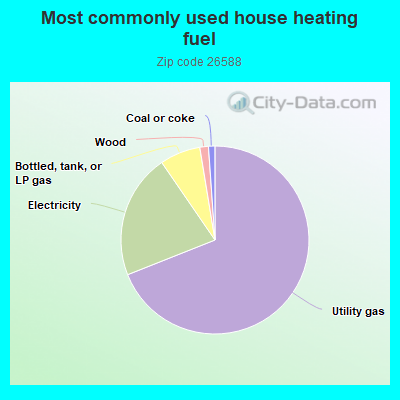
69.2%Utility gas
21.5%Electricity
7.0%Bottled, tank, or LP gas
1.5%Wood
1.1%Coal or coke
Population in 1990: 2,938.
Place of birth for U.S.-born residents:
This state: 2,248
Northeast: 116
Midwest: 247
South: 184
West: 81
68% of the 26588 zip code residents lived in the same house 5 years ago. Out of people who lived in different houses, 61% lived in this county. Out of people who lived in different counties, 50% lived in West Virginia.
99% of the 26588 zip code residents lived in the same house 1 year ago. Out of people who lived in different houses, 117% moved from this county. Out of people who lived in different houses, 4% moved from different county within same state.
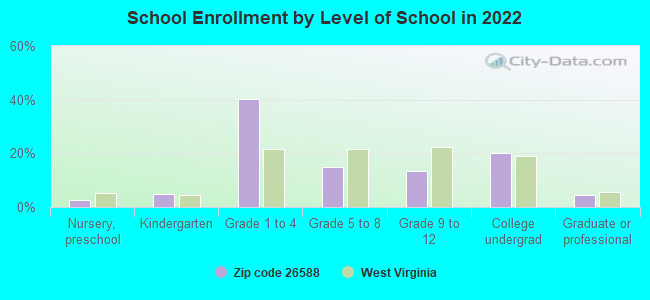
Private vs. public school enrollment:
Students in private schools in grades 1 to 8 (elementary and middle school): 25
Here:
8.9%
West Virginia:
12.2%
Students in private schools in grades 9 to 12 (high school):
Here:
0.0%
West Virginia:
8.8%
Students in private undergraduate colleges:
Here:
0.0%
West Virginia:
17.3%
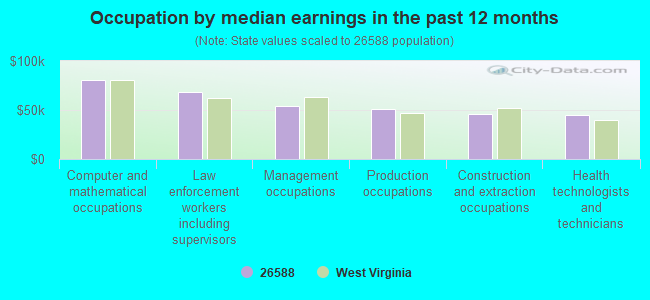
Occupation by median earnings in the past 12 months ($)
80,938Computer and mathematical occupations
68,567Law enforcement workers including supervisors
54,171Management occupations
50,765Production occupations
45,506Construction and extraction occupations
44,499Health technologists and technicians
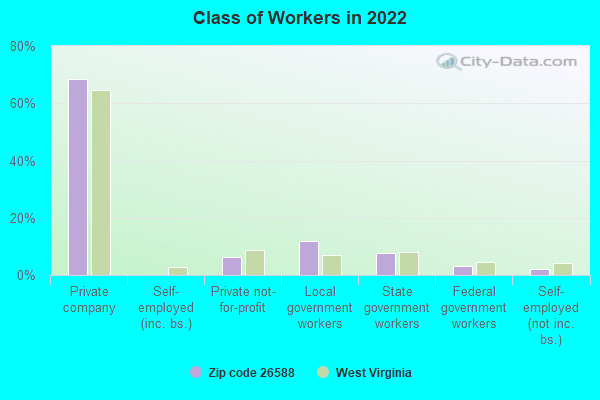
Top industries in this zip code by the number of employees in 2005:
Utilities: Fossil Fuel Electric Power Generation (20-49 employees: 1 establishment)
Construction: Electrical Contractors (10-19: 1)
Other Services (except Public Administration): Religious Organizations (1-4: 5)
Construction: Site Preparation Contractors (1-4: 2)
Administrative and Support and Waste Management and Remediation Services: Private Mail Centers (1-4: 1)
Construction: Plumbing, Heating, and Air-Conditioning Contractors (1-4: 1)
2003 - 2018 National Fire Incident Reporting System (NFIRS) incidents
According to the data from the years 2003 - 2018 the average number of fire incidents per year is 18. The highest number of fire incidents - 44 took place in 2009, and the least - 5 in 2012. The data has a decreasing trend.
When looking into fire subcategories, the most incidents belonged to: Structure Fires (58.2%), and Outside Fires (28.4%).
Fire incident types reported to NFIRS in Zip Code 26588


 Nearest zip codes: 26560, 26574, 26586, 26559, 26570, 26541.
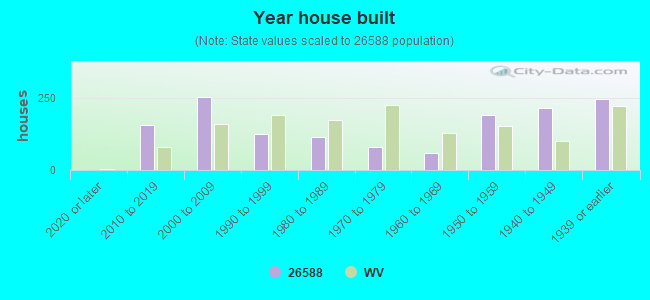


 According to the data from the years 2003 - 2018 the average number of fire incidents per year is 18. The highest number of fire incidents - 44 took place in 2009, and the least - 5 in 2012. The data has a decreasing trend.
 When looking into fire subcategories, the most incidents belonged to: Structure Fires (58.2%), and Outside Fires (28.4%).