Estimated zip code population in 2022: 3,848 Zip code population in 2010: 3,402 Zip code population in 2000: 3,831
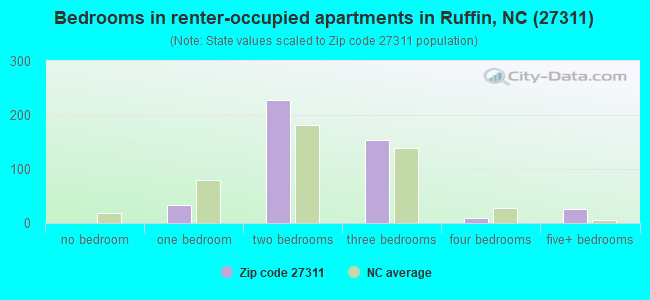
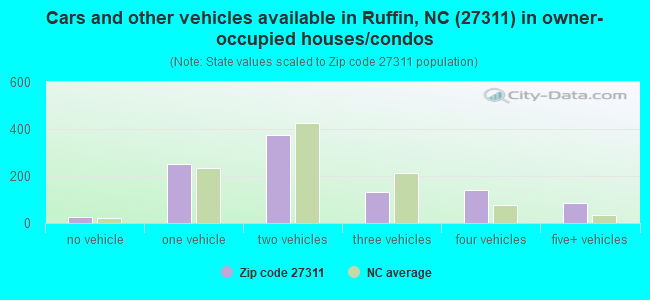
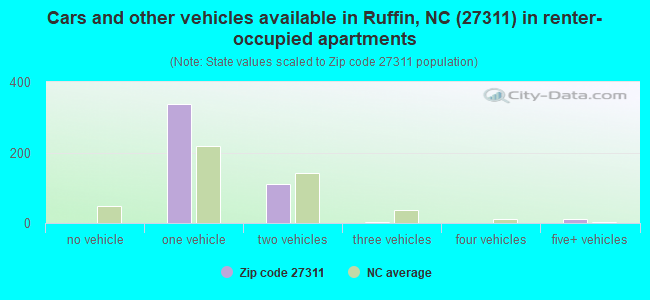
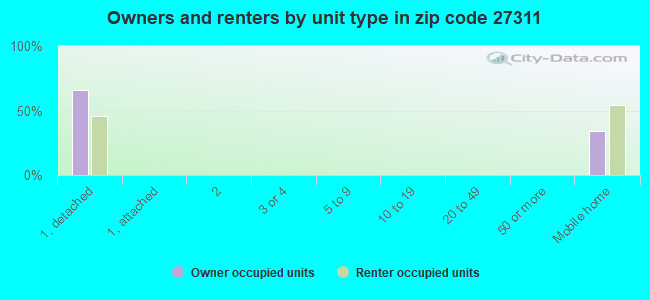
Houses and condos: 1,725 Renter-occupied apartments: 455
% of renters here:
31%
State:
33%
March 2022 cost of living index in zip code 27311: 79.4 (low, U.S. average is 100)
Land area: 46.2 sq. mi. Water area: 0.1 sq. mi.
Population density: 83 people per square mile
(very low).
OSM Map
General Map
Google Map
MSN Map
OSM Map
General Map
Google Map
MSN Map
OSM Map
General Map
Google Map
MSN Map
OSM Map
General Map
Google Map
MSN Map
Please wait while loading the map...
Real estate property taxes paid for housing units in 2022:
This zip code:
0.7% ($831)
North Carolina:
0.6% ($1,769)
Median real estate property taxes paid for housing units with mortgages in 2022: $870 (0.7%) Median real estate property taxes paid for housing units with no mortgage in 2022: $748 (0.6%)
Business Search- 14 Million verified businesses
Males: 2,003
(52.1%)
Females: 1,843
(47.9%)
For population 25 years and over in 27311:
High school or higher: 79.3%
Bachelor's degree or higher: 7.4%
Graduate or professional degree: 2.4%
Unemployed: 4.1%
Mean travel time to work (commute): 37.5 minutes
For population 15 years and over in 27311:
Never married: 25.9%
Now married: 54.3%
Separated: 3.0%
Widowed: 6.1%
Divorced: 10.7%
Zip code 27311 compared to state average:
Median household income below state average.
Median house value below state average.
Length of stay since moving in significantly above state average.
Percentage of population with a bachelor's degree or higher significantly below state average.
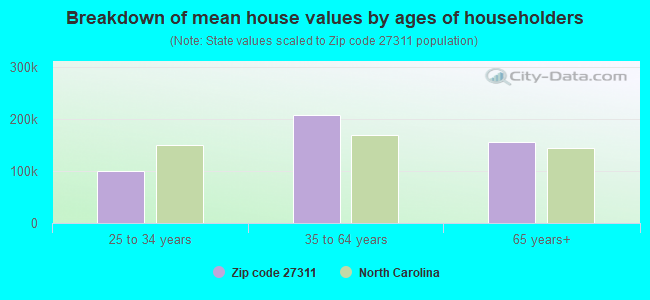
Estimated median house/condo value in 2022: $125,308
27311:
$125,308
North Carolina:
$280,600
According to our research of North Carolina and other state lists, there were 9 registered sex offenders living in 27311 zip code as of June 16, 2024. The ratio of all residents to sex offenders in zip code 27311 is 409 to 1. The ratio of registered sex offenders to all residents in this zip code is near the state average.
Median resident age:
This zip code:
41.9 years
North Carolina median age:
39.2 years
Average household size:
This zip code:
2.6 people
North Carolina:
2.4 people
Averages for the 2020 tax year for zip code 27311, filed in 2021:
Average Adjusted Gross Income (AGI) in 2020: $41,288 (Individual Income Tax Returns)
Here:
$41,288
State:
$70,020
Salary/wage: $38,825 (reported on 81.8% of returns)
Here:
$38,825
State:
$58,387
(% of AGI for various income ranges: 1139.8% for AGIs below $25k, 3690.0% for AGIs $25k-50k, 6926.9% for AGIs $50k-75k, 8815.0% for AGIs $75k-100k, 16340.0% for AGIs $100k-200k)
Taxable interest for individuals: $524 (reported on 23.1% of returns)
This zip code:
$524
North Carolina:
$1,479
(% of AGI for various income ranges: 5.5% for AGIs below $25k, 13.1% for AGIs $25k-50k, 7.7% for AGIs $50k-75k, 65.0% for AGIs $75k-100k, 58.6% for AGIs $100k-200k)
Ordinary dividends: $1,831 (reported on 9.1% of returns)
Here:
$1,831
State:
$7,888
(% of AGI for various income ranges: 9.8% for AGIs below $25k, 17.1% for AGIs $25k-50k, 123.8% for AGIs $75k-100k, 51.4% for AGIs $100k-200k)
Net capital gain/loss in AGI: +$1,660 (reported on 7.0% of returns)
Here:
+$1,660
State:
+$23,652
(% of AGI for various income ranges: 26.0% for AGIs $25k-50k, 30.8% for AGIs $50k-75k, 50.0% for AGIs $100k-200k)
Profit/loss from business: +$7,579 (reported on 13.3% of returns)
Here:
+$7,579
State:
+$11,710
(% of AGI for various income ranges: 114.8% for AGIs below $25k, 93.4% for AGIs $25k-50k, 163.8% for AGIs $50k-75k, 493.8% for AGIs $75k-100k)
Taxable individual retirement arrangement distribution: $13,483 (reported on 8.4% of returns)
27311:
$13,483
North Carolina:
$20,247
(% of AGI for various income ranges: 50.5% for AGIs below $25k, 161.4% for AGIs $25k-50k, 1038.8% for AGIs $75k-100k)
Total itemized deductions: $25,717 (reported on 4.2% of returns)
Here:
$25,717
State:
$34,549
(% of AGI for various income ranges: 683.1% for AGIs $50k-75k, 935.7% for AGIs $100k-200k)
Charity contributions: $10,625 (reported on 2.8% of returns)
Here:
$10,625
State:
$13,360
(% of AGI for various income ranges: 50.9% for AGIs below $25k, 251.3% for AGIs $75k-100k)
Taxes paid: $6,240 (reported on 3.5% of returns)
27311:
$6,240
State:
$7,586
(% of AGI for various income ranges: 99.2% for AGIs $50k-75k, 261.4% for AGIs $100k-200k)
Earned income credit: $2,359 (reported on 23.8% of returns)
Here:
$2,359
State:
$2,337
(% of AGI for various income ranges: 111.4% for AGIs below $25k, 89.1% for AGIs $25k-50k)
Percentage of individuals using paid preparers for their 2020 taxes: 93.0%
Here:
93%
State:
93%
(% for various income ranges: 94.7% for AGIs below $25k, 93.2% for AGIs $25k-50k, 89.5% for AGIs $50k-75k, 91.7% for AGIs $75k-100k, 90.9% for AGIs $100k-200k)
Averages for the 2012 tax year for zip code 27311, filed in 2013:
Average Adjusted Gross Income (AGI) in 2012: $34,953 (Individual Income Tax Returns)
Here:
$34,953
State:
$54,937
Salary/wage: $32,153 (reported on 85.8% of returns)
Here:
$32,153
State:
$46,336
(% of AGI for various income ranges: 73.3% for AGIs below $25k, 85.5% for AGIs $25k-50k, 79.7% for AGIs $50k-75k, 75.2% for AGIs $75k-100k, 76.4% for AGIs $100k-200k)
Taxable interest for individuals: $679 (reported on 23.4% of returns)
This zip code:
$679
North Carolina:
$1,298
(% of AGI for various income ranges: 0.9% for AGIs below $25k, 0.3% for AGIs $25k-50k, 0.3% for AGIs $50k-75k, 0.7% for AGIs $75k-100k, 0.3% for AGIs $100k-200k)
Ordinary dividends: $1,367 (reported on 8.5% of returns)
Here:
$1,367
State:
$6,213
(% of AGI for various income ranges: 0.4% for AGIs below $25k, 0.3% for AGIs $25k-50k, 0.1% for AGIs $50k-75k, 0.9% for AGIs $75k-100k)
Net capital gain/loss in AGI: +$1,300 (reported on 6.4% of returns)
Here:
+$1,300
State:
+$12,740
(% of AGI for various income ranges: 0.3% for AGIs below $25k, 1.2% for AGIs $75k-100k)
Profit/loss from business: +$6,612 (reported on 12.1% of returns)
Here:
+$6,612
State:
+$10,311
(% of AGI for various income ranges: 7.2% for AGIs below $25k, 0.9% for AGIs $25k-50k, 3.2% for AGIs $50k-75k)
Taxable individual retirement arrangement distribution: $9,100 (reported on 7.8% of returns)
27311:
$9,100
North Carolina:
$15,575
(% of AGI for various income ranges: 1.9% for AGIs below $25k, 3.6% for AGIs $25k-50k, 4.4% for AGIs $75k-100k)
Total itemized deductions: $16,452 (25% of AGI, reported on 19.1% of returns)
Here:
$16,452
State:
$23,438
Here:
25.3% of AGI
State:
21.5% of AGI
(% of AGI for various income ranges: 5.2% for AGIs below $25k, 7.3% for AGIs $25k-50k, 9.7% for AGIs $50k-75k, 9.5% for AGIs $75k-100k, 14.8% for AGIs $100k-200k)
Charity contributions: $3,495 (reported on 14.9% of returns)
Here:
$3,495
State:
$4,687
(% of AGI for various income ranges: 0.8% for AGIs below $25k, 1.3% for AGIs $25k-50k, 1.4% for AGIs $50k-75k, 2.1% for AGIs $75k-100k, 2.3% for AGIs $100k-200k)
Taxes paid: $4,946 (reported on 18.4% of returns)
27311:
$4,946
State:
$8,823
(% of AGI for various income ranges: 0.6% for AGIs below $25k, 1.5% for AGIs $25k-50k, 2.6% for AGIs $50k-75k, 3.3% for AGIs $75k-100k, 6.1% for AGIs $100k-200k)
Earned income credit: $2,307 (reported on 31.9% of returns)
Here:
$2,307
State:
$2,376
(% of AGI for various income ranges: 9.2% for AGIs below $25k, 1.4% for AGIs $25k-50k)
Percentage of individuals using paid preparers for their 2012 taxes: 57.4%
Here:
57%
State:
53%
(% for various income ranges: 52.9% for AGIs below $25k, 57.5% for AGIs $25k-50k, 58.8% for AGIs $50k-75k, 75.0% for AGIs $75k-100k, 83.3% for AGIs $100k-200k)
Averages for the 2004 tax year for zip code 27311, filed in 2005:
Average Adjusted Gross Income (AGI) in 2004: $30,376 (Individual Income Tax Returns)
Here:
$30,376
State:
$45,376
Salary/wage: $28,506 (reported on 89.8% of returns)
Here:
$28,506
State:
$39,442
(% of AGI for various income ranges: 96.6% for AGIs below $10k, 80.4% for AGIs $10k-25k, 87.7% for AGIs $25k-50k, 85.6% for AGIs $50k-75k, 89.9% for AGIs $75k-100k, 65.0% for AGIs over 100k)
Taxable interest for individuals: $694 (reported on 27.9% of returns)
This zip code:
$694
North Carolina:
$1,515
(% of AGI for various income ranges: 2.4% for AGIs below $10k, 0.9% for AGIs $10k-25k, 0.7% for AGIs $25k-50k, 0.6% for AGIs $50k-75k, 0.2% for AGIs $75k-100k, 0.1% for AGIs over 100k)
Taxable dividends: $1,029 (reported on 9.4% of returns)
Here:
$1,029
State:
$4,016
(% of AGI for various income ranges: 0.4% for AGIs below $10k, 0.3% for AGIs $10k-25k, 0.1% for AGIs $25k-50k, 0.6% for AGIs $50k-75k, 0.4% for AGIs $75k-100k)
Net capital gain/loss: +$214 (reported on 5.7% of returns)
Here:
+$214
State:
+$11,152
(% of AGI for various income ranges: -1.2% for AGIs below $10k, 0.1% for AGIs $10k-25k, 0.0% for AGIs $25k-50k, 0.4% for AGIs $50k-75k, -0.4% for AGIs $75k-100k)
Profit/loss from business: +$3,321 (reported on 10.8% of returns)
Here:
+$3,321
State:
+$9,490
(% of AGI for various income ranges: -2.5% for AGIs below $10k, 2.4% for AGIs $10k-25k, 1.9% for AGIs $25k-50k, 0.7% for AGIs $50k-75k, 0.4% for AGIs $75k-100k)
IRA payment deduction: $3,158 (reported on 1.3% of returns)
27311:
$3,158
North Carolina:
$2,967
Total itemized deductions: $14,635 (25% of AGI, reported on 21.0% of returns)
Here:
$14,635
State:
$19,464
Here:
25.0% of AGI
State:
22.7% of AGI
(% of AGI for various income ranges: 5.8% for AGIs $10k-25k, 9.8% for AGIs $25k-50k, 10.2% for AGIs $50k-75k, 15.2% for AGIs $75k-100k, 16.7% for AGIs over 100k)
Charity contributions deductions: $3,398 (6% of AGI, reported on 17.6% of returns)
Here:
$3,398
State:
$4,035
Here:
5.6% of AGI
State:
4.5% of AGI
(% of AGI for various income ranges: 1.0% for AGIs $10k-25k, 1.7% for AGIs $25k-50k, 1.9% for AGIs $50k-75k, 3.1% for AGIs $75k-100k, 4.1% for AGIs over 100k)
Total tax: $3,370 (reported on 67.0% of returns)
27311:
$3,370
State:
$7,257
(% of AGI for various income ranges: 1.6% for AGIs below $10k, 3.2% for AGIs $10k-25k, 5.9% for AGIs $25k-50k, 8.6% for AGIs $50k-75k, 10.3% for AGIs $75k-100k, 16.5% for AGIs over 100k)
Earned income credit: $1,883 (reported on 26.2% of returns)
Here:
$1,883
State:
$1,851
Percentage of individuals using paid preparers for their 2004 taxes: 69.1%
Here:
69%
State:
62%
(% for various income ranges: 64.6% for AGIs below $10k, 69.2% for AGIs $10k-25k, 66.8% for AGIs $25k-50k, 80.0% for AGIs $50k-75k, 73.1% for AGIs $75k-100k, 67.9% for AGIs over 100k)
Likely homosexual households (counted as self-reported same-sex unmarried-partner households)
Lesbian couples: 0.0% of all households
Gay men: 2.5% of all households
Household received Food Stamps/SNAP in the past 12 months: 366 Household did not receive Food Stamps/SNAP in the past 12 months: 1,111
Women who had a birth in the past 12 months: 21 (22 now married, 0 unmarried) Women who did not have a birth in the past 12 months: 661 (235 now married, 425 unmarried)
Housing units in zip code 27311 with a mortgage: 433 (21 second mortgage, 22 both second mortgage and home equity loan) Median monthly owner costs for units with a mortgage: $833 Median monthly owner costs for units without a mortgage: $302
Residents with income below the poverty level in 2022:
This zip code:
26.8%
Whole state:
12.8%
Residents with income below 50% of the poverty level in 2022:
This zip code:
19.1%
Whole state:
6.8%
Median number of rooms in houses and condos:
Here:
5.7
State:
6.4
Median number of rooms in apartments:
Here:
4.6
State:
4.4
Notable locations in this zip code not listed on our city pages
Churches in zip code 27311 include: Gwynns Chapel (A), Hickory Grove United Methodist Church (B), True Gospel Church (C), Lively Stones Baptist Church (D), Bluestone Baptist Church (E), Mineral Spring Church (F), Wolf Island Church (G). Display/hide their locations on the map
Streams, rivers, and creeks: Wolf Island Creek (A), Williamson Creek (B), Whalebone Branch (C), Tardy Branch (D), Pumphouse Branch (E). Display/hide their locations on the map
In group quarters: 5 (-1 institutionalized population)
Size of family households: 524 2-persons, 311 3-persons, 133 4-persons, 52 5-persons, 42 6-persons
Size of nonfamily households: 257 1-person, 65 2-persons, 68 4-persons
319 married couples with children.
362 single-parent households (100 men, 262 women).
86.1% of residents of 27311 zip code speak English at home.
13.3% of residents speak Spanish at home (35% very well, 20% well, 22% not well, 23% not at all).
0.8% of residents speak Asian or Pacific Island language at home (100% well).
Foreign born population: 276 (7.2%) (2.0% of them are naturalized citizens)
This zip code:
7.2%
Whole state:
8.6%
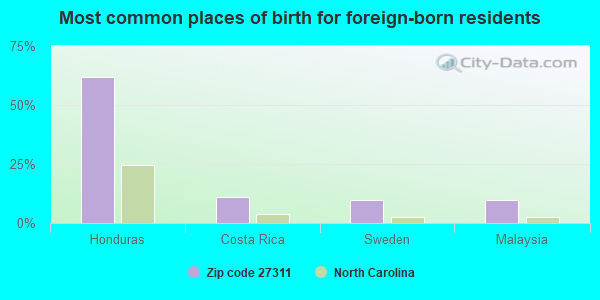
62%Honduras
11%Costa Rica
10%Sweden
10%Malaysia
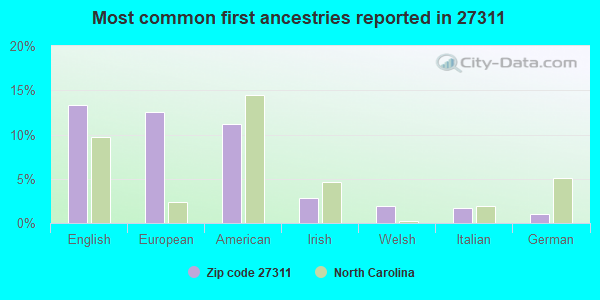
13%English
13%European
11%American
3%Irish
2%Welsh
2%Italian
1%German
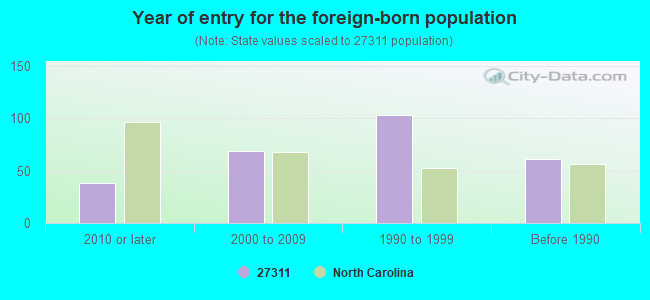
Year of entry for the foreign-born population
382010 or later
692000 to 2009
1031990 to 1999
61Before 1990
Facilities with environmental interests located in this zip code:
APAC VIRGINIA PELHAM PLANT (1675 ROCK QUARRY ROAD in PELHAM, NC)
AIR SYNTHETIC MINOR (AIRS/AFS) STATE MASTER (North Carolina facility info) - -115DA4YG00M29W84AX3Y0DAEPU, WASTEWATER FACILITY, -3713, AIR PROGRAM CRITERIA AND HAZARDOUS AIR POLLUTANT INVENTORY (Inventory of air pollution sources) National Pollutant Discharge Elimination System NON-MAJOR (Tracking pollutant discharge elimination systems) - permit Business SIC classification: ASPHALT PAVING MIXTURES AND BLOCKS Business NAICS classification: ASPHALT PAVING MIXTURE AND BLOCK MANUFACTURING.; ASPHALT PAVING MIXTURE AND BLOCK MANUFACTURING. Alternative names: APAC ATLANTIC INC THOMPSON ART, APAC ATLANTIC INCORPORATED - THOMPSON-ARTHUR DIVISION, APAC VA, INC.-DANVILLE DIVISIO
Housing units lacking complete plumbing facilities: 7.6% Housing units lacking complete kitchen facilities: 7.9%
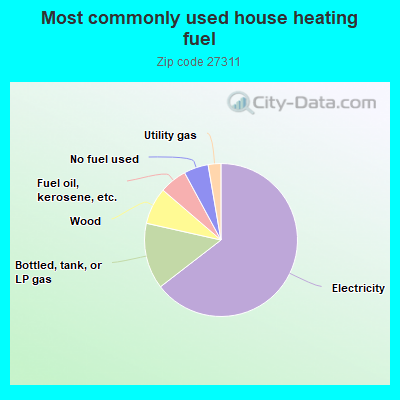
64.6%Electricity
14.0%Bottled, tank, or LP gas
7.8%Wood
5.8%Fuel oil, kerosene, etc.
5.2%No fuel used
2.7%Utility gas
Population in 1990: 3,964.
Place of birth for U.S.-born residents:
This state: 1,865
Northeast: 64
Midwest: 116
South: 1,500
West: 15
73% of the 27311 zip code residents lived in the same house 5 years ago. Out of people who lived in different houses, 46% lived in this county. Out of people who lived in different counties, 50% lived in North Carolina.
93% of the 27311 zip code residents lived in the same house 1 year ago. Out of people who lived in different houses, 80% moved from this county. Out of people who lived in different houses, 15% moved from different county within same state.
Private vs. public school enrollment:
Students in private schools in grades 1 to 8 (elementary and middle school): 269
Here:
36.1%
North Carolina:
13.8%
Students in private schools in grades 9 to 12 (high school): 20
Here:
16.5%
North Carolina:
11.9%
Students in private undergraduate colleges: 9
Here:
5.2%
North Carolina:
19.3%
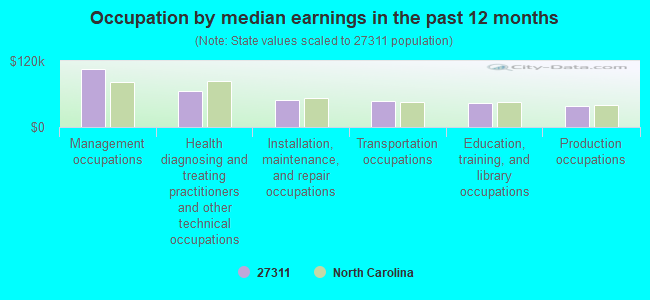
Occupation by median earnings in the past 12 months ($)
105,435Management occupations
65,894Health diagnosing and treating practitioners and other technical occupations
48,409Installation, maintenance, and repair occupations
47,735Transportation occupations
44,344Education, training, and library occupations
38,039Production occupations
Top industries in this zip code by the number of employees in 2005:
Mining: Crushed and Broken Granite Mining and Quarrying (20-49 employees: 1 establishment)
Health Care and Social Assistance: Child Day Care Services (10-19: 2)
Other Services (except Public Administration): Religious Organizations (5-9: 3, 1-4: 2)
Administrative and Support and Waste Management and Remediation Services: Convention and Visitors Bureaus (10-19: 1)
Construction: Drywall and Insulation Contractors (5-9: 1)
Construction: Poured Concrete Foundation and Structure Contractors (5-9: 1)
People in group quarters in 2010:
5 people in group homes intended for adults
Fatal accident statistics in 2014:
Fatal accident count: 2
Vehicles involved in fatal accidents: 2
Fatal accidents caused by drunken drivers: 2
Fatalities: 2
Persons involved in fatal accidents: 2
Pedestrians involved in fatal accidents: 0
Fatal accident statistics in 2013:
Fatal accident count: 1
Vehicles involved in fatal accidents: 1
Fatal accidents caused by drunken drivers: 1
Fatalities: 1
Persons involved in fatal accidents: 1
Pedestrians involved in fatal accidents: 0
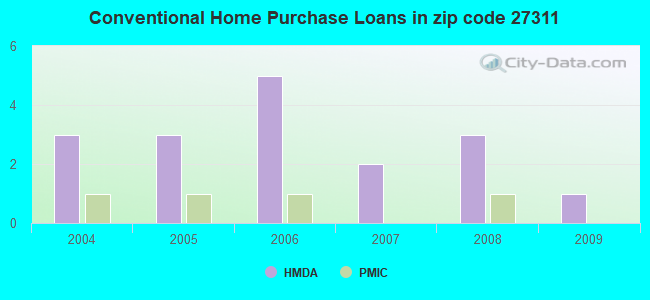
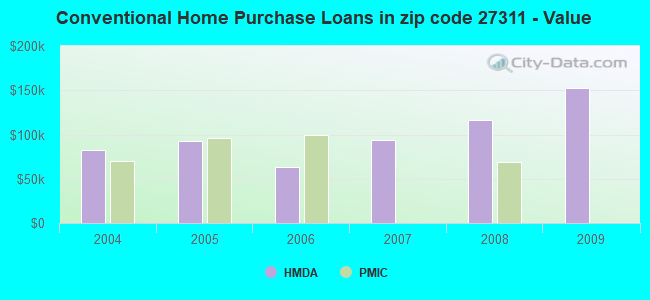
Home Mortgage Disclosure Act Aggregated Statistics For Year 2009 (Based on 2 partial tracts)
A) FHA, FSA/RHS & VA Home Purchase Loans
B) Conventional Home Purchase Loans
C) Refinancings
D) Home Improvement Loans
F) Non-occupant Loans on < 5 Family Dwellings (A B C & D)
G) Loans On Manufactured Home Dwelling (A B C & D)
Number
Average Value
Number
Average Value
Number
Average Value
Number
Average Value
Number
Average Value
Number
Average Value
LOANS ORIGINATED
1
$159,770
1
$152,650
7
$133,926
1
$27,220
1
$62,400
1
$113,910
APPLICATIONS APPROVED, NOT ACCEPTED
0
$0
0
$0
1
$97,160
0
$0
0
$0
0
$0
APPLICATIONS DENIED
0
$0
1
$70,990
4
$120,668
1
$56,330
0
$0
1
$79,990
APPLICATIONS WITHDRAWN
0
$0
0
$0
2
$104,805
0
$0
0
$0
0
$0
FILES CLOSED FOR INCOMPLETENESS
0
$0
0
$0
0
$0
0
$0
0
$0
0
$0
Aggregated Statistics For Year 2008 (Based on 2 partial tracts)
A) FHA, FSA/RHS & VA Home Purchase Loans
B) Conventional Home Purchase Loans
C) Refinancings
D) Home Improvement Loans
F) Non-occupant Loans on < 5 Family Dwellings (A B C & D)
G) Loans On Manufactured Home Dwelling (A B C & D)
Number
Average Value
Number
Average Value
Number
Average Value
Number
Average Value
Number
Average Value
Number
Average Value
LOANS ORIGINATED
3
$69,173
3
$116,427
7
$115,829
0
$0
2
$88,785
2
$90,040
APPLICATIONS APPROVED, NOT ACCEPTED
0
$0
0
$0
1
$140,720
0
$0
0
$0
0
$0
APPLICATIONS DENIED
1
$69,940
1
$148,670
6
$87,633
2
$21,570
1
$53,400
2
$65,855
APPLICATIONS WITHDRAWN
0
$0
1
$134,020
2
$106,270
0
$0
0
$0
1
$63,030
FILES CLOSED FOR INCOMPLETENESS
0
$0
0
$0
1
$106,170
0
$0
0
$0
0
$0
Aggregated Statistics For Year 2007 (Based on 2 partial tracts)
A) FHA, FSA/RHS & VA Home Purchase Loans
B) Conventional Home Purchase Loans
C) Refinancings
D) Home Improvement Loans
F) Non-occupant Loans on < 5 Family Dwellings (A B C & D)
G) Loans On Manufactured Home Dwelling (A B C & D)
Number
Average Value
Number
Average Value
Number
Average Value
Number
Average Value
Number
Average Value
Number
Average Value
LOANS ORIGINATED
1
$62,190
2
$94,230
6
$96,743
1
$36,230
1
$86,480
1
$124,170
APPLICATIONS APPROVED, NOT ACCEPTED
0
$0
1
$81,040
1
$142,600
0
$0
0
$0
1
$68,260
APPLICATIONS DENIED
0
$0
1
$120,200
8
$104,150
1
$75,590
0
$0
2
$116,425
APPLICATIONS WITHDRAWN
0
$0
1
$77,900
2
$134,225
1
$29,530
0
$0
1
$39,790
FILES CLOSED FOR INCOMPLETENESS
0
$0
0
$0
0
$0
0
$0
0
$0
0
$0
Aggregated Statistics For Year 2006 (Based on 2 partial tracts)
A) FHA, FSA/RHS & VA Home Purchase Loans
B) Conventional Home Purchase Loans
C) Refinancings
D) Home Improvement Loans
F) Non-occupant Loans on < 5 Family Dwellings (A B C & D)
G) Loans On Manufactured Home Dwelling (A B C & D)
Number
Average Value
Number
Average Value
Number
Average Value
Number
Average Value
Number
Average Value
Number
Average Value
LOANS ORIGINATED
1
$90,670
5
$63,072
9
$87,692
2
$50,150
2
$52,035
1
$16,330
APPLICATIONS APPROVED, NOT ACCEPTED
0
$0
1
$73,920
1
$131,500
0
$0
0
$0
1
$68,470
APPLICATIONS DENIED
0
$0
3
$55,700
9
$93,694
2
$46,485
1
$47,530
2
$79,570
APPLICATIONS WITHDRAWN
0
$0
1
$52,350
2
$96,640
0
$0
0
$0
1
$31,620
FILES CLOSED FOR INCOMPLETENESS
0
$0
1
$63,870
0
$0
0
$0
0
$0
0
$0
Aggregated Statistics For Year 2005 (Based on 2 partial tracts)
A) FHA, FSA/RHS & VA Home Purchase Loans
B) Conventional Home Purchase Loans
C) Refinancings
D) Home Improvement Loans
F) Non-occupant Loans on < 5 Family Dwellings (A B C & D)
G) Loans On Manufactured Home Dwelling (A B C & D)
Number
Average Value
Number
Average Value
Number
Average Value
Number
Average Value
Number
Average Value
Number
Average Value
LOANS ORIGINATED
1
$58,000
3
$92,763
7
$74,906
2
$25,440
0
$0
3
$58,213
APPLICATIONS APPROVED, NOT ACCEPTED
0
$0
2
$80,620
1
$94,440
0
$0
0
$0
1
$80,620
APPLICATIONS DENIED
0
$0
2
$79,570
12
$93,148
2
$65,440
1
$35,600
3
$78,527
APPLICATIONS WITHDRAWN
0
$0
1
$97,370
3
$99,953
1
$43,350
0
$0
1
$36,650
FILES CLOSED FOR INCOMPLETENESS
0
$0
0
$0
0
$0
0
$0
0
$0
0
$0
Aggregated Statistics For Year 2004 (Based on 2 partial tracts)
A) FHA, FSA/RHS & VA Home Purchase Loans
B) Conventional Home Purchase Loans
C) Refinancings
D) Home Improvement Loans
F) Non-occupant Loans on < 5 Family Dwellings (A B C & D)
G) Loans On Manufactured Home Dwelling (A B C & D)
Detailed PMIC statistics for the following Tracts:0401.02
2005 - 2018 National Fire Incident Reporting System (NFIRS) incidents
According to the data from the years 2005 - 2018 the average number of fires per year is 26. The highest number of fire incidents - 43 took place in 2012, and the least - 5 in 2017. The data has a rising trend.
When looking into fire subcategories, the most reports belonged to: Outside Fires (49.6%), and Structure Fires (30.9%).
Fire incident types reported to NFIRS in Zip Code 27311


 Nearest zip codes: 27315, 27326, 24541, 24540, 27379, 27212.


 According to the data from the years 2005 - 2018 the average number of fires per year is 26. The highest number of fire incidents - 43 took place in 2012, and the least - 5 in 2017. The data has a rising trend.
 When looking into fire subcategories, the most reports belonged to: Outside Fires (49.6%), and Structure Fires (30.9%).