Estimated zip code population in 2022: 3,508 Zip code population in 2010: 4,008 Zip code population in 2000: 3,836
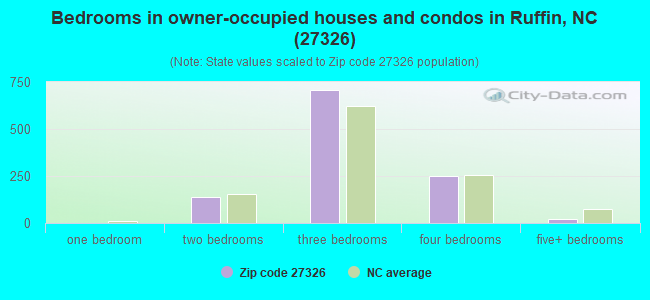
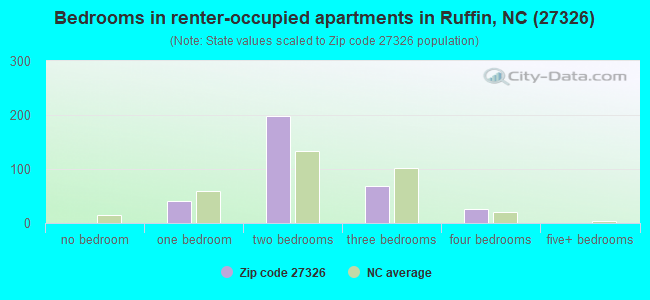
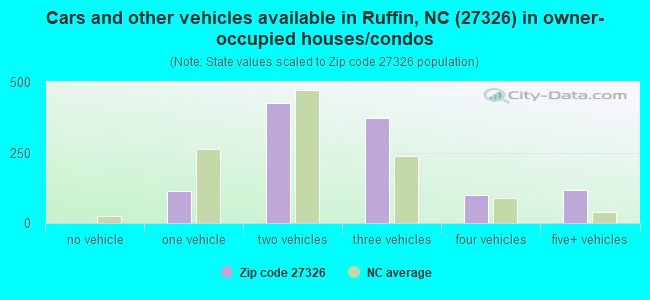
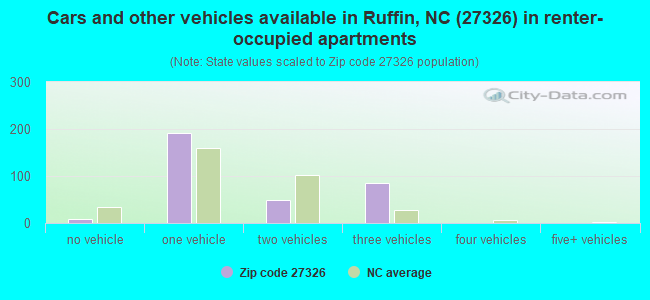
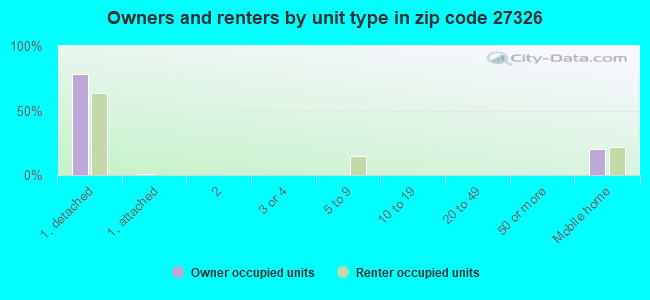
Houses and condos: 1,791 Renter-occupied apartments: 333
% of renters here:
23%
State:
33%
March 2022 cost of living index in zip code 27326: 78.7 (low, U.S. average is 100)
Land area: 70.9 sq. mi. Water area: 0.3 sq. mi.
Population density: 49 people per square mile
(very low).
OSM Map
General Map
Google Map
MSN Map
OSM Map
General Map
Google Map
MSN Map
OSM Map
General Map
Google Map
MSN Map
OSM Map
General Map
Google Map
MSN Map
Please wait while loading the map...
Real estate property taxes paid for housing units in 2022:
This zip code:
0.6% ($955)
North Carolina:
0.6% ($1,769)
Median real estate property taxes paid for housing units with mortgages in 2022: $965 (0.6%) Median real estate property taxes paid for housing units with no mortgage in 2022: $943 (0.6%)
Business Search- 14 Million verified businesses
Males: 1,514
(43.2%)
Females: 1,994
(56.8%)
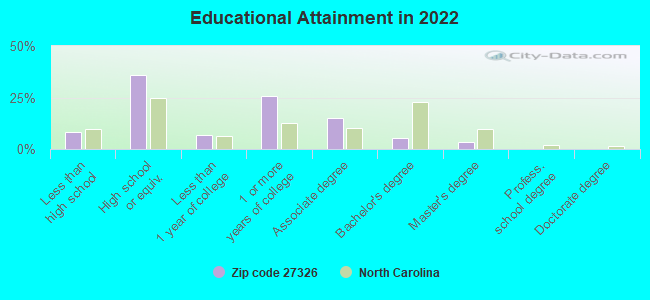
For population 25 years and over in 27326:
High school or higher: 89.0%
Bachelor's degree or higher: 8.6%
Graduate or professional degree: 3.1%
Unemployed: 2.3%
Mean travel time to work (commute): 33.5 minutes
For population 15 years and over in 27326:
Never married: 27.0%
Now married: 53.1%
Separated: 0.5%
Widowed: 8.5%
Divorced: 10.9%
Zip code 27326 compared to state average:
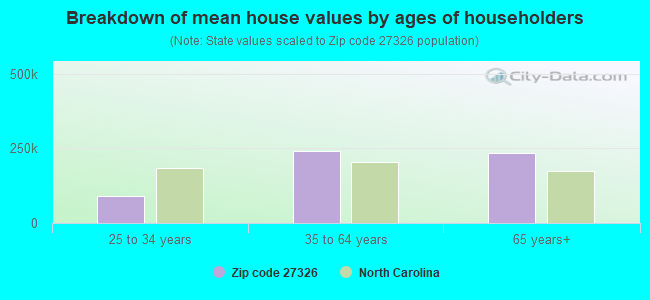
Median house value below state average.
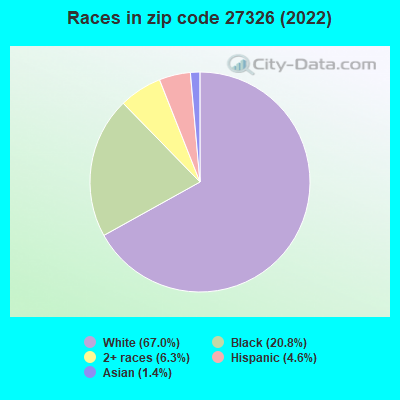
Hispanic race population percentage below state average.
Foreign-born population percentage significantly below state average.
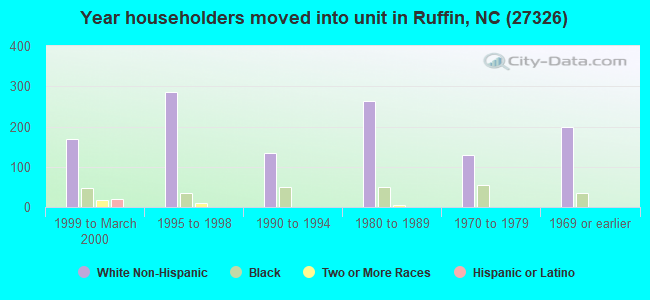
Length of stay since moving in significantly above state average.
Percentage of population with a bachelor's degree or higher significantly below state average.
Averages for the 2020 tax year for zip code 27326, filed in 2021:
Average Adjusted Gross Income (AGI) in 2020: $49,342 (Individual Income Tax Returns)
Here:
$49,342
State:
$70,020
Salary/wage: $43,180 (reported on 80.1% of returns)
Here:
$43,180
State:
$58,387
(% of AGI for various income ranges: 1190.4% for AGIs below $25k, 3383.4% for AGIs $25k-50k, 6212.8% for AGIs $50k-75k, 8296.4% for AGIs $75k-100k, 18906.0% for AGIs $100k-200k)
Taxable interest for individuals: $910 (reported on 28.9% of returns)
This zip code:
$910
North Carolina:
$1,479
(% of AGI for various income ranges: 16.0% for AGIs below $25k, 21.6% for AGIs $25k-50k, 51.7% for AGIs $50k-75k, 56.4% for AGIs $75k-100k, 128.0% for AGIs $100k-200k)
Ordinary dividends: $5,119 (reported on 15.7% of returns)
Here:
$5,119
State:
$7,888
(% of AGI for various income ranges: 29.1% for AGIs below $25k, 41.8% for AGIs $25k-50k, 95.0% for AGIs $50k-75k, 136.4% for AGIs $75k-100k, 720.0% for AGIs $100k-200k)
Net capital gain/loss in AGI: +$6,967 (reported on 12.7% of returns)
Here:
+$6,967
State:
+$23,652
(% of AGI for various income ranges: 2.9% for AGIs below $25k, 16.6% for AGIs $25k-50k, 72.2% for AGIs $50k-75k, 121.8% for AGIs $75k-100k, 1123.0% for AGIs $100k-200k)
Profit/loss from business: +$9,765 (reported on 12.0% of returns)
Here:
+$9,765
State:
+$11,710
(% of AGI for various income ranges: 108.0% for AGIs below $25k, 76.6% for AGIs $25k-50k, 157.8% for AGIs $50k-75k, 277.3% for AGIs $75k-100k, 587.0% for AGIs $100k-200k)
Taxable individual retirement arrangement distribution: $18,347 (reported on 11.4% of returns)
27326:
$18,347
North Carolina:
$20,247
(% of AGI for various income ranges: 63.6% for AGIs below $25k, 149.7% for AGIs $25k-50k, 316.1% for AGIs $50k-75k, 418.2% for AGIs $75k-100k, 1602.0% for AGIs $100k-200k)
Total itemized deductions: $27,783 (reported on 3.6% of returns)
Here:
$27,783
State:
$34,549
(% of AGI for various income ranges: 478.3% for AGIs $50k-75k, 806.0% for AGIs $100k-200k)
Charity contributions: $10,850 (reported on 2.4% of returns)
Here:
$10,850
State:
$13,360
(% of AGI for various income ranges: 42.4% for AGIs $25k-50k, 273.0% for AGIs $100k-200k)
Taxes paid: $6,833 (reported on 3.6% of returns)
27326:
$6,833
State:
$7,586
(% of AGI for various income ranges: 77.2% for AGIs $50k-75k, 271.0% for AGIs $100k-200k)
Earned income credit: $2,289 (reported on 21.1% of returns)
Here:
$2,289
State:
$2,337
(% of AGI for various income ranges: 104.4% for AGIs below $25k, 87.1% for AGIs $25k-50k)
Percentage of individuals using paid preparers for their 2020 taxes: 93.4%
Here:
93%
State:
93%
(% for various income ranges: 90.2% for AGIs below $25k, 95.7% for AGIs $25k-50k, 96.0% for AGIs $50k-75k, 93.3% for AGIs $75k-100k, 94.7% for AGIs $100k-200k)
Averages for the 2012 tax year for zip code 27326, filed in 2013:
Average Adjusted Gross Income (AGI) in 2012: $40,597 (Individual Income Tax Returns)
Here:
$40,597
State:
$54,937
Salary/wage: $37,638 (reported on 80.8% of returns)
Here:
$37,638
State:
$46,336
(% of AGI for various income ranges: 72.4% for AGIs below $25k, 77.8% for AGIs $25k-50k, 75.6% for AGIs $50k-75k, 75.8% for AGIs $75k-100k, 72.0% for AGIs $100k-200k)
Taxable interest for individuals: $1,025 (reported on 32.7% of returns)
This zip code:
$1,025
North Carolina:
$1,298
(% of AGI for various income ranges: 1.2% for AGIs below $25k, 1.1% for AGIs $25k-50k, 0.9% for AGIs $50k-75k, 0.5% for AGIs $75k-100k, 0.5% for AGIs $100k-200k)
Ordinary dividends: $2,589 (reported on 17.9% of returns)
Here:
$2,589
State:
$6,213
(% of AGI for various income ranges: 1.4% for AGIs below $25k, 1.1% for AGIs $25k-50k, 1.7% for AGIs $50k-75k, 0.7% for AGIs $75k-100k, 0.8% for AGIs $100k-200k)
Net capital gain/loss in AGI: +$2,836 (reported on 14.1% of returns)
Here:
+$2,836
State:
+$12,740
(% of AGI for various income ranges: 0.5% for AGIs below $25k, 1.0% for AGIs $25k-50k, 1.7% for AGIs $50k-75k, 0.4% for AGIs $75k-100k, 1.2% for AGIs $100k-200k)
Profit/loss from business: +$6,194 (reported on 11.5% of returns)
Here:
+$6,194
State:
+$10,311
(% of AGI for various income ranges: 5.5% for AGIs below $25k, 1.6% for AGIs $25k-50k, 2.5% for AGIs $50k-75k, 0.4% for AGIs $75k-100k)
Taxable individual retirement arrangement distribution: $12,521 (reported on 12.2% of returns)
27326:
$12,521
North Carolina:
$15,575
(% of AGI for various income ranges: 3.4% for AGIs below $25k, 3.7% for AGIs $25k-50k, 3.0% for AGIs $50k-75k, 3.1% for AGIs $75k-100k, 5.4% for AGIs $100k-200k)
Total itemized deductions: $16,964 (23% of AGI, reported on 25.0% of returns)
Here:
$16,964
State:
$23,438
Here:
23.4% of AGI
State:
21.5% of AGI
(% of AGI for various income ranges: 8.4% for AGIs below $25k, 7.2% for AGIs $25k-50k, 9.1% for AGIs $50k-75k, 12.0% for AGIs $75k-100k, 14.9% for AGIs $100k-200k)
Charity contributions: $3,687 (reported on 19.9% of returns)
Here:
$3,687
State:
$4,687
(% of AGI for various income ranges: 0.6% for AGIs below $25k, 1.3% for AGIs $25k-50k, 1.8% for AGIs $50k-75k, 2.0% for AGIs $75k-100k, 3.0% for AGIs $100k-200k)
Taxes paid: $5,723 (reported on 25.0% of returns)
27326:
$5,723
State:
$8,823
(% of AGI for various income ranges: 1.0% for AGIs below $25k, 1.7% for AGIs $25k-50k, 2.8% for AGIs $50k-75k, 4.5% for AGIs $75k-100k, 6.9% for AGIs $100k-200k)
Earned income credit: $2,228 (reported on 25.0% of returns)
Here:
$2,228
State:
$2,376
(% of AGI for various income ranges: 7.3% for AGIs below $25k, 1.5% for AGIs $25k-50k)
Percentage of individuals using paid preparers for their 2012 taxes: 59.6%
Here:
60%
State:
53%
(% for various income ranges: 55.1% for AGIs below $25k, 56.1% for AGIs $25k-50k, 63.6% for AGIs $50k-75k, 71.4% for AGIs $75k-100k, 80.0% for AGIs $100k-200k)
Averages for the 2004 tax year for zip code 27326, filed in 2005:
Average Adjusted Gross Income (AGI) in 2004: $36,281 (Individual Income Tax Returns)
Here:
$36,281
State:
$45,376
Salary/wage: $33,642 (reported on 85.6% of returns)
Here:
$33,642
State:
$39,442
(% of AGI for various income ranges: 95.0% for AGIs below $10k, 78.0% for AGIs $10k-25k, 81.9% for AGIs $25k-50k, 83.0% for AGIs $50k-75k, 83.7% for AGIs $75k-100k, 62.6% for AGIs over 100k)
Taxable interest for individuals: $1,574 (reported on 38.0% of returns)
This zip code:
$1,574
North Carolina:
$1,515
(% of AGI for various income ranges: 5.1% for AGIs below $10k, 2.6% for AGIs $10k-25k, 2.0% for AGIs $25k-50k, 1.3% for AGIs $50k-75k, 1.0% for AGIs $75k-100k, 1.0% for AGIs over 100k)
Taxable dividends: $1,827 (reported on 18.0% of returns)
Here:
$1,827
State:
$4,016
(% of AGI for various income ranges: 3.4% for AGIs below $10k, 1.0% for AGIs $10k-25k, 0.4% for AGIs $25k-50k, 1.0% for AGIs $50k-75k, 0.5% for AGIs $75k-100k, 1.6% for AGIs over 100k)
Net capital gain/loss: +$3,233 (reported on 12.5% of returns)
Here:
+$3,233
State:
+$11,152
(% of AGI for various income ranges: -2.1% for AGIs below $10k, -0.2% for AGIs $10k-25k, 0.4% for AGIs $25k-50k, 1.0% for AGIs $50k-75k, -0.1% for AGIs $75k-100k, 5.4% for AGIs over 100k)
Profit/loss from business: +$3,314 (reported on 12.4% of returns)
Here:
+$3,314
State:
+$9,490
(% of AGI for various income ranges: 6.9% for AGIs below $10k, 3.4% for AGIs $10k-25k, 1.0% for AGIs $25k-50k, 0.9% for AGIs $50k-75k, -0.1% for AGIs $75k-100k, 0.1% for AGIs over 100k)
IRA payment deduction: $2,857 (reported on 2.1% of returns)
27326:
$2,857
North Carolina:
$2,967
Total itemized deductions: $14,597 (24% of AGI, reported on 28.3% of returns)
Here:
$14,597
State:
$19,464
Here:
23.9% of AGI
State:
22.7% of AGI
(% of AGI for various income ranges: 14.8% for AGIs below $10k, 7.1% for AGIs $10k-25k, 10.0% for AGIs $25k-50k, 12.3% for AGIs $50k-75k, 14.1% for AGIs $75k-100k, 13.2% for AGIs over 100k)
Charity contributions deductions: $2,631 (4% of AGI, reported on 23.6% of returns)
Here:
$2,631
State:
$4,035
Here:
4.2% of AGI
State:
4.5% of AGI
(% of AGI for various income ranges: 1.2% for AGIs below $10k, 0.6% for AGIs $10k-25k, 1.4% for AGIs $25k-50k, 1.9% for AGIs $50k-75k, 2.4% for AGIs $75k-100k, 2.3% for AGIs over 100k)
Total tax: $4,095 (reported on 74.8% of returns)
27326:
$4,095
State:
$7,257
(% of AGI for various income ranges: 3.6% for AGIs below $10k, 3.7% for AGIs $10k-25k, 6.7% for AGIs $25k-50k, 8.1% for AGIs $50k-75k, 10.5% for AGIs $75k-100k, 15.6% for AGIs over 100k)
Earned income credit: $1,757 (reported on 20.6% of returns)
Here:
$1,757
State:
$1,851
Percentage of individuals using paid preparers for their 2004 taxes: 66.1%
Here:
66%
State:
62%
(% for various income ranges: 59.9% for AGIs below $10k, 67.0% for AGIs $10k-25k, 67.2% for AGIs $25k-50k, 66.8% for AGIs $50k-75k, 62.2% for AGIs $75k-100k, 83.6% for AGIs over 100k)
Household received Food Stamps/SNAP in the past 12 months: 212 Household did not receive Food Stamps/SNAP in the past 12 months: 1,244
Women who had a birth in the past 12 months: 40 (0 now married, 38 unmarried) Women who did not have a birth in the past 12 months: 881 (409 now married, 472 unmarried)
Housing units in zip code 27326 with a mortgage: 453 (31 second mortgage, 24 both second mortgage and home equity loan) Houses without a mortgage: 74
Median monthly owner costs for units with a mortgage: $1,063 Median monthly owner costs for units without a mortgage: $327
Residents with income below the poverty level in 2022:
This zip code:
11.4%
Whole state:
12.8%
Residents with income below 50% of the poverty level in 2022:
This zip code:
6.8%
Whole state:
6.8%
Median number of rooms in houses and condos:
Here:
6.2
State:
6.4
Median number of rooms in apartments:
Here:
4.1
State:
4.4
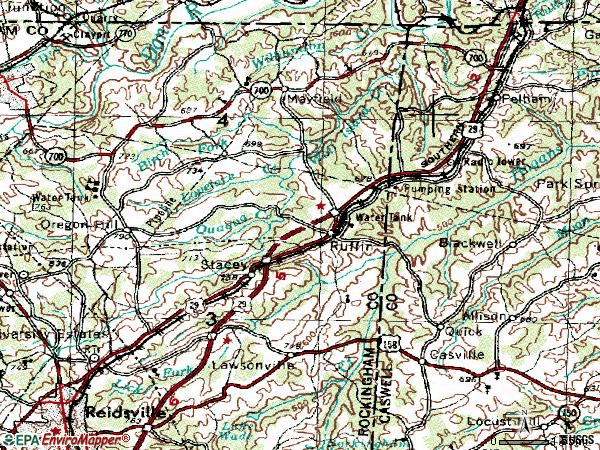
Notable locations in this zip code not listed on our city pages
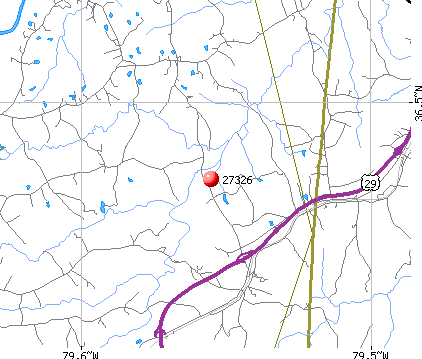
Churches in zip code 27326 include: Guerrant Springs Church (A), Mount Carmel Church (B), Bethesda Church (C), Happy Home United Church of Christ (D), Mount Hermon Baptist Church (E), New Ephesus Church (F), Chapel Hill Primitive Baptist Church (G), Pleasant Grove Church (H), Dan River Primitive Baptist Church (I). Display/hide their locations on the map
Streams, rivers, and creeks: Buckhorn Branch (A), Birch Fork (B), Quaqua Creek (C), Lovelace Creek (D), Lick Fork (E). Display/hide their locations on the map
In group quarters: 19 (-1 institutionalized population)
Size of family households: 570 2-persons, 257 3-persons, 103 4-persons, 98 5-persons, 17 6-persons
Size of nonfamily households: 360 1-person, 51 2-persons
394 married couples with children.
263 single-parent households (32 men, 231 women).
92.2% of residents of 27326 zip code speak English at home.
1.7% of residents speak Spanish at home (74% very well, 26% well).
4.5% of residents speak other Indo-European language at home (100% very well).
1.4% of residents speak Asian or Pacific Island language at home (100% very well).
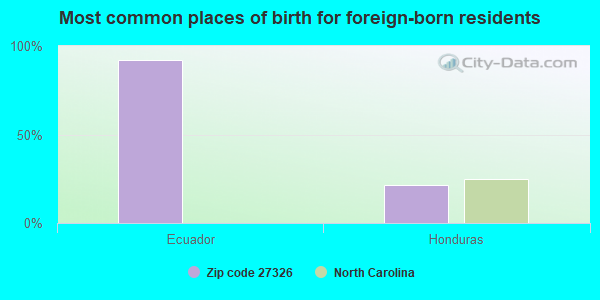
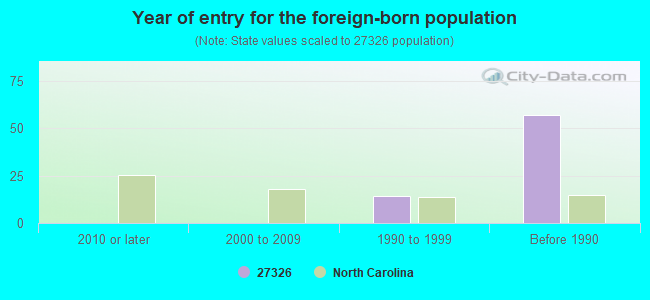
Foreign born population: 67 (1.9%) (77.1% of them are naturalized citizens)
This zip code:
1.9%
Whole state:
8.6%
92%Ecuador
22%Honduras
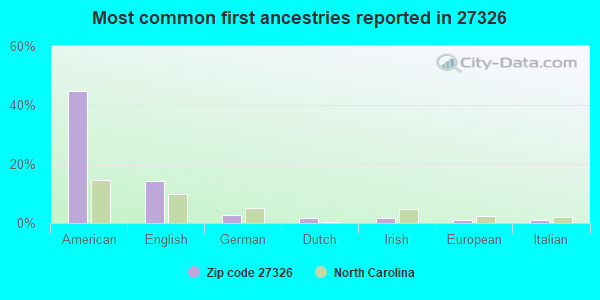
45%American
14%English
3%German
2%Dutch
2%Irish
1%European
1%Italian
Year of entry for the foreign-born population
02010 or later
02000 to 2009
141990 to 1999
57Before 1990
Facilities with environmental interests located in this zip code:
ABERCROMBIE OIL CO (ASHLAND ROAD AND US 158 in CASVILLE, NC)
STATE MASTER (North Carolina facility info) - -115DA4YG00M29W84AX3X0559E5, WASTEWATER FACILITY National Pollutant Discharge Elimination System NON-MAJOR (Tracking pollutant discharge elimination systems) - permit Business SIC classification: FUEL OIL DEALERS
CLIFTON GEORGIE- RESIDENCE (223 MT CARMEL CHURCH RD in RUFFIN, NC)
National Pollutant Discharge Elimination System NON-MAJOR (Tracking pollutant discharge elimination systems) - permit Business SIC classification: SEWERAGE SYSTEMS
Housing units lacking complete plumbing facilities: 7.5% Housing units lacking complete kitchen facilities: 7.2%
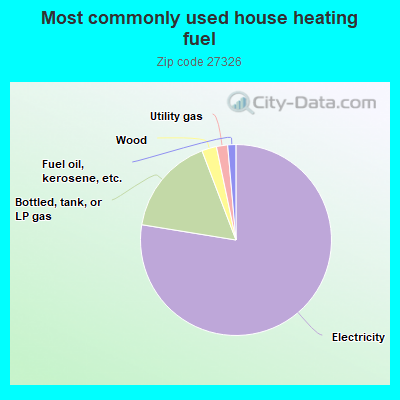
77.8%Electricity
16.7%Bottled, tank, or LP gas
2.5%Wood
1.9%Utility gas
1.4%Fuel oil, kerosene, etc.
Population in 1990: 4,138.
Place of birth for U.S.-born residents:
This state: 2,135
Northeast: 153
Midwest: 137
South: 977
West: 8
63% of the 27326 zip code residents lived in the same house 5 years ago. Out of people who lived in different houses, 54% lived in this county. Out of people who lived in different counties, 50% lived in North Carolina.
95% of the 27326 zip code residents lived in the same house 1 year ago. Out of people who lived in different houses, 93% moved from this county. Out of people who lived in different houses, 6% moved from different county within same state.
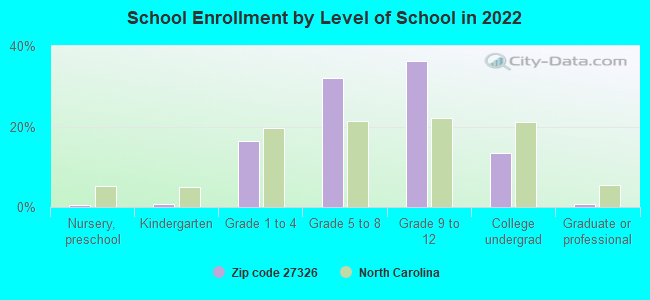
Private vs. public school enrollment:
Students in private schools in grades 1 to 8 (elementary and middle school): 30
Here:
7.2%
North Carolina:
13.8%
Students in private schools in grades 9 to 12 (high school): 64
Here:
19.9%
North Carolina:
11.9%
Students in private undergraduate colleges:
Here:
0.0%
North Carolina:
19.3%
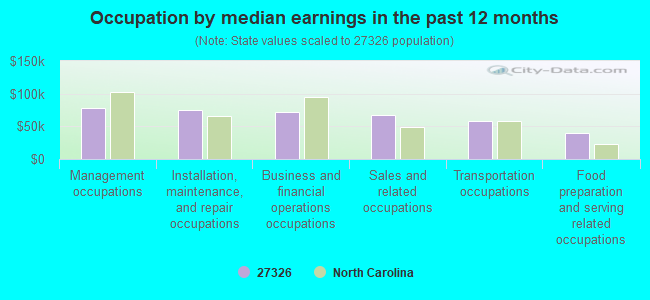
Occupation by median earnings in the past 12 months ($)
78,566Management occupations
75,595Installation, maintenance, and repair occupations
71,472Business and financial operations occupations
67,507Sales and related occupations
58,620Transportation occupations
39,766Food preparation and serving related occupations
Top industries in this zip code by the number of employees in 2005:
Other Services (except Public Administration): Religious Organizations (10-19 employees: 1 establishment, 5-9 employees: 2 establishments, 1-4 employees: 1 establishment)
Administrative and Support and Waste Management and Remediation Services: Remediation Services (10-19: 1)
Construction: Electrical Contractors (10-19: 1)
Construction: New Housing Operative Builders (5-9: 1)
Construction: New Single-Family Housing Construction (except Operative Builders) (5-9: 1)
Accommodation and Food Services: Drinking Places (Alcoholic Beverages) (1-4: 2)
Professional, Scientific, and Technical Services: Process, Physical Distribution, and Logistics Consulting Services (1-4: 1)
People in group quarters in 2010:
4 people in nursing facilities/skilled-nursing facilities
2 people in workers' group living quarters and job corps centers
People in group quarters in 2000:
5 people in other group homes
2 people in homes for the mentally ill
Fatal accident statistics in 2014:
Fatal accident count: 1
Vehicles involved in fatal accidents: 1
Fatal accidents caused by drunken drivers: 0
Fatalities: 1
Persons involved in fatal accidents: 1
Pedestrians involved in fatal accidents: 0
Fatal accident statistics in 2012:
Fatal accident count: 1
Vehicles involved in fatal accidents: 1
Fatal accidents caused by drunken drivers: 1
Fatalities: 1
Persons involved in fatal accidents: 2
Pedestrians involved in fatal accidents: 0
Home Mortgage Disclosure Act Aggregated Statistics For Year 2009 (Based on 4 partial tracts)
A) FHA, FSA/RHS & VA Home Purchase Loans
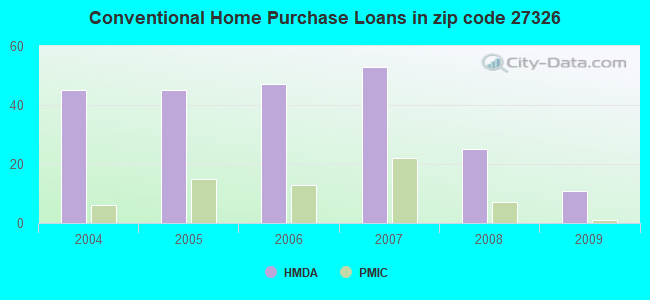
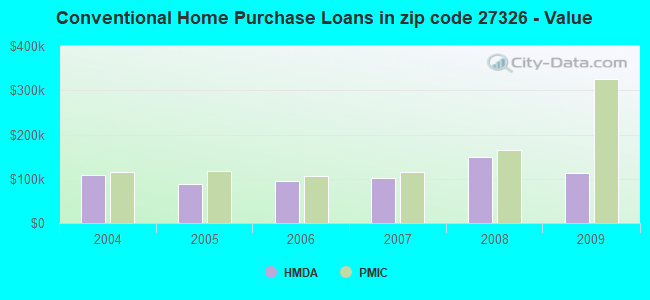
B) Conventional Home Purchase Loans
C) Refinancings
D) Home Improvement Loans
F) Non-occupant Loans on < 5 Family Dwellings (A B C & D)
G) Loans On Manufactured Home Dwelling (A B C & D)
Number
Average Value
Number
Average Value
Number
Average Value
Number
Average Value
Number
Average Value
Number
Average Value
LOANS ORIGINATED
11
$120,229
11
$114,099
102
$123,948
11
$28,525
2
$87,165
8
$73,910
APPLICATIONS APPROVED, NOT ACCEPTED
1
$72,000
1
$244,510
6
$102,520
1
$3,510
0
$0
2
$48,530
APPLICATIONS DENIED
8
$167,422
5
$121,982
52
$116,108
7
$27,526
2
$51,510
4
$76,582
APPLICATIONS WITHDRAWN
0
$0
4
$124,218
26
$115,887
3
$81,620
0
$0
5
$57,184
FILES CLOSED FOR INCOMPLETENESS
0
$0
0
$0
1
$300,210
0
$0
0
$0
0
$0
Aggregated Statistics For Year 2008 (Based on 4 partial tracts)
A) FHA, FSA/RHS & VA Home Purchase Loans
B) Conventional Home Purchase Loans
C) Refinancings
D) Home Improvement Loans
F) Non-occupant Loans on < 5 Family Dwellings (A B C & D)
G) Loans On Manufactured Home Dwelling (A B C & D)
Number
Average Value
Number
Average Value
Number
Average Value
Number
Average Value
Number
Average Value
Number
Average Value
LOANS ORIGINATED
23
$83,676
25
$148,953
85
$111,508
5
$9,064
16
$118,707
18
$71,947
APPLICATIONS APPROVED, NOT ACCEPTED
2
$85,935
3
$68,893
14
$103,083
0
$0
3
$81,050
1
$83,070
APPLICATIONS DENIED
6
$160,255
7
$89,414
93
$112,402
13
$68,308
8
$67,889
17
$78,858
APPLICATIONS WITHDRAWN
0
$0
5
$124,326
29
$149,804
3
$29,650
3
$153,500
5
$78,414
FILES CLOSED FOR INCOMPLETENESS
1
$67,920
1
$51,480
6
$114,635
1
$17,550
1
$51,480
1
$63,840
Aggregated Statistics For Year 2007 (Based on 4 partial tracts)
A) FHA, FSA/RHS & VA Home Purchase Loans
B) Conventional Home Purchase Loans
C) Refinancings
D) Home Improvement Loans
F) Non-occupant Loans on < 5 Family Dwellings (A B C & D)
G) Loans On Manufactured Home Dwelling (A B C & D)
Number
Average Value
Number
Average Value
Number
Average Value
Number
Average Value
Number
Average Value
Number
Average Value
LOANS ORIGINATED
15
$111,380
53
$102,638
83
$108,897
11
$46,618
17
$85,808
18
$72,477
APPLICATIONS APPROVED, NOT ACCEPTED
0
$0
4
$87,502
10
$97,163
1
$21,730
1
$76,630
3
$86,663
APPLICATIONS DENIED
3
$53,923
19
$91,885
105
$101,331
12
$66,728
5
$90,090
29
$89,930
APPLICATIONS WITHDRAWN
1
$118,180
6
$122,302
39
$141,765
3
$101,300
1
$43,290
3
$76,443
FILES CLOSED FOR INCOMPLETENESS
0
$0
1
$235,170
2
$53,650
0
$0
1
$69,280
0
$0
Aggregated Statistics For Year 2006 (Based on 4 partial tracts)
A) FHA, FSA/RHS & VA Home Purchase Loans
B) Conventional Home Purchase Loans
C) Refinancings
D) Home Improvement Loans
F) Non-occupant Loans on < 5 Family Dwellings (A B C & D)
G) Loans On Manufactured Home Dwelling (A B C & D)
Number
Average Value
Number
Average Value
Number
Average Value
Number
Average Value
Number
Average Value
Number
Average Value
LOANS ORIGINATED
8
$103,659
47
$95,422
109
$88,223
17
$55,877
9
$51,172
14
$61,379
APPLICATIONS APPROVED, NOT ACCEPTED
0
$0
18
$67,997
16
$58,619
4
$21,735
3
$31,243
17
$57,358
APPLICATIONS DENIED
1
$23,980
33
$82,560
105
$109,581
16
$57,835
3
$102,223
34
$79,159
APPLICATIONS WITHDRAWN
1
$29,250
7
$91,917
43
$84,047
3
$39,167
0
$0
3
$74,723
FILES CLOSED FOR INCOMPLETENESS
0
$0
3
$120,603
9
$153,467
0
$0
0
$0
0
$0
Aggregated Statistics For Year 2005 (Based on 4 partial tracts)
A) FHA, FSA/RHS & VA Home Purchase Loans
B) Conventional Home Purchase Loans
C) Refinancings
D) Home Improvement Loans
F) Non-occupant Loans on < 5 Family Dwellings (A B C & D)
G) Loans On Manufactured Home Dwelling (A B C & D)
Number
Average Value
Number
Average Value
Number
Average Value
Number
Average Value
Number
Average Value
Number
Average Value
LOANS ORIGINATED
9
$93,170
45
$87,853
92
$91,299
16
$46,580
9
$79,572
21
$70,453
APPLICATIONS APPROVED, NOT ACCEPTED
2
$58,385
17
$60,537
27
$108,432
5
$80,960
0
$0
14
$50,047
APPLICATIONS DENIED
3
$57,960
21
$76,866
103
$92,646
22
$55,457
7
$55,153
26
$78,603
APPLICATIONS WITHDRAWN
1
$85,990
11
$106,975
54
$92,338
4
$127,060
5
$131,210
4
$64,308
FILES CLOSED FOR INCOMPLETENESS
1
$202,400
1
$100,620
7
$79,033
1
$36,850
0
$0
0
$0
Aggregated Statistics For Year 2004 (Based on 4 partial tracts)
A) FHA, FSA/RHS & VA Home Purchase Loans
B) Conventional Home Purchase Loans
C) Refinancings
D) Home Improvement Loans
F) Non-occupant Loans on < 5 Family Dwellings (A B C & D)
G) Loans On Manufactured Home Dwelling (A B C & D)
Detailed PMIC statistics for the following Tracts:0401.01
, 0401.02
2004 - 2018 National Fire Incident Reporting System (NFIRS) incidents
According to the data from the years 2004 - 2018 the average number of fires per year is 23. The highest number of reported fire incidents - 39 took place in 2016, and the least - 2 in 2004. The data has a growing trend.
When looking into fire subcategories, the most incidents belonged to: Outside Fires (43.8%), and Structure Fires (41.7%).
Fire incident types reported to NFIRS in Zip Code 27326

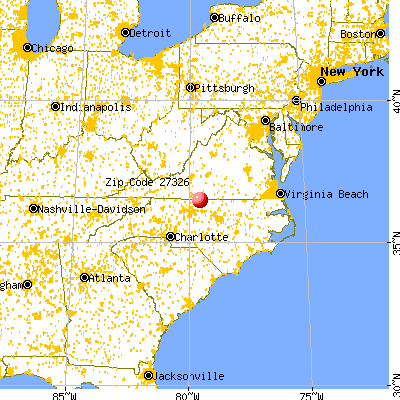


 Nearest zip codes: 27311, 24541, 24069, 27320, 27315, 27288.


 According to the data from the years 2004 - 2018 the average number of fires per year is 23. The highest number of reported fire incidents - 39 took place in 2016, and the least - 2 in 2004. The data has a growing trend.
 When looking into fire subcategories, the most incidents belonged to: Outside Fires (43.8%), and Structure Fires (41.7%).