Estimated zip code population in 2022: 10,182 Zip code population in 2010: 11,670 Zip code population in 2000: 10,169
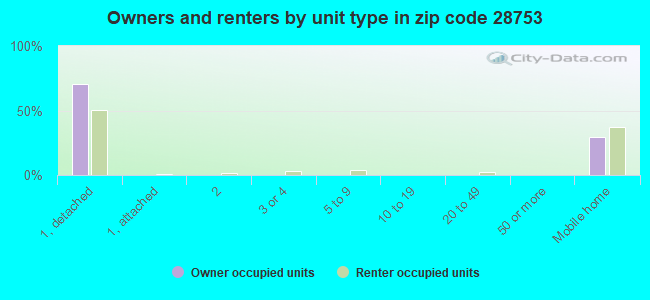
Houses and condos: 5,578 Renter-occupied apartments: 804
% of renters here:
19%
State:
33%
March 2022 cost of living index in zip code 28753: 80.8 (low, U.S. average is 100)
Land area: 263.9 sq. mi. Water area: 1.3 sq. mi.
Population density: 39 people per square mile
(very low).
OSM Map
General Map
Google Map
MSN Map
OSM Map
General Map
Google Map
MSN Map
OSM Map
General Map
Google Map
MSN Map
OSM Map
General Map
Google Map
MSN Map
Please wait while loading the map...
Real estate property taxes paid for housing units in 2022:
This zip code:
0.5% ($1,184)
North Carolina:
0.6% ($1,769)
Median real estate property taxes paid for housing units with mortgages in 2022: $1,345 (0.5%) Median real estate property taxes paid for housing units with no mortgage in 2022: $1,003 (0.6%)
Averages for the 2020 tax year for zip code 28753, filed in 2021:
Average Adjusted Gross Income (AGI) in 2020: $49,582 (Individual Income Tax Returns)
Here:
$49,582
State:
$70,020
Salary/wage: $43,991 (reported on 76.9% of returns)
Here:
$43,991
State:
$58,387
(% of AGI for various income ranges: 1095.0% for AGIs below $25k, 3654.1% for AGIs $25k-50k, 6952.1% for AGIs $50k-75k, 10001.5% for AGIs $75k-100k, 15720.4% for AGIs $100k-200k, 56013.3% for AGIs over 200k)
Taxable interest for individuals: $1,196 (reported on 30.6% of returns)
This zip code:
$1,196
North Carolina:
$1,479
(% of AGI for various income ranges: 19.4% for AGIs below $25k, 34.2% for AGIs $25k-50k, 73.5% for AGIs $50k-75k, 78.5% for AGIs $75k-100k, 124.6% for AGIs $100k-200k, 1150.0% for AGIs over 200k)
Ordinary dividends: $5,816 (reported on 11.4% of returns)
Here:
$5,816
State:
$7,888
(% of AGI for various income ranges: 22.1% for AGIs below $25k, 35.0% for AGIs $25k-50k, 112.1% for AGIs $50k-75k, 178.9% for AGIs $75k-100k, 228.5% for AGIs $100k-200k, 3610.0% for AGIs over 200k)
Net capital gain/loss in AGI: +$23,889 (reported on 11.2% of returns)
Here:
+$23,889
State:
+$23,652
(% of AGI for various income ranges: 7.7% for AGIs below $25k, 71.5% for AGIs $25k-50k, 109.4% for AGIs $50k-75k, 420.4% for AGIs $75k-100k, 547.7% for AGIs $100k-200k, 32173.3% for AGIs over 200k)
Profit/loss from business: +$10,214 (reported on 21.4% of returns)
Here:
+$10,214
State:
+$11,710
(% of AGI for various income ranges: 251.2% for AGIs below $25k, 301.3% for AGIs $25k-50k, 293.1% for AGIs $50k-75k, 308.5% for AGIs $75k-100k, 872.3% for AGIs $100k-200k)
Taxable individual retirement arrangement distribution: $17,649 (reported on 8.4% of returns)
28753:
$17,649
North Carolina:
$20,247
(% of AGI for various income ranges: 65.1% for AGIs below $25k, 78.1% for AGIs $25k-50k, 209.0% for AGIs $50k-75k, 413.3% for AGIs $75k-100k, 866.5% for AGIs $100k-200k, 5000.0% for AGIs over 200k)
Total itemized deductions: $29,926 (reported on 3.7% of returns)
Here:
$29,926
State:
$34,549
(% of AGI for various income ranges: 43.0% for AGIs below $25k, 48.0% for AGIs $25k-50k, 154.8% for AGIs $50k-75k, 329.6% for AGIs $75k-100k, 647.3% for AGIs $100k-200k, 4250.0% for AGIs over 200k)
Charity contributions: $8,964 (reported on 2.7% of returns)
Here:
$8,964
State:
$13,360
(% of AGI for various income ranges: 23.0% for AGIs $25k-50k, 68.5% for AGIs $75k-100k, 153.8% for AGIs $100k-200k, 1396.7% for AGIs over 200k)
Taxes paid: $6,221 (reported on 3.7% of returns)
28753:
$6,221
State:
$7,586
(% of AGI for various income ranges: 9.0% for AGIs $25k-50k, 27.3% for AGIs $50k-75k, 63.7% for AGIs $75k-100k, 178.8% for AGIs $100k-200k, 1053.3% for AGIs over 200k)
Earned income credit: $2,059 (reported on 21.0% of returns)
Here:
$2,059
State:
$2,337
(% of AGI for various income ranges: 107.3% for AGIs below $25k, 71.2% for AGIs $25k-50k)
Percentage of individuals using paid preparers for their 2020 taxes: 92.7%
Here:
93%
State:
93%
(% for various income ranges: 91.9% for AGIs below $25k, 94.4% for AGIs $25k-50k, 93.1% for AGIs $50k-75k, 90.7% for AGIs $75k-100k, 93.2% for AGIs $100k-200k, 90.0% for AGIs over 200k)
Averages for the 2012 tax year for zip code 28753, filed in 2013:
Average Adjusted Gross Income (AGI) in 2012: $38,861 (Individual Income Tax Returns)
Here:
$38,861
State:
$54,937
Salary/wage: $34,299 (reported on 80.5% of returns)
Here:
$34,299
State:
$46,336
(% of AGI for various income ranges: 68.5% for AGIs below $25k, 80.1% for AGIs $25k-50k, 77.7% for AGIs $50k-75k, 76.3% for AGIs $75k-100k, 67.1% for AGIs $100k-200k, 26.6% for AGIs over 200k)
Taxable interest for individuals: $1,112 (reported on 31.2% of returns)
This zip code:
$1,112
North Carolina:
$1,298
(% of AGI for various income ranges: 1.2% for AGIs below $25k, 0.9% for AGIs $25k-50k, 0.8% for AGIs $50k-75k, 0.5% for AGIs $75k-100k, 0.6% for AGIs $100k-200k, 1.9% for AGIs over 200k)
Ordinary dividends: $3,692 (reported on 10.9% of returns)
Here:
$3,692
State:
$6,213
(% of AGI for various income ranges: 1.3% for AGIs below $25k, 0.6% for AGIs $25k-50k, 0.8% for AGIs $50k-75k, 0.7% for AGIs $75k-100k, 2.7% for AGIs $100k-200k)
Net capital gain/loss in AGI: +$4,518 (reported on 12.7% of returns)
Here:
+$4,518
State:
+$12,740
(% of AGI for various income ranges: 0.6% for AGIs below $25k, 0.7% for AGIs $25k-50k, 0.4% for AGIs $50k-75k, 0.6% for AGIs $75k-100k, 3.5% for AGIs $100k-200k, 6.5% for AGIs over 200k)
Profit/loss from business: +$8,244 (reported on 20.1% of returns)
Here:
+$8,244
State:
+$10,311
(% of AGI for various income ranges: 11.2% for AGIs below $25k, 4.4% for AGIs $25k-50k, 3.3% for AGIs $50k-75k, 1.9% for AGIs $75k-100k, 3.0% for AGIs $100k-200k)
Taxable individual retirement arrangement distribution: $15,068 (reported on 8.4% of returns)
28753:
$15,068
North Carolina:
$15,575
(% of AGI for various income ranges: 2.5% for AGIs below $25k, 2.5% for AGIs $25k-50k, 3.2% for AGIs $50k-75k, 3.7% for AGIs $75k-100k, 6.7% for AGIs $100k-200k)
Total itemized deductions: $20,631 (26% of AGI, reported on 21.3% of returns)
Here:
$20,631
State:
$23,438
Here:
26.4% of AGI
State:
21.5% of AGI
(% of AGI for various income ranges: 7.5% for AGIs below $25k, 8.5% for AGIs $25k-50k, 10.0% for AGIs $50k-75k, 13.9% for AGIs $75k-100k, 15.1% for AGIs $100k-200k, 18.8% for AGIs over 200k)
Charity contributions: $3,809 (reported on 15.4% of returns)
Here:
$3,809
State:
$4,687
(% of AGI for various income ranges: 0.6% for AGIs below $25k, 1.0% for AGIs $25k-50k, 1.3% for AGIs $50k-75k, 2.2% for AGIs $75k-100k, 2.6% for AGIs $100k-200k, 2.4% for AGIs over 200k)
Taxes paid: $5,615 (reported on 21.3% of returns)
28753:
$5,615
State:
$8,823
(% of AGI for various income ranges: 1.3% for AGIs below $25k, 1.6% for AGIs $25k-50k, 2.5% for AGIs $50k-75k, 4.6% for AGIs $75k-100k, 5.8% for AGIs $100k-200k, 4.3% for AGIs over 200k)
Earned income credit: $2,129 (reported on 26.9% of returns)
Here:
$2,129
State:
$2,376
(% of AGI for various income ranges: 7.4% for AGIs below $25k, 1.4% for AGIs $25k-50k)
Percentage of individuals using paid preparers for their 2012 taxes: 60.2%
Here:
60%
State:
53%
(% for various income ranges: 57.4% for AGIs below $25k, 62.5% for AGIs $25k-50k, 62.1% for AGIs $50k-75k, 59.4% for AGIs $75k-100k, 65.0% for AGIs $100k-200k, 100.0% for AGIs over 200k)
Averages for the 2004 tax year for zip code 28753, filed in 2005:
Average Adjusted Gross Income (AGI) in 2004: $32,390 (Individual Income Tax Returns)
Here:
$32,390
State:
$45,376
Salary/wage: $30,046 (reported on 82.3% of returns)
Here:
$30,046
State:
$39,442
(% of AGI for various income ranges: 90.6% for AGIs below $10k, 77.1% for AGIs $10k-25k, 85.5% for AGIs $25k-50k, 83.1% for AGIs $50k-75k, 78.9% for AGIs $75k-100k, 41.4% for AGIs over 100k)
Taxable interest for individuals: $1,325 (reported on 35.3% of returns)
This zip code:
$1,325
North Carolina:
$1,515
(% of AGI for various income ranges: 4.8% for AGIs below $10k, 1.7% for AGIs $10k-25k, 1.0% for AGIs $25k-50k, 1.3% for AGIs $50k-75k, 1.5% for AGIs $75k-100k, 1.6% for AGIs over 100k)
Taxable dividends: $2,650 (reported on 12.2% of returns)
Here:
$2,650
State:
$4,016
(% of AGI for various income ranges: 3.0% for AGIs below $10k, 0.6% for AGIs $10k-25k, 0.7% for AGIs $25k-50k, 0.6% for AGIs $50k-75k, 1.0% for AGIs $75k-100k, 2.3% for AGIs over 100k)
Net capital gain/loss: +$9,615 (reported on 10.6% of returns)
Here:
+$9,615
State:
+$11,152
(% of AGI for various income ranges: 0.0% for AGIs below $10k, 0.7% for AGIs $10k-25k, 1.4% for AGIs $25k-50k, 1.9% for AGIs $50k-75k, 4.3% for AGIs $75k-100k, 11.0% for AGIs over 100k)
Profit/loss from business: +$7,112 (reported on 20.1% of returns)
Here:
+$7,112
State:
+$9,490
(% of AGI for various income ranges: 11.7% for AGIs below $10k, 7.7% for AGIs $10k-25k, 2.9% for AGIs $25k-50k, 1.4% for AGIs $50k-75k, 2.3% for AGIs $75k-100k, 9.3% for AGIs over 100k)
IRA payment deduction: $2,868 (reported on 1.6% of returns)
28753:
$2,868
North Carolina:
$2,967
(% of AGI for various income ranges: 0.1% for AGIs $10k-25k, 0.2% for AGIs $25k-50k, 0.2% for AGIs $50k-75k, 0.2% for AGIs $75k-100k)
Self-employed pension: $18,091 (reported on 0.3% of returns)
Here:
$18,091
North Carolina:
$14,754
Total itemized deductions: $16,424 (26% of AGI, reported on 19.9% of returns)
Here:
$16,424
State:
$19,464
Here:
26.2% of AGI
State:
22.7% of AGI
(% of AGI for various income ranges: 10.3% for AGIs below $10k, 6.2% for AGIs $10k-25k, 7.8% for AGIs $25k-50k, 11.1% for AGIs $50k-75k, 14.0% for AGIs $75k-100k, 14.1% for AGIs over 100k)
Charity contributions deductions: $3,471 (5% of AGI, reported on 15.3% of returns)
Here:
$3,471
State:
$4,035
Here:
5.1% of AGI
State:
4.5% of AGI
(% of AGI for various income ranges: 0.5% for AGIs below $10k, 0.6% for AGIs $10k-25k, 1.1% for AGIs $25k-50k, 1.6% for AGIs $50k-75k, 2.8% for AGIs $75k-100k, 3.3% for AGIs over 100k)
Total tax: $3,846 (reported on 73.4% of returns)
28753:
$3,846
State:
$7,257
(% of AGI for various income ranges: 4.3% for AGIs below $10k, 4.5% for AGIs $10k-25k, 6.2% for AGIs $25k-50k, 8.3% for AGIs $50k-75k, 10.6% for AGIs $75k-100k, 18.2% for AGIs over 100k)
Earned income credit: $1,677 (reported on 21.1% of returns)
Here:
$1,677
State:
$1,851
Percentage of individuals using paid preparers for their 2004 taxes: 68.2%
Here:
68%
State:
62%
(% for various income ranges: 66.7% for AGIs below $10k, 68.8% for AGIs $10k-25k, 69.2% for AGIs $25k-50k, 66.3% for AGIs $50k-75k, 65.6% for AGIs $75k-100k, 76.3% for AGIs over 100k)
Likely homosexual households (counted as self-reported same-sex unmarried-partner households)
Lesbian couples: 0.2% of all households
Gay men: 0.0% of all households
Household received Food Stamps/SNAP in the past 12 months: 529 Household did not receive Food Stamps/SNAP in the past 12 months: 3,668
Women who had a birth in the past 12 months: 150 (132 now married, 20 unmarried) Women who did not have a birth in the past 12 months: 2,118 (1,137 now married, 985 unmarried)
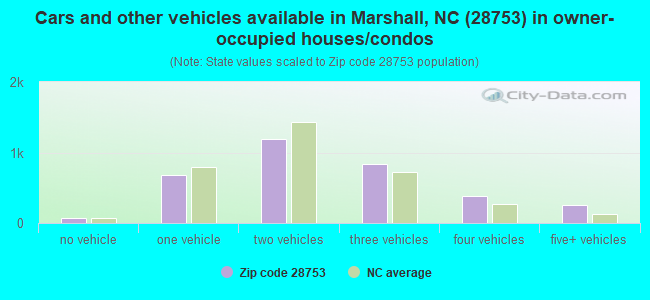
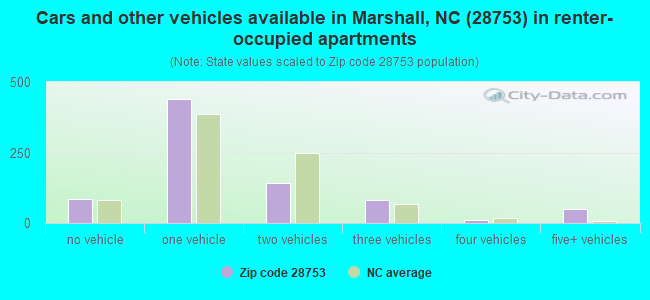
Housing units in zip code 28753 with a mortgage: 1,479 (67 second mortgage, 68 both second mortgage and home equity loan) Houses without a mortgage: 13
Median monthly owner costs for units with a mortgage: $1,260 Median monthly owner costs for units without a mortgage: $368
Residents with income below the poverty level in 2022:
This zip code:
10.7%
Whole state:
12.8%
Residents with income below 50% of the poverty level in 2022:
This zip code:
6.0%
Whole state:
6.8%
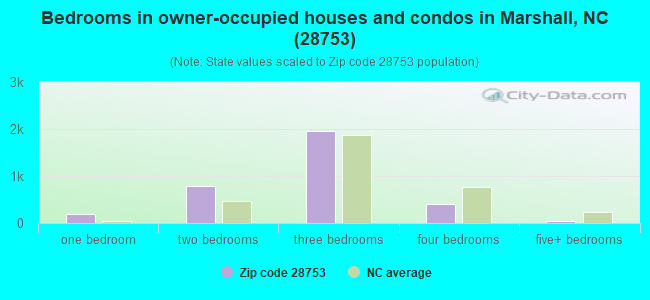
Median number of rooms in houses and condos:
Here:
5.5
State:
6.4
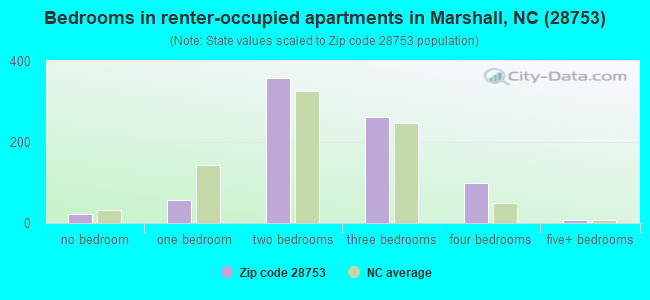
Median number of rooms in apartments:
Here:
5.0
State:
4.4
Notable locations in this zip code not listed on our city pages
Notable locations in zip code 28753: Volga (A), Lower Big Pine (B), Camp Creek Bald Lookout (C), Nocona Siding (D), Flint Gap Trail Shelter (E), Little Laurel Trail Shelter (F), Big Knob Lookout (G), Huckleberry Camp (H), Halls Store (I). Display/hide their locations on the map
Churches in zip code 28753 include: North Fork Church (A), Teague Chapel (B), Mount Zion Church (C), Laurel Branch Church (D), Mill Ridge Church (E), Middle Laurel Church (F), Little Sandymush Church (G), Laurelton Chapel (H), Laurel Fork Church (I). Display/hide their locations on the map
Cemeteries: McDevitt Cemetery (1), Massey Cemetery (2), Marshall Cemetery (3), Lunceford Cemetery (4), Lewis Cemetery (5), Old Station Cemetery (6), Dill Cemetery (7). Display/hide their locations on the map
Streams, rivers, and creeks: Indian Grave Gap Branch (A), Peter Cove Creek (B), Indian Camp Branch (C), Hunter Branch (D), Calvin Creek (E), Caney Fork (F), Horse Branch (G), Hopewell Branch (H), Hogskin Branch (I). Display/hide their locations on the map
In group quarters: 182 (-1 institutionalized population)
Size of family households: 1,320 2-persons, 654 3-persons, 461 4-persons, 248 5-persons, 29 6-persons, 21 7-or-more-persons
Size of nonfamily households: 1,277 1-person, 173 2-persons, 12 3-persons
1,666 married couples with children.
304 single-parent households (117 men, 187 women).
98.8% of residents of 28753 zip code speak English at home.
0.8% of residents speak Spanish at home (76% very well, 24% well).
0.1% of residents speak other Indo-European language at home (100% very well).
0.1% of residents speak Asian or Pacific Island language at home (67% very well, 33% well).
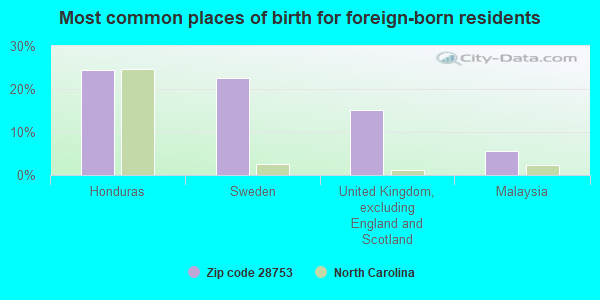
Foreign born population: 54 (0.5%) (50.9% of them are naturalized citizens)
This zip code:
0.5%
Whole state:
8.6%
25%Honduras
23%Sweden
15%United Kingdom, excluding England and Scotland
6%Malaysia
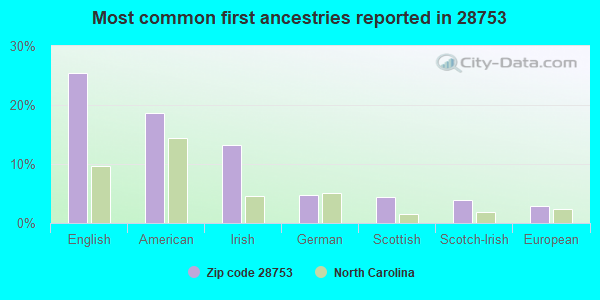
25%English
19%American
13%Irish
5%German
4%Scottish
4%Scotch-Irish
3%European
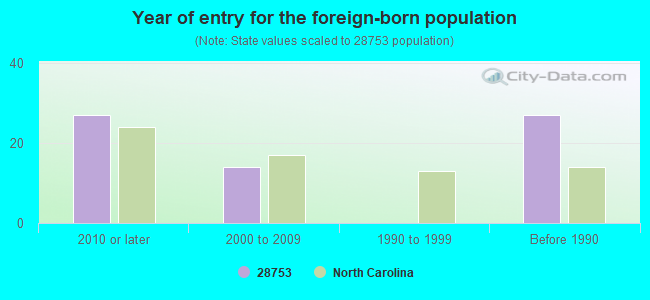
Year of entry for the foreign-born population
272010 or later
142000 to 2009
01990 to 1999
27Before 1990
Facilities with environmental interests located in this zip code:
BRUSH CREEK ELEMENTARY (265 UPPER BRUSH CREEK ROAD in MARSHALL, NC)
STATE MASTER (North Carolina facility info) - UNDERGROUND STORAGE TANK PROGRAM (National Center for Education Statistics) - STATE ID-306 Business SIC classification: NONCLASSIFIABLE ESTABLISHMENTS Organizations: MADISON COUNTY SCHOOLS (SCHOOL DISTRICT)
Alternative names: BRUSH CREEK ELEMENTARY SCHL
AUMAN, WILLIAM D. - RESIDENCE (401 RIVER ROAD in MARSHALL, NC)
STATE MASTER (North Carolina facility info) - -115DA4YG00M29W84AY3V89QV89, WASTEWATER FACILITY National Pollutant Discharge Elimination System NON-MAJOR (Tracking pollutant discharge elimination systems) - permit Business SIC classification: SEWERAGE SYSTEMS Alternative names: WILLIAM D AUMAN - SFR
ARBEE MANUFACTURING (2 MATO ROAD in MARSHALL, NC)
(Resource Conservation and Recovery Act (tracking hazardous waste)) Organizations: WILLIAM STUMP (CONTACT/OWNER)
DERINGER MANUFACTURING COMPANY (155 DERINGER RD in MARSHALL, NC)
HAZARDOUS WASTE BIENNIAL REPORTER (Resource Conservation and Recovery Act (tracking hazardous waste)) Small Quantity Generators, between 100 kg and 1000 kg of hazardous waste/month (Resource Conservation and Recovery Act (tracking hazardous waste)) - notification Organizations: DERINGER MFG CO (CONTACT/OWNER)
Housing units lacking complete plumbing facilities: 5.9% Housing units lacking complete kitchen facilities: 2.4%
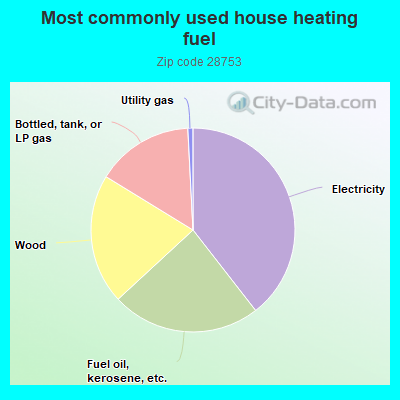
39.4%Electricity
23.6%Fuel oil, kerosene, etc.
20.6%Wood
15.4%Bottled, tank, or LP gas
0.8%Utility gas
Population in 1990: 7,623. Population change in the 1990s: +2,546 (+33.4%).
Place of birth for U.S.-born residents:
This state: 6,870
Northeast: 482
Midwest: 666
South: 1,838
West: 172
64% of the 28753 zip code residents lived in the same house 5 years ago. Out of people who lived in different houses, 46% lived in this county. Out of people who lived in different counties, 50% lived in North Carolina.
94% of the 28753 zip code residents lived in the same house 1 year ago. Out of people who lived in different houses, 31% moved from this county. Out of people who lived in different houses, 42% moved from different county within same state. Out of people who lived in different houses, 32% moved from different state. Out of people who lived in different houses, 5% moved from abroad.
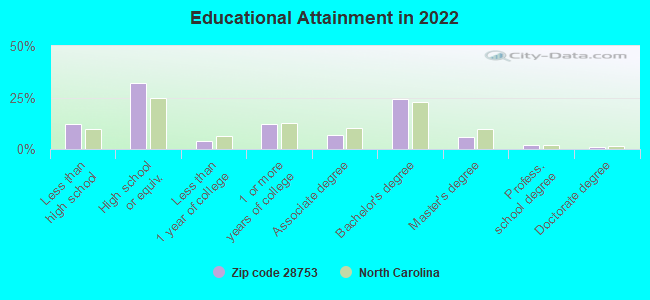
Private vs. public school enrollment:
Students in private schools in grades 1 to 8 (elementary and middle school): 216
Here:
31.6%
North Carolina:
13.8%
Students in private schools in grades 9 to 12 (high school): 192
Here:
41.1%
North Carolina:
11.9%
Students in private undergraduate colleges:
Here:
0.0%
North Carolina:
19.3%
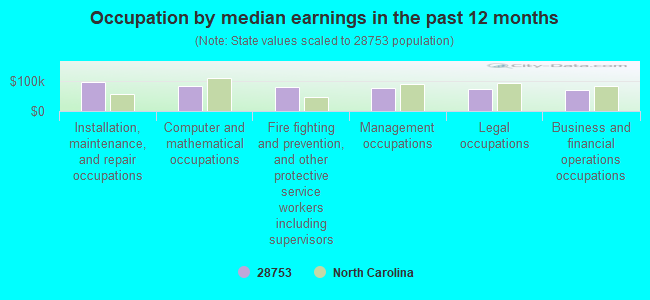
Occupation by median earnings in the past 12 months ($)
98,231Installation, maintenance, and repair occupations
84,603Computer and mathematical occupations
80,482Fire fighting and prevention, and other protective service workers including supervisors
78,209Management occupations
74,458Legal occupations
70,105Business and financial operations occupations
Top industries in this zip code by the number of employees in 2005:
Health Care and Social Assistance: Home Health Care Services (50-99 employees: 1 establishment, 1-4 employees: 1 establishment)
Health Care and Social Assistance: Nursing Care Facilities (50-99: 1)
Utilities: Hydroelectric Power Generation (50-99: 1)
Construction: New Single-Family Housing Construction (except Operative Builders) (5-9: 2, 1-4: 10)
Wholesale Trade: Other Grocery and Related Products Merchant Wholesalers (20-49: 1)
People in group quarters in 2010:
96 people in nursing facilities/skilled-nursing facilities
31 people in local jails and other municipal confinement facilities
23 people in group homes intended for adults
7 people in workers' group living quarters and job corps centers
3 people in residential treatment centers for adults
People in group quarters in 2000:
79 people in hospitals/wards and hospices for chronically ill
79 people in other hospitals or wards for chronically ill
16 people in orthopedic wards and institutions for the physically handicapped
14 people in other noninstitutional group quarters
12 people in local jails and other confinement facilities (including police lockups)
Fatal accident statistics in 2014:
Fatal accident count: 2
Vehicles involved in fatal accidents: 2
Fatal accidents caused by drunken drivers: 1
Fatalities: 3
Persons involved in fatal accidents: 4
Pedestrians involved in fatal accidents: 0
Fatal accident statistics in 2013:
Fatal accident count: 2
Vehicles involved in fatal accidents: 3
Fatal accidents caused by drunken drivers: 1
Fatalities: 2
Persons involved in fatal accidents: 3
Pedestrians involved in fatal accidents: 0
2002 - 2018 National Fire Incident Reporting System (NFIRS) incidents
Based on the data from the years 2002 - 2018 the average number of fires per year is 41. The highest number of fire incidents - 88 took place in 2011, and the least - 9 in 2017. The data has a decreasing trend.
When looking into fire subcategories, the most incidents belonged to: Outside Fires (43.2%), and Structure Fires (38.8%).
Fire incident types reported to NFIRS in Zip Code 28753


 Nearest zip codes: 28701, 28743, 28754, 37657, 28748, 28787.


 Based on the data from the years 2002 - 2018 the average number of fires per year is 41. The highest number of fire incidents - 88 took place in 2011, and the least - 9 in 2017. The data has a decreasing trend.
 When looking into fire subcategories, the most incidents belonged to: Outside Fires (43.2%), and Structure Fires (38.8%).