Estimated zip code population in 2022: 2,328 Zip code population in 2010: 2,440 Zip code population in 2000: 2,327
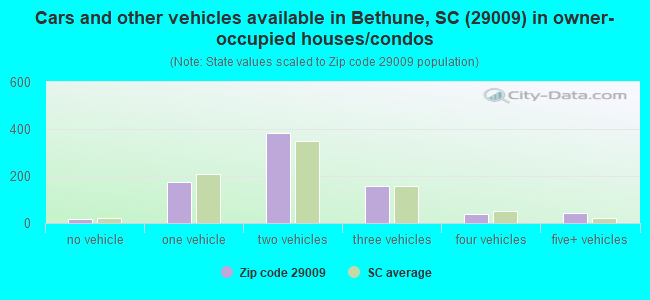
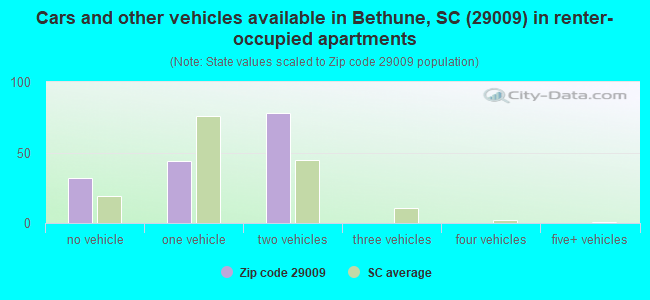
Houses and condos: 1,219 Renter-occupied apartments: 154
% of renters here:
16%
State:
28%
March 2022 cost of living index in zip code 29009: 80.4 (low, U.S. average is 100)
Land area: 108.2 sq. mi. Water area: 0.3 sq. mi.
Population density: 22 people per square mile
(very low).
OSM Map
General Map
Google Map
MSN Map
OSM Map
General Map
Google Map
MSN Map
OSM Map
General Map
Google Map
MSN Map
OSM Map
General Map
Google Map
MSN Map
Please wait while loading the map...
Real estate property taxes paid for housing units in 2022:
This zip code:
0.4% ($444)
South Carolina:
0.5% ($1,185)
Median real estate property taxes paid for housing units with mortgages in 2022: $837 (0.6%) Median real estate property taxes paid for housing units with no mortgage in 2022: $345 (0.4%)
Business Search- 14 Million verified businesses
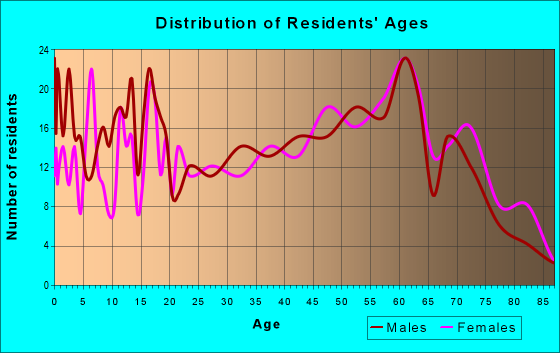
Males: 1,180
(50.7%)
Females: 1,147
(49.3%)
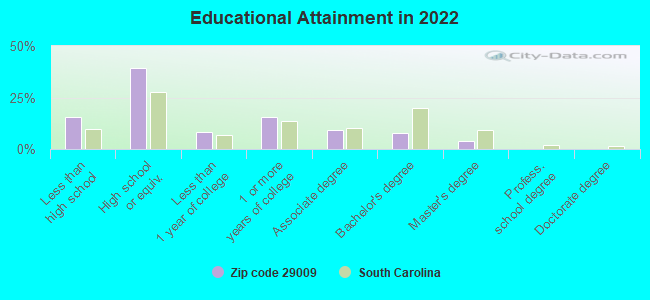
For population 25 years and over in 29009:
High school or higher: 83.0%
Bachelor's degree or higher: 11.8%
Graduate or professional degree: 4.0%
Unemployed: 8.3%
Mean travel time to work (commute): 31.7 minutes
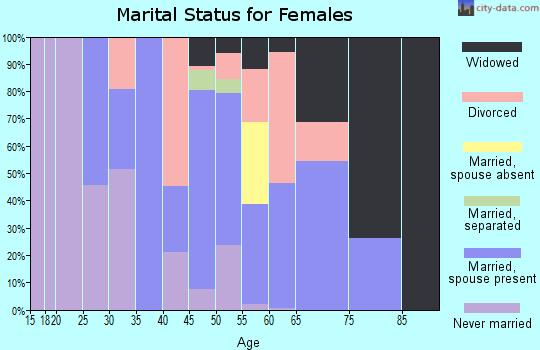
For population 15 years and over in 29009:
Never married: 33.8%
Now married: 50.2%
Separated: 0.0%
Widowed: 9.1%
Divorced: 6.9%
Zip code 29009 compared to state average:
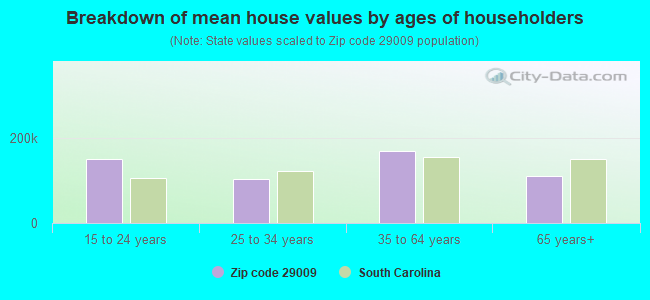
Median house value below state average.
Unemployed percentage above state average.
Hispanic race population percentage below state average.
Foreign-born population percentage significantly below state average.
Renting percentage below state average.
Length of stay since moving in significantly above state average.
Percentage of population with a bachelor's degree or higher significantly below state average.
Estimated median house/condo value in 2022: $117,997
29009:
$117,997
South Carolina:
$254,600
According to our research of South Carolina and other state lists, there were 2 registered sex offenders living in 29009 zip code as of May 23, 2024. The ratio of all residents to sex offenders in zip code 29009 is 1,252 to 1. The ratio of registered sex offenders to all residents in this zip code is near the state average.
Median resident age:
This zip code:
42.9 years
South Carolina median age:
40.5 years
Average household size:
This zip code:
2.4 people
South Carolina:
2.4 people
Averages for the 2020 tax year for zip code 29009, filed in 2021:
Average Adjusted Gross Income (AGI) in 2020: $45,398 (Individual Income Tax Returns)
Here:
$45,398
State:
$65,754
Salary/wage: $39,410 (reported on 81.0% of returns)
Here:
$39,410
State:
$52,566
(% of AGI for various income ranges: 1172.0% for AGIs below $25k, 3736.8% for AGIs $25k-50k, 7562.2% for AGIs $50k-75k, 11520.0% for AGIs $75k-100k, 21927.5% for AGIs $100k-200k)
Taxable interest for individuals: $852 (reported on 23.0% of returns)
This zip code:
$852
South Carolina:
$1,749
(% of AGI for various income ranges: 12.7% for AGIs below $25k, 12.7% for AGIs $25k-50k, 70.0% for AGIs $50k-75k, 47.5% for AGIs $75k-100k, 120.0% for AGIs $100k-200k)
Ordinary dividends: $2,340 (reported on 10.0% of returns)
Here:
$2,340
State:
$8,783
(% of AGI for various income ranges: 6.3% for AGIs below $25k, 15.9% for AGIs $25k-50k, 62.2% for AGIs $50k-75k, 310.0% for AGIs $100k-200k)
Net capital gain/loss in AGI: +$3,130 (reported on 10.0% of returns)
Here:
+$3,130
State:
+$24,194
(% of AGI for various income ranges: 10.0% for AGIs below $25k, 35.0% for AGIs $25k-50k, 78.9% for AGIs $50k-75k, 337.5% for AGIs $100k-200k)
Profit/loss from business: +$9,425 (reported on 12.0% of returns)
Here:
+$9,425
State:
+$11,253
(% of AGI for various income ranges: 167.7% for AGIs below $25k, 141.8% for AGIs $25k-50k, 790.0% for AGIs $75k-100k)
Taxable individual retirement arrangement distribution: $16,111 (reported on 9.0% of returns)
29009:
$16,111
South Carolina:
$21,604
(% of AGI for various income ranges: 63.7% for AGIs below $25k, 221.4% for AGIs $25k-50k, 1930.0% for AGIs $75k-100k)
Total itemized deductions: $28,100 (reported on 4.0% of returns)
Here:
$28,100
State:
$35,199
(% of AGI for various income ranges: 172.7% for AGIs below $25k, 1515.0% for AGIs $75k-100k)
Charity contributions: $8,933 (reported on 3.0% of returns)
Here:
$8,933
State:
$14,319
(% of AGI for various income ranges: 297.8% for AGIs $50k-75k)
Taxes paid: $6,500 (reported on 4.0% of returns)
29009:
$6,500
State:
$7,486
(% of AGI for various income ranges: 650.0% for AGIs $75k-100k)
Earned income credit: $2,585 (reported on 26.0% of returns)
Here:
$2,585
State:
$2,397
(% of AGI for various income ranges: 147.0% for AGIs below $25k, 105.0% for AGIs $25k-50k)
Percentage of individuals using paid preparers for their 2020 taxes: 94.0%
Here:
94%
State:
93%
(% for various income ranges: 92.5% for AGIs below $25k, 96.6% for AGIs $25k-50k, 93.3% for AGIs $50k-75k, 100.0% for AGIs $75k-100k, 88.9% for AGIs $100k-200k)
Averages for the 2012 tax year for zip code 29009, filed in 2013:
Average Adjusted Gross Income (AGI) in 2012: $35,263 (Individual Income Tax Returns)
Here:
$35,263
State:
$51,133
Salary/wage: $31,412 (reported on 79.8% of returns)
Here:
$31,412
State:
$42,173
(% of AGI for various income ranges: 68.1% for AGIs below $25k, 75.3% for AGIs $25k-50k, 83.5% for AGIs $50k-75k, 70.3% for AGIs $75k-100k, 55.0% for AGIs $100k-200k)
Taxable interest for individuals: $681 (reported on 28.7% of returns)
This zip code:
$681
South Carolina:
$1,468
(% of AGI for various income ranges: 0.7% for AGIs below $25k, 0.6% for AGIs $25k-50k, 0.2% for AGIs $50k-75k, 0.6% for AGIs $75k-100k, 0.7% for AGIs $100k-200k)
Ordinary dividends: $1,992 (reported on 12.8% of returns)
Here:
$1,992
State:
$6,511
(% of AGI for various income ranges: 0.7% for AGIs below $25k, 0.6% for AGIs $25k-50k, 0.2% for AGIs $75k-100k, 2.2% for AGIs $100k-200k)
Net capital gain/loss in AGI: +$5,683 (reported on 6.4% of returns)
Here:
+$5,683
State:
+$13,061
Profit/loss from business: +$6,258 (reported on 12.8% of returns)
Here:
+$6,258
State:
+$10,167
(% of AGI for various income ranges: 6.0% for AGIs below $25k, 3.1% for AGIs $25k-50k, 1.5% for AGIs $50k-75k)
Taxable individual retirement arrangement distribution: $9,189 (reported on 9.6% of returns)
29009:
$9,189
South Carolina:
$17,019
(% of AGI for various income ranges: 3.6% for AGIs below $25k, 3.0% for AGIs $25k-50k, 5.2% for AGIs $50k-75k)
Total itemized deductions: $17,082 (25% of AGI, reported on 18.1% of returns)
Here:
$17,082
State:
$22,890
Here:
24.9% of AGI
State:
21.4% of AGI
(% of AGI for various income ranges: 3.9% for AGIs below $25k, 6.8% for AGIs $25k-50k, 11.2% for AGIs $50k-75k, 12.7% for AGIs $75k-100k, 10.7% for AGIs $100k-200k)
Charity contributions: $4,171 (reported on 14.9% of returns)
Here:
$4,171
State:
$5,169
(% of AGI for various income ranges: 1.8% for AGIs $25k-50k, 1.8% for AGIs $50k-75k, 2.8% for AGIs $75k-100k, 2.5% for AGIs $100k-200k)
Taxes paid: $4,653 (reported on 18.1% of returns)
29009:
$4,653
State:
$7,644
(% of AGI for various income ranges: 1.4% for AGIs $25k-50k, 3.1% for AGIs $50k-75k, 3.5% for AGIs $75k-100k, 4.7% for AGIs $100k-200k)
Earned income credit: $2,297 (reported on 30.9% of returns)
Here:
$2,297
State:
$2,418
(% of AGI for various income ranges: 8.7% for AGIs below $25k, 1.5% for AGIs $25k-50k)
Percentage of individuals using paid preparers for their 2012 taxes: 63.8%
Here:
64%
State:
57%
(% for various income ranges: 58.7% for AGIs below $25k, 66.7% for AGIs $25k-50k, 70.0% for AGIs $50k-75k, 71.4% for AGIs $75k-100k, 75.0% for AGIs $100k-200k)
Averages for the 2004 tax year for zip code 29009, filed in 2005:
Average Adjusted Gross Income (AGI) in 2004: $31,237 (Individual Income Tax Returns)
Here:
$31,237
State:
$41,965
Salary/wage: $28,406 (reported on 84.7% of returns)
Here:
$28,406
State:
$35,695
(% of AGI for various income ranges: 92.5% for AGIs below $10k, 73.8% for AGIs $10k-25k, 81.1% for AGIs $25k-50k, 81.6% for AGIs $50k-75k, 75.5% for AGIs $75k-100k, 56.2% for AGIs over 100k)
Taxable interest for individuals: $816 (reported on 38.3% of returns)
This zip code:
$816
South Carolina:
$1,623
(% of AGI for various income ranges: 3.0% for AGIs below $10k, 1.8% for AGIs $10k-25k, 0.9% for AGIs $25k-50k, 0.8% for AGIs $50k-75k, 0.6% for AGIs $75k-100k, 0.3% for AGIs over 100k)
Taxable dividends: $915 (reported on 14.3% of returns)
Here:
$915
State:
$3,999
(% of AGI for various income ranges: 1.6% for AGIs below $10k, 0.9% for AGIs $10k-25k, 0.2% for AGIs $25k-50k, 0.3% for AGIs $50k-75k, 0.5% for AGIs $75k-100k)
Net capital gain/loss: +$1,684 (reported on 8.0% of returns)
Here:
+$1,684
State:
+$13,100
(% of AGI for various income ranges: 0.0% for AGIs $10k-25k, 1.0% for AGIs $25k-50k, -0.0% for AGIs $50k-75k, 0.6% for AGIs $75k-100k)
Profit/loss from business: +$4,628 (reported on 11.4% of returns)
Here:
+$4,628
State:
+$9,144
(% of AGI for various income ranges: 4.0% for AGIs below $10k, 3.6% for AGIs $10k-25k, 2.6% for AGIs $25k-50k, 0.2% for AGIs $50k-75k, 0.4% for AGIs $75k-100k)
IRA payment deduction: $1,583 (reported on 1.2% of returns)
29009:
$1,583
South Carolina:
$2,972
Total itemized deductions: $14,218 (25% of AGI, reported on 20.8% of returns)
Here:
$14,218
State:
$19,039
Here:
25.2% of AGI
State:
22.8% of AGI
(% of AGI for various income ranges: 5.4% for AGIs $10k-25k, 9.3% for AGIs $25k-50k, 10.1% for AGIs $50k-75k, 13.9% for AGIs $75k-100k, 11.6% for AGIs over 100k)
Charity contributions deductions: $3,411 (6% of AGI, reported on 18.1% of returns)
Here:
$3,411
State:
$4,305
Here:
6.0% of AGI
State:
5.0% of AGI
(% of AGI for various income ranges: 1.2% for AGIs $10k-25k, 1.8% for AGIs $25k-50k, 1.9% for AGIs $50k-75k, 2.8% for AGIs $75k-100k, 3.5% for AGIs over 100k)
Total tax: $3,561 (reported on 67.7% of returns)
29009:
$3,561
State:
$6,497
(% of AGI for various income ranges: 2.3% for AGIs below $10k, 3.2% for AGIs $10k-25k, 5.9% for AGIs $25k-50k, 8.9% for AGIs $50k-75k, 11.0% for AGIs $75k-100k, 16.3% for AGIs over 100k)
Earned income credit: $1,874 (reported on 27.2% of returns)
Here:
$1,874
State:
$1,882
Percentage of individuals using paid preparers for their 2004 taxes: 75.6%
Here:
76%
State:
66%
(% for various income ranges: 67.8% for AGIs below $10k, 79.4% for AGIs $10k-25k, 73.9% for AGIs $25k-50k, 78.1% for AGIs $50k-75k, 82.8% for AGIs $75k-100k, 72.7% for AGIs over 100k)
Household received Food Stamps/SNAP in the past 12 months: 114 Household did not receive Food Stamps/SNAP in the past 12 months: 842
Women who had a birth in the past 12 months: 10 (1 now married, 8 unmarried) Women who did not have a birth in the past 12 months: 445 (128 now married, 315 unmarried)
Housing units in zip code 29009 with a mortgage: 232 (11 second mortgage, 9 both second mortgage and home equity loan) Houses without a mortgage: 46
Median monthly owner costs for units with a mortgage: $1,048 Median monthly owner costs for units without a mortgage: $280
Residents with income below the poverty level in 2022:
This zip code:
12.1%
Whole state:
14.0%
Residents with income below 50% of the poverty level in 2022:
This zip code:
8.2%
Whole state:
7.3%
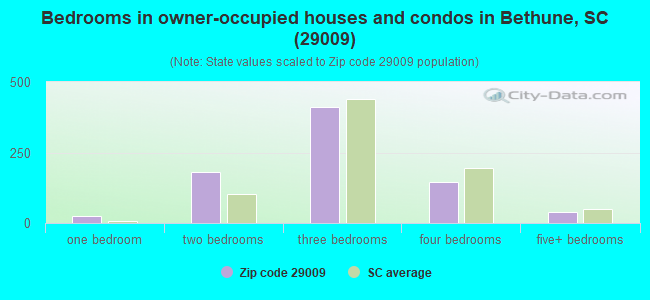
Median number of rooms in houses and condos:
Here:
6.1
State:
6.4
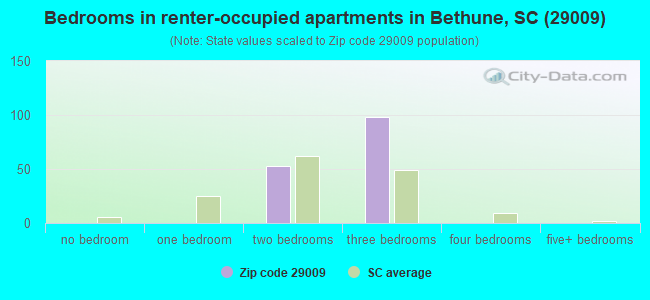
Median number of rooms in apartments:
Here:
5.1
State:
4.5
Notable locations in this zip code not listed on our city pages
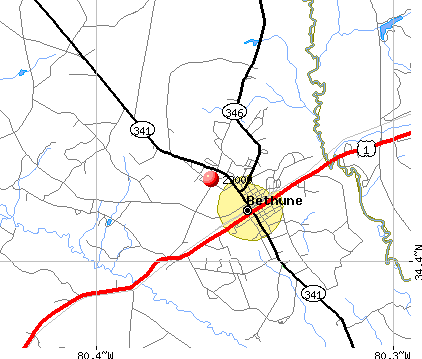
Notable locations in zip code 29009: Bethune City Hall (A), Bethune Public Library (B), Kershaw County Fire Station Bethune (C). Display/hide their locations on the map
Churches in zip code 29009 include: Sandy Grove Church (A), Shamrock Church (B), Mount Pleasant Church (C), Catoe Church (D), Bethune Baptist Church (E), Harmony Baptist Church (F), Harmony Church (G), Bethel Hill Church (H), Mills Creek Church (I). Display/hide their locations on the map
Lakes and reservoirs: Bakers Millpond (A), Stevens Millpond (B), Hough Millpond (C), Ford Pond (D), Ratliff Millpond (E), Raley Millpond (F), Ratliff Millpond (G), Hortons Pond (H). Display/hide their locations on the map
Streams, rivers, and creeks: Big Sandy Creek (A), Shirley Creek (B), Red Oak Camp Creek (C), Mills Creek (D), Buffalo Creek (E), Hammond Branch (F), Jumping Gully (G), Little Lynches River (H), Little Sandy Creek (I). Display/hide their locations on the map
Size of family households: 458 2-persons, 105 3-persons, 56 4-persons, 28 5-persons, 28 6-persons, 6 7-or-more-persons
Size of nonfamily households: 241 1-person, 40 2-persons
82 married couples with children.
165 single-parent households (34 men, 131 women).
97.0% of residents of 29009 zip code speak English at home.
3.2% of residents speak Spanish at home (32% very well, 62% well, 6% not well).
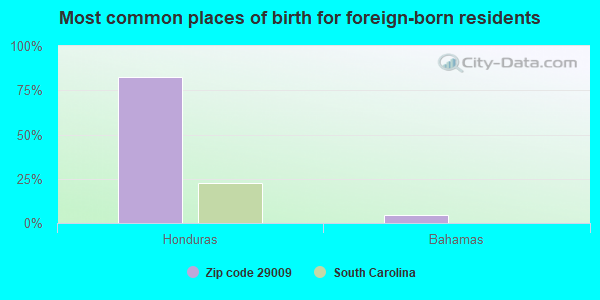
Foreign born population: 24 (1.0%) (72.6% of them are naturalized citizens)
This zip code:
1.0%
Whole state:
5.2%
83%Honduras
4%Bahamas
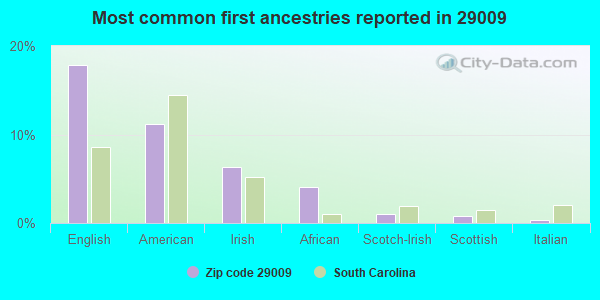
18%English
11%American
6%Irish
4%African
1%Scotch-Irish
1%Scottish
0%Italian
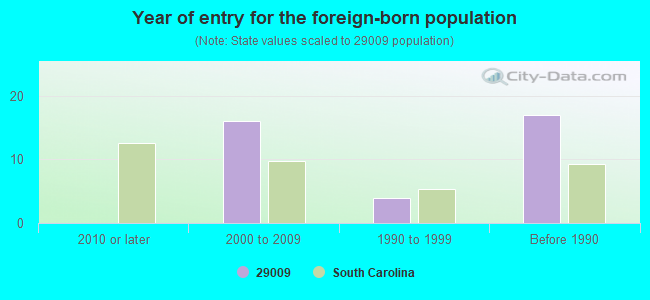
Year of entry for the foreign-born population
02010 or later
162000 to 2009
41990 to 1999
17Before 1990
Facilities with environmental interests located in this zip code:
BBA NONWOVENS BETHUNE (500 CHESTNUT ST in BETHUNE, SC)
AIR SYNTHETIC MINOR (AIRS/AFS) CRITERIA AND HAZARDOUS AIR POLLUTANT INVENTORY (Inventory of air pollution sources) National Pollutant Discharge Elimination System MAJOR (Tracking pollutant discharge elimination systems) - permit National Pollutant Discharge Elimination System NON-MAJOR (Tracking pollutant discharge elimination systems) - permit HAZARDOUS WASTE BIENNIAL REPORTER (Resource Conservation and Recovery Act (tracking hazardous waste)) Small Quantity Generators, between 100 kg and 1000 kg of hazardous waste/month (Resource Conservation and Recovery Act (tracking hazardous waste)) - notification STATE MASTER (South Carolina database) - AIR PROGRAM, AIR MAJOR, LABORATORY CERTIFICATION, AIR PROGRAM, TRI REPORTER, National Pollutant Discharge Elimination System Permit, HAZARDOUS WASTE PROGRAM, DRINKING WATER SYSTEM STATE MASTER (South Carolina database) - DRINKING WATER PROGRAM STATE MASTER (South Carolina database) TRI REPORTER (Tracking of toxic chemicals releasing facilities) Business SIC classification: BROADWOVEN FABRIC MILLS, COTTON; KNITTING MILLS; FINISHERS OF BROADWOVEN FABRICS OF COTTON; FINISHERS OF BROADWOVEN FABRICS OF MANMADE FIBER AND SILK; FINISHERS OF TEXTILES; NONWOVEN FABRICS Organizations: REEMAY INC DBA BBA FIBERWEB (CONTACT/OPERATOR)
, BBA NONWOVENS SIMPSONVILLE INC (CONTACT/OWNER)
, BBA FIBERWEB/BETHUNE (CONTACT/OWNER)
, REEMAY INC DBA BBA FIBERWEB (CONTACT/OWNER)
Alternative names: BBA FIBERWEB/BETHUNE, BBA NONWOVENS SIMPSONVILLE INC, VERATEC
AN WEBBER TRUCKING INCORPORATED (HIGHWAY 1 NORTH in BETHUNE, SC)
(Resource Conservation and Recovery Act (tracking hazardous waste)) STATE MASTER (South Carolina database) - HAZARDOUS WASTE PROGRAM STATE MASTER (South Carolina database) - UNDERGROUND STORAGE TANK PROGRAM Organizations: OPERNAME (CONTACT/OPERATOR)
, A N WEBBER JR (CONTACT/OWNER)
Alternative names: A N WEBBER TRUCKING
COLGATE PALMOLIVE COMPANY (500 CHESTNUT STREET in BETHUNE, SC)
AIR MINOR (AIRS/AFS) (Resource Conservation and Recovery Act (tracking hazardous waste)) STATE MASTER (South Carolina database) - AIR PROGRAM, TRI REPORTER, HAZARDOUS WASTE PROGRAM TRI REPORTER (Tracking of toxic chemicals releasing facilities) Business SIC classification: SOAP AND OTHER DETERGENTS, EXCEPT SPECIALTY CLEANERS; SERVICES Organizations: INTERNATIONAL PAPER (CONTACT/OWNER)
Alternative names: COLGATE HOUSEHOLD PROD
CAL MAINE ADAMS MILL (102 WALTON ST NORTH in BETHUNE, SC)
AIR MINOR (AIRS/AFS) CRITERIA AND HAZARDOUS AIR POLLUTANT INVENTORY (Inventory of air pollution sources) STATE MASTER (South Carolina database) - AIR PROGRAM Business SIC classification: PREPARED FEEDS AND FEED INGREDIENTS FOR ANIMALS AND FOWLS, EXCEPT DOGS AND CATS Alternative names: CAL-MAINE FOODS
CAL MAINE FARMS INC (3987 PORTER RD in BETHUNE, SC)
Small Quantity Generators, between 100 kg and 1000 kg of hazardous waste/month (Resource Conservation and Recovery Act (tracking hazardous waste)) STATE MASTER (South Carolina database) - HAZARDOUS WASTE PROGRAM Organizations: CAL MAINE FOODS INC (CONTACT/OPERATOR)
BETHUNE ELEMENTARY SCHOOL (302 NORWOOD STREET in BETHUNE, SC)
(National Center for Education Statistics) - STATE ID-2801011 Organizations: KERSHAW COUNTY SCHOOL DISTRICT (SCHOOL DISTRICT)
CSX TRANSPORTATION BETHUNE (DEACT) (MAIN STREET SR341 AT CSXT RR TRK in BETHUNE, SC)
(Resource Conservation and Recovery Act (tracking hazardous waste)) Organizations: OPERNAME (CONTACT/OPERATOR)
, CSX TRANSPORTATION INC. (CONTACT/OWNER)
CAROLINA GAS TRANSMISSION CORP (ONE MILE E OF BETHUNE in BETHUNE, SC)
National Pollutant Discharge Elimination System NON-MAJOR (Tracking pollutant discharge elimination systems) - permit Business SIC classification: NATURAL GAS TRANSMISSION Alternative names: SOUTH CAROLINA PIPELINE CORP
Housing units lacking complete plumbing facilities: 2.4% Housing units lacking complete kitchen facilities: 6.7%
72.6%Electricity
13.9%Bottled, tank, or LP gas
11.9%Utility gas
1.0%Wood
0.7%Fuel oil, kerosene, etc.
Population in 1990: 2,172. Population change in the 1990s: +155 (+7.1%).
Place of birth for U.S.-born residents:
This state: 1,693
Northeast: 103
Midwest: 68
South: 338
West: 55
71% of the 29009 zip code residents lived in the same house 5 years ago. Out of people who lived in different houses, 64% lived in this county. Out of people who lived in different counties, 50% lived in South Carolina.
90% of the 29009 zip code residents lived in the same house 1 year ago. Out of people who lived in different houses, 28% moved from this county. Out of people who lived in different houses, 3% moved from different county within same state. Out of people who lived in different houses, 31% moved from different state. Out of people who lived in different houses, 40% moved from abroad.
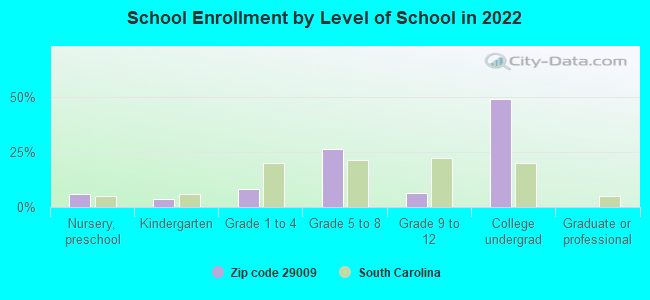
Private vs. public school enrollment:
Students in private schools in grades 1 to 8 (elementary and middle school):
Here:
0.0%
South Carolina:
14.4%
Students in private schools in grades 9 to 12 (high school): 9
Here:
29.4%
South Carolina:
11.1%
Students in private undergraduate colleges: 123
Here:
45.4%
South Carolina:
21.9%
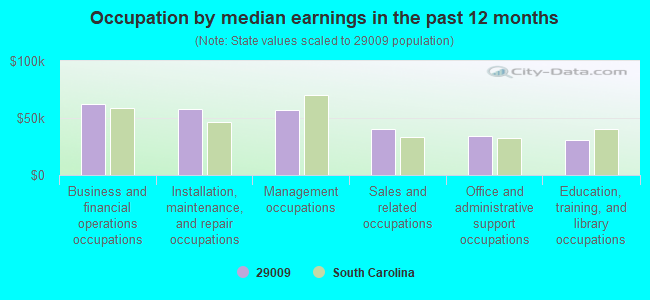
Occupation by median earnings in the past 12 months ($)
62,000Business and financial operations occupations
57,813Installation, maintenance, and repair occupations
57,140Management occupations
40,262Sales and related occupations
34,332Office and administrative support occupations
30,427Education, training, and library occupations
Top industries in this zip code by the number of employees in 2005:
Finance and Insurance: Commercial Banking (10-19 employees: 1 establishment)
Other Services (except Public Administration): Religious Organizations (1-4: 5)
Accommodation and Food Services: Full-Service Restaurants (5-9: 1)
People in group quarters in 2010:
4 people in group homes intended for adults
People in group quarters in 2000:
4 people in homes for the mentally retarded
Fatal accident statistics in 2014:
Fatal accident count: 1
Vehicles involved in fatal accidents: 1
Fatal accidents caused by drunken drivers: 0
Fatalities: 1
Persons involved in fatal accidents: 1
Pedestrians involved in fatal accidents: 0
Fatal accident statistics in 2013:
Fatal accident count: 2
Vehicles involved in fatal accidents: 2
Fatal accidents caused by drunken drivers: 1
Fatalities: 2
Persons involved in fatal accidents: 2
Pedestrians involved in fatal accidents: 0
Home Mortgage Disclosure Act Aggregated Statistics For Year 2009 (Based on 4 partial tracts)
A) FHA, FSA/RHS & VA Home Purchase Loans
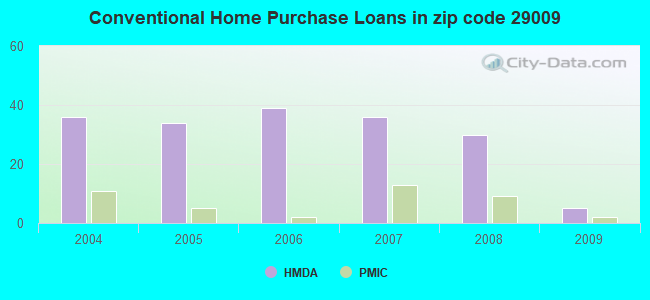
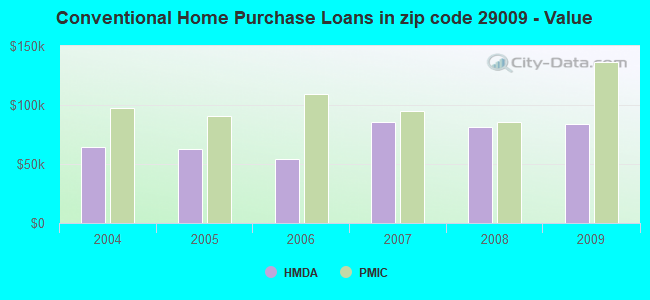
B) Conventional Home Purchase Loans
C) Refinancings
D) Home Improvement Loans
F) Non-occupant Loans on < 5 Family Dwellings (A B C & D)
G) Loans On Manufactured Home Dwelling (A B C & D)
Number
Average Value
Number
Average Value
Number
Average Value
Number
Average Value
Number
Average Value
Number
Average Value
LOANS ORIGINATED
10
$96,963
5
$84,072
33
$90,809
0
$0
2
$17,930
7
$55,080
APPLICATIONS APPROVED, NOT ACCEPTED
2
$70,010
3
$45,317
3
$128,217
0
$0
0
$0
3
$51,823
APPLICATIONS DENIED
3
$27,020
10
$39,596
31
$86,996
6
$35,297
0
$0
14
$30,434
APPLICATIONS WITHDRAWN
1
$142,000
0
$0
14
$101,284
0
$0
0
$0
0
$0
FILES CLOSED FOR INCOMPLETENESS
2
$127,215
0
$0
2
$145,845
0
$0
0
$0
0
$0
Aggregated Statistics For Year 2008 (Based on 4 partial tracts)
A) FHA, FSA/RHS & VA Home Purchase Loans
B) Conventional Home Purchase Loans
C) Refinancings
D) Home Improvement Loans
F) Non-occupant Loans on < 5 Family Dwellings (A B C & D)
G) Loans On Manufactured Home Dwelling (A B C & D)
Number
Average Value
Number
Average Value
Number
Average Value
Number
Average Value
Number
Average Value
Number
Average Value
LOANS ORIGINATED
8
$93,352
30
$81,581
23
$79,454
6
$37,157
8
$59,125
15
$48,373
APPLICATIONS APPROVED, NOT ACCEPTED
2
$21,345
5
$56,580
5
$117,482
0
$0
2
$43,545
8
$40,491
APPLICATIONS DENIED
4
$117,575
16
$61,752
30
$83,942
2
$61,035
0
$0
13
$56,453
APPLICATIONS WITHDRAWN
1
$83,870
2
$76,715
8
$136,398
0
$0
2
$41,835
1
$56,880
FILES CLOSED FOR INCOMPLETENESS
0
$0
0
$0
3
$126,460
0
$0
0
$0
0
$0
Aggregated Statistics For Year 2007 (Based on 4 partial tracts)
A) FHA, FSA/RHS & VA Home Purchase Loans
B) Conventional Home Purchase Loans
C) Refinancings
D) Home Improvement Loans
F) Non-occupant Loans on < 5 Family Dwellings (A B C & D)
G) Loans On Manufactured Home Dwelling (A B C & D)
Number
Average Value
Number
Average Value
Number
Average Value
Number
Average Value
Number
Average Value
Number
Average Value
LOANS ORIGINATED
6
$166,470
36
$85,369
48
$104,773
14
$40,832
7
$34,524
22
$45,566
APPLICATIONS APPROVED, NOT ACCEPTED
2
$38,420
6
$39,125
12
$79,813
2
$13,730
2
$51,230
8
$37,755
APPLICATIONS DENIED
1
$113,760
20
$53,806
48
$94,076
8
$29,884
2
$45,335
28
$49,453
APPLICATIONS WITHDRAWN
0
$0
4
$80,575
16
$113,206
0
$0
0
$0
0
$0
FILES CLOSED FOR INCOMPLETENESS
0
$0
0
$0
3
$108,510
0
$0
0
$0
0
$0
Aggregated Statistics For Year 2006 (Based on 4 partial tracts)
A) FHA, FSA/RHS & VA Home Purchase Loans
B) Conventional Home Purchase Loans
C) Refinancings
D) Home Improvement Loans
F) Non-occupant Loans on < 5 Family Dwellings (A B C & D)
G) Loans On Manufactured Home Dwelling (A B C & D)
Number
Average Value
Number
Average Value
Number
Average Value
Number
Average Value
Number
Average Value
Number
Average Value
LOANS ORIGINATED
6
$143,332
39
$54,307
29
$79,767
14
$43,271
10
$39,774
16
$49,300
APPLICATIONS APPROVED, NOT ACCEPTED
0
$0
11
$86,411
11
$59,826
2
$49,540
3
$100,750
5
$45,610
APPLICATIONS DENIED
0
$0
24
$74,413
50
$79,150
17
$25,072
3
$28,460
22
$35,120
APPLICATIONS WITHDRAWN
3
$104,737
2
$27,275
20
$69,671
0
$0
2
$38,420
4
$29,812
FILES CLOSED FOR INCOMPLETENESS
0
$0
0
$0
1
$129,540
0
$0
0
$0
0
$0
Aggregated Statistics For Year 2005 (Based on 4 partial tracts)
A) FHA, FSA/RHS & VA Home Purchase Loans
B) Conventional Home Purchase Loans
C) Refinancings
D) Home Improvement Loans
F) Non-occupant Loans on < 5 Family Dwellings (A B C & D)
G) Loans On Manufactured Home Dwelling (A B C & D)
Number
Average Value
Number
Average Value
Number
Average Value
Number
Average Value
Number
Average Value
Number
Average Value
LOANS ORIGINATED
4
$108,582
34
$62,770
40
$67,589
7
$22,834
7
$43,176
16
$48,619
APPLICATIONS APPROVED, NOT ACCEPTED
0
$0
12
$94,839
9
$49,131
1
$25,330
1
$29,890
9
$56,362
APPLICATIONS DENIED
0
$0
24
$50,396
49
$64,099
16
$36,456
3
$19,890
33
$42,282
APPLICATIONS WITHDRAWN
0
$0
4
$80,758
27
$85,140
2
$14,055
0
$0
3
$67,173
FILES CLOSED FOR INCOMPLETENESS
0
$0
0
$0
11
$99,385
0
$0
0
$0
2
$81,380
Aggregated Statistics For Year 2004 (Based on 4 partial tracts)
A) FHA, FSA/RHS & VA Home Purchase Loans
B) Conventional Home Purchase Loans
C) Refinancings
D) Home Improvement Loans
F) Non-occupant Loans on < 5 Family Dwellings (A B C & D)
G) Loans On Manufactured Home Dwelling (A B C & D)
Detailed PMIC statistics for the following Tracts:9701.00
, 9702.00
2004 - 2018 National Fire Incident Reporting System (NFIRS) incidents
According to the data from the years 2004 - 2018 the average number of fires per year is 10. The highest number of fire incidents - 22 took place in 2010, and the least - 0 in 2007. The data has a rising trend.
When looking into fire subcategories, the most reports belonged to: Outside Fires (52.7%), and Structure Fires (36.0%).
Fire incident types reported to NFIRS in Zip Code 29009
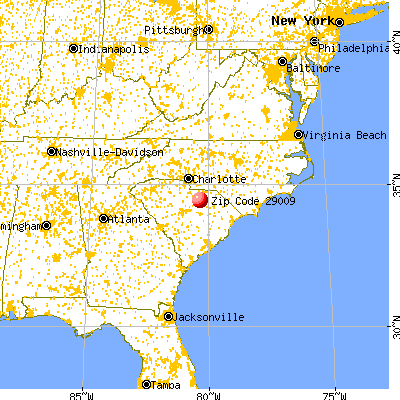


 Nearest zip codes: 29101, 29032, 29718, 29067, 29175, 29020.
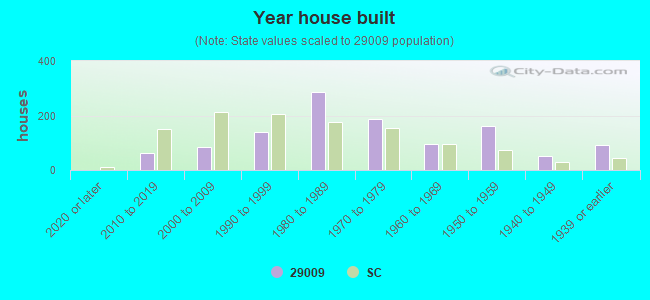


 According to the data from the years 2004 - 2018 the average number of fires per year is 10. The highest number of fire incidents - 22 took place in 2010, and the least - 0 in 2007. The data has a rising trend.
 When looking into fire subcategories, the most reports belonged to: Outside Fires (52.7%), and Structure Fires (36.0%).