Estimated zip code population in 2022: 11,232 Zip code population in 2010: 11,383 Zip code population in 2000: 11,102
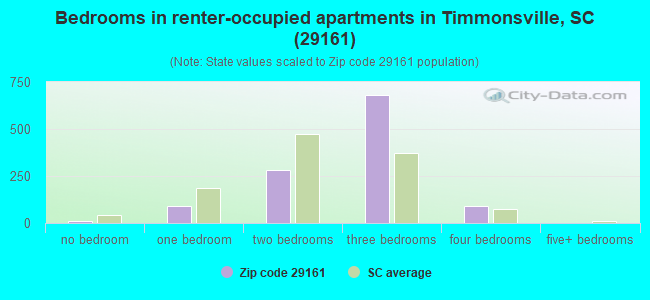
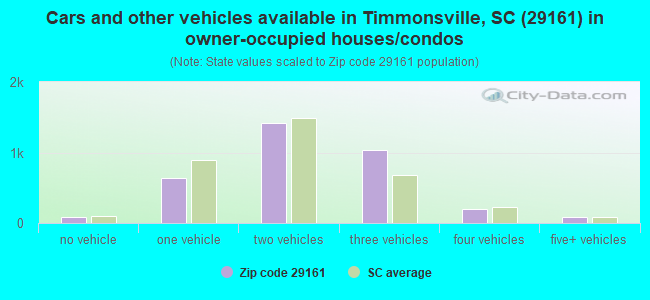
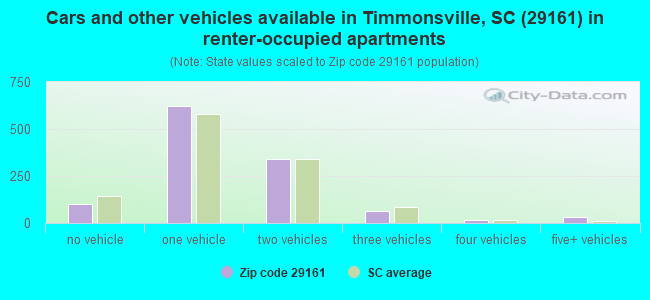
Houses and condos: 5,403 Renter-occupied apartments: 1,170
% of renters here:
25%
State:
28%
March 2022 cost of living index in zip code 29161: 80.4 (low, U.S. average is 100)
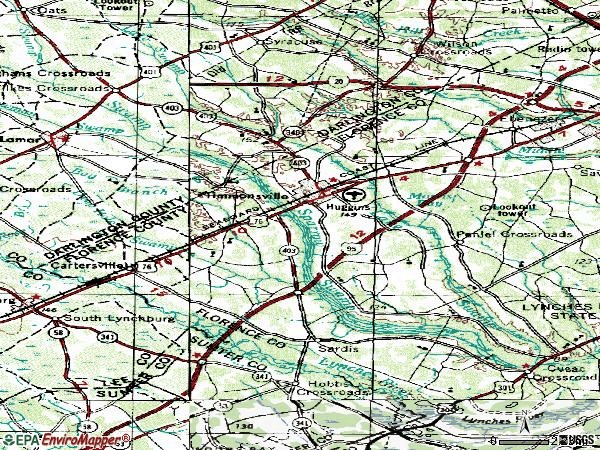
Land area: 134.6 sq. mi. Water area: 0.2 sq. mi.
Population density: 83 people per square mile
(very low).
OSM Map
General Map
Google Map
MSN Map
OSM Map
General Map
Google Map
MSN Map
OSM Map
General Map
Google Map
MSN Map
OSM Map
General Map
Google Map
MSN Map
Please wait while loading the map...
Real estate property taxes paid for housing units in 2022:
This zip code:
0.4% ($569)
South Carolina:
0.5% ($1,185)
Median real estate property taxes paid for housing units with mortgages in 2022: $885 (0.5%) Median real estate property taxes paid for housing units with no mortgage in 2022: $448 (0.4%)
Business Search- 14 Million verified businesses
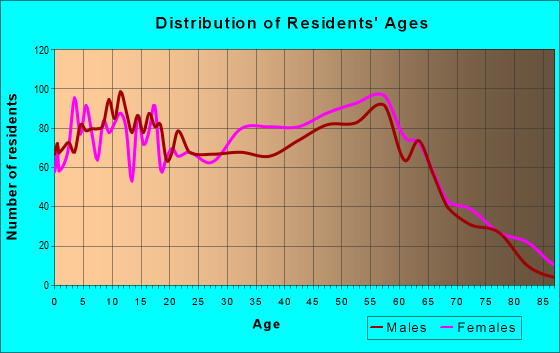
Males: 5,617
(50.0%)
Females: 5,613
(50.0%)
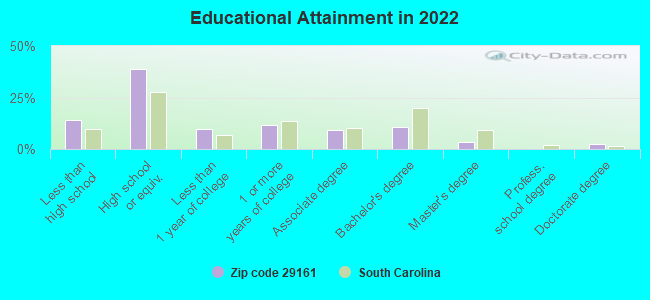
For population 25 years and over in 29161:
High school or higher: 84.7%
Bachelor's degree or higher: 16.6%
Graduate or professional degree: 5.9%
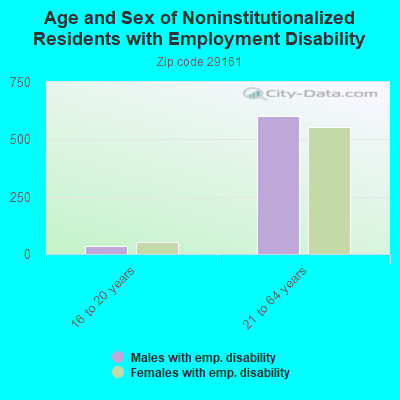
Unemployed: 4.3%
Mean travel time to work (commute): 23.8 minutes
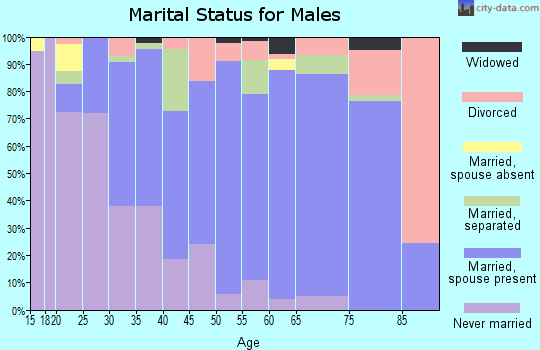
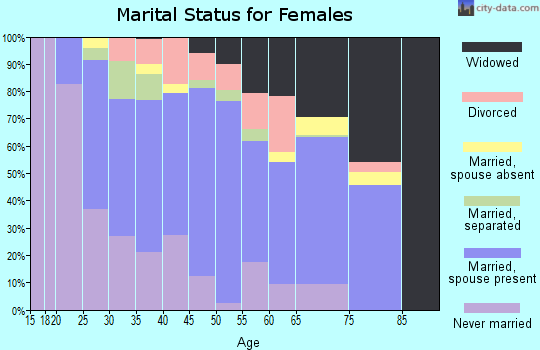
For population 15 years and over in 29161:
Never married: 34.1%
Now married: 48.9%
Separated: 0.9%
Widowed: 6.2%
Divorced: 10.0%
Zip code 29161 compared to state average:
Median house value below state average.
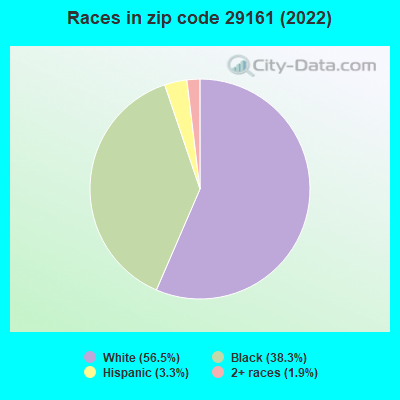
Hispanic race population percentage below state average.
Foreign-born population percentage significantly below state average.
Length of stay since moving in significantly above state average.
Number of college students below state average.
Percentage of population with a bachelor's degree or higher below state average.
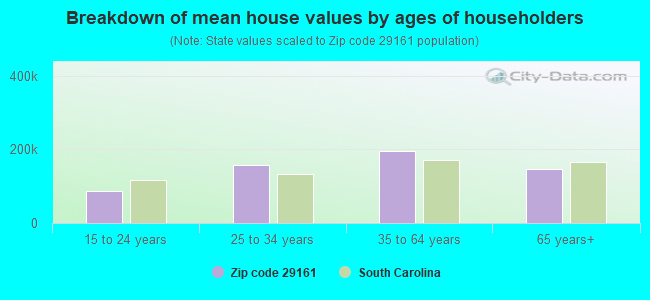
Estimated median house/condo value in 2022: $140,136
29161:
$140,136
South Carolina:
$254,600
According to our research of South Carolina and other state lists, there were 7 registered sex offenders living in 29161 zip code as of May 05, 2024. The ratio of all residents to sex offenders in zip code 29161 is 1,518 to 1. The ratio of registered sex offenders to all residents in this zip code is near the state average.
Median resident age:
This zip code:
43.9 years
South Carolina median age:
40.5 years
Average household size:
This zip code:
2.4 people
South Carolina:
2.4 people
Averages for the 2020 tax year for zip code 29161, filed in 2021:
Average Adjusted Gross Income (AGI) in 2020: $44,352 (Individual Income Tax Returns)
Here:
$44,352
State:
$65,754
Salary/wage: $40,426 (reported on 83.2% of returns)
Here:
$40,426
State:
$52,566
(% of AGI for various income ranges: 1269.0% for AGIs below $25k, 3926.3% for AGIs $25k-50k, 7093.7% for AGIs $50k-75k, 10005.7% for AGIs $75k-100k, 19023.8% for AGIs $100k-200k, 73240.0% for AGIs over 200k)
Taxable interest for individuals: $882 (reported on 16.4% of returns)
This zip code:
$882
South Carolina:
$1,749
(% of AGI for various income ranges: 4.6% for AGIs below $25k, 13.6% for AGIs $25k-50k, 17.4% for AGIs $50k-75k, 35.2% for AGIs $75k-100k, 121.4% for AGIs $100k-200k, 440.0% for AGIs over 200k)
Ordinary dividends: $4,008 (reported on 8.5% of returns)
Here:
$4,008
State:
$8,783
(% of AGI for various income ranges: 10.9% for AGIs below $25k, 18.4% for AGIs $25k-50k, 38.0% for AGIs $50k-75k, 79.0% for AGIs $75k-100k, 212.9% for AGIs $100k-200k, 2555.0% for AGIs over 200k)
Net capital gain/loss in AGI: +$8,717 (reported on 7.5% of returns)
Here:
+$8,717
State:
+$24,194
(% of AGI for various income ranges: 3.8% for AGIs below $25k, 9.4% for AGIs $25k-50k, 30.3% for AGIs $50k-75k, 108.1% for AGIs $75k-100k, 558.1% for AGIs $100k-200k, 6990.0% for AGIs over 200k)
Profit/loss from business: +$5,024 (reported on 15.4% of returns)
Here:
+$5,024
State:
+$11,253
(% of AGI for various income ranges: 89.8% for AGIs below $25k, 21.4% for AGIs $25k-50k, 166.0% for AGIs $50k-75k, 333.8% for AGIs $75k-100k, 343.8% for AGIs $100k-200k)
Taxable individual retirement arrangement distribution: $15,321 (reported on 7.2% of returns)
29161:
$15,321
South Carolina:
$21,604
(% of AGI for various income ranges: 36.6% for AGIs below $25k, 85.2% for AGIs $25k-50k, 219.7% for AGIs $50k-75k, 579.5% for AGIs $75k-100k, 875.7% for AGIs $100k-200k)
Total itemized deductions: $30,100 (reported on 3.4% of returns)
Here:
$30,100
State:
$35,199
(% of AGI for various income ranges: 42.6% for AGIs below $25k, 185.1% for AGIs $50k-75k, 392.9% for AGIs $75k-100k, 615.2% for AGIs $100k-200k, 6910.0% for AGIs over 200k)
Charity contributions: $13,792 (reported on 2.8% of returns)
Here:
$13,792
State:
$14,319
(% of AGI for various income ranges: 10.0% for AGIs below $25k, 60.3% for AGIs $50k-75k, 138.1% for AGIs $75k-100k, 196.2% for AGIs $100k-200k, 3615.0% for AGIs over 200k)
Taxes paid: $5,981 (reported on 3.4% of returns)
29161:
$5,981
State:
$7,486
(% of AGI for various income ranges: 3.5% for AGIs below $25k, 36.6% for AGIs $50k-75k, 64.3% for AGIs $75k-100k, 174.8% for AGIs $100k-200k, 1360.0% for AGIs over 200k)
Earned income credit: $2,510 (reported on 28.6% of returns)
Here:
$2,510
State:
$2,397
(% of AGI for various income ranges: 158.3% for AGIs below $25k, 92.5% for AGIs $25k-50k)
Percentage of individuals using paid preparers for their 2020 taxes: 93.6%
Here:
94%
State:
93%
(% for various income ranges: 93.2% for AGIs below $25k, 94.6% for AGIs $25k-50k, 94.3% for AGIs $50k-75k, 90.9% for AGIs $75k-100k, 94.9% for AGIs $100k-200k, 85.7% for AGIs over 200k)
Averages for the 2012 tax year for zip code 29161, filed in 2013:
Average Adjusted Gross Income (AGI) in 2012: $35,413 (Individual Income Tax Returns)
Here:
$35,413
State:
$51,133
Salary/wage: $32,209 (reported on 86.6% of returns)
Here:
$32,209
State:
$42,173
(% of AGI for various income ranges: 80.4% for AGIs below $25k, 83.0% for AGIs $25k-50k, 81.2% for AGIs $50k-75k, 76.4% for AGIs $75k-100k, 78.9% for AGIs $100k-200k, 52.9% for AGIs over 200k)
Taxable interest for individuals: $742 (reported on 19.5% of returns)
This zip code:
$742
South Carolina:
$1,468
(% of AGI for various income ranges: 0.5% for AGIs below $25k, 0.3% for AGIs $25k-50k, 0.3% for AGIs $50k-75k, 0.6% for AGIs $75k-100k, 0.4% for AGIs $100k-200k, 0.5% for AGIs over 200k)
Ordinary dividends: $3,402 (reported on 9.1% of returns)
Here:
$3,402
State:
$6,511
(% of AGI for various income ranges: 0.4% for AGIs below $25k, 0.3% for AGIs $25k-50k, 0.5% for AGIs $50k-75k, 1.1% for AGIs $75k-100k, 1.3% for AGIs $100k-200k, 4.4% for AGIs over 200k)
Net capital gain/loss in AGI: +$3,744 (reported on 8.9% of returns)
Here:
+$3,744
State:
+$13,061
(% of AGI for various income ranges: 0.3% for AGIs below $25k, 0.2% for AGIs $25k-50k, 0.9% for AGIs $50k-75k, 1.7% for AGIs $75k-100k, 2.4% for AGIs $100k-200k)
Profit/loss from business: +$4,585 (reported on 16.0% of returns)
Here:
+$4,585
State:
+$10,167
(% of AGI for various income ranges: 5.5% for AGIs below $25k, 1.3% for AGIs $25k-50k, 0.7% for AGIs $50k-75k, 1.1% for AGIs $75k-100k, 2.4% for AGIs $100k-200k)
Taxable individual retirement arrangement distribution: $13,300 (reported on 6.3% of returns)
29161:
$13,300
South Carolina:
$17,019
(% of AGI for various income ranges: 1.8% for AGIs below $25k, 2.1% for AGIs $25k-50k, 2.0% for AGIs $50k-75k, 3.1% for AGIs $75k-100k, 3.9% for AGIs $100k-200k)
Total itemized deductions: $18,551 (24% of AGI, reported on 18.0% of returns)
Here:
$18,551
State:
$22,890
Here:
23.9% of AGI
State:
21.4% of AGI
(% of AGI for various income ranges: 4.6% for AGIs below $25k, 7.2% for AGIs $25k-50k, 9.8% for AGIs $50k-75k, 11.5% for AGIs $75k-100k, 13.9% for AGIs $100k-200k, 14.8% for AGIs over 200k)
Charity contributions: $5,029 (reported on 15.2% of returns)
Here:
$5,029
State:
$5,169
(% of AGI for various income ranges: 0.7% for AGIs below $25k, 1.5% for AGIs $25k-50k, 2.5% for AGIs $50k-75k, 2.6% for AGIs $75k-100k, 3.3% for AGIs $100k-200k, 4.5% for AGIs over 200k)
Taxes paid: $5,405 (reported on 17.7% of returns)
29161:
$5,405
State:
$7,644
(% of AGI for various income ranges: 0.5% for AGIs below $25k, 1.2% for AGIs $25k-50k, 2.2% for AGIs $50k-75k, 3.5% for AGIs $75k-100k, 5.6% for AGIs $100k-200k, 7.0% for AGIs over 200k)
Earned income credit: $2,577 (reported on 36.1% of returns)
Here:
$2,577
State:
$2,418
(% of AGI for various income ranges: 11.6% for AGIs below $25k, 1.6% for AGIs $25k-50k)
Percentage of individuals using paid preparers for their 2012 taxes: 68.2%
Here:
68%
State:
57%
(% for various income ranges: 66.7% for AGIs below $25k, 68.1% for AGIs $25k-50k, 70.8% for AGIs $50k-75k, 73.3% for AGIs $75k-100k, 72.7% for AGIs $100k-200k, 66.7% for AGIs over 200k)
Averages for the 2004 tax year for zip code 29161, filed in 2005:
Average Adjusted Gross Income (AGI) in 2004: $30,404 (Individual Income Tax Returns)
Here:
$30,404
State:
$41,965
Salary/wage: $28,472 (reported on 90.1% of returns)
Here:
$28,472
State:
$35,695
(% of AGI for various income ranges: 102.4% for AGIs below $10k, 85.9% for AGIs $10k-25k, 86.0% for AGIs $25k-50k, 88.6% for AGIs $50k-75k, 84.3% for AGIs $75k-100k, 70.0% for AGIs over 100k)
Taxable interest for individuals: $1,348 (reported on 23.8% of returns)
This zip code:
$1,348
South Carolina:
$1,623
(% of AGI for various income ranges: 1.9% for AGIs below $10k, 0.9% for AGIs $10k-25k, 0.9% for AGIs $25k-50k, 0.8% for AGIs $50k-75k, 0.8% for AGIs $75k-100k, 1.8% for AGIs over 100k)
Taxable dividends: $1,473 (reported on 9.2% of returns)
Here:
$1,473
State:
$3,999
(% of AGI for various income ranges: 0.6% for AGIs below $10k, 0.2% for AGIs $10k-25k, 0.3% for AGIs $25k-50k, 0.2% for AGIs $50k-75k, 0.4% for AGIs $75k-100k, 1.2% for AGIs over 100k)
Net capital gain/loss: +$3,443 (reported on 7.3% of returns)
Here:
+$3,443
State:
+$13,100
(% of AGI for various income ranges: -0.2% for AGIs below $10k, 0.1% for AGIs $10k-25k, 0.3% for AGIs $25k-50k, 0.2% for AGIs $50k-75k, 0.2% for AGIs $75k-100k, 4.3% for AGIs over 100k)
Profit/loss from business: +$3,925 (reported on 12.5% of returns)
Here:
+$3,925
State:
+$9,144
(% of AGI for various income ranges: -6.5% for AGIs below $10k, 3.9% for AGIs $10k-25k, 1.5% for AGIs $25k-50k, 1.1% for AGIs $50k-75k, 2.0% for AGIs $75k-100k, 1.2% for AGIs over 100k)
IRA payment deduction: $2,483 (reported on 1.3% of returns)
29161:
$2,483
South Carolina:
$2,972
Total itemized deductions: $15,830 (25% of AGI, reported on 21.3% of returns)
Here:
$15,830
State:
$19,039
Here:
25.0% of AGI
State:
22.8% of AGI
(% of AGI for various income ranges: 2.6% for AGIs below $10k, 5.4% for AGIs $10k-25k, 11.2% for AGIs $25k-50k, 12.3% for AGIs $50k-75k, 14.6% for AGIs $75k-100k, 15.4% for AGIs over 100k)
Charity contributions deductions: $3,779 (6% of AGI, reported on 19.0% of returns)
Here:
$3,779
State:
$4,305
Here:
5.8% of AGI
State:
5.0% of AGI
(% of AGI for various income ranges: 0.3% for AGIs below $10k, 1.0% for AGIs $10k-25k, 2.4% for AGIs $25k-50k, 2.5% for AGIs $50k-75k, 3.4% for AGIs $75k-100k, 3.4% for AGIs over 100k)
Total tax: $4,043 (reported on 60.1% of returns)
29161:
$4,043
State:
$6,497
(% of AGI for various income ranges: 2.0% for AGIs below $10k, 2.8% for AGIs $10k-25k, 5.7% for AGIs $25k-50k, 8.3% for AGIs $50k-75k, 10.5% for AGIs $75k-100k, 17.7% for AGIs over 100k)
Earned income credit: $1,939 (reported on 36.0% of returns)
Here:
$1,939
State:
$1,882
Percentage of individuals using paid preparers for their 2004 taxes: 75.0%
Here:
75%
State:
66%
(% for various income ranges: 71.7% for AGIs below $10k, 78.1% for AGIs $10k-25k, 74.9% for AGIs $25k-50k, 73.1% for AGIs $50k-75k, 71.4% for AGIs $75k-100k, 77.2% for AGIs over 100k)
Likely homosexual households (counted as self-reported same-sex unmarried-partner households)
Lesbian couples: 0.0% of all households
Gay men: 0.3% of all households
Household received Food Stamps/SNAP in the past 12 months: 702 Household did not receive Food Stamps/SNAP in the past 12 months: 3,922
Women who had a birth in the past 12 months: 75 (9 now married, 60 unmarried) Women who did not have a birth in the past 12 months: 2,314 (979 now married, 1,334 unmarried)
Housing units in zip code 29161 with a mortgage: 1,400 (76 second mortgage, 62 both second mortgage and home equity loan) Houses without a mortgage: 45
Median monthly owner costs for units with a mortgage: $1,026 Median monthly owner costs for units without a mortgage: $398
Residents with income below the poverty level in 2022:
This zip code:
15.8%
Whole state:
14.0%
Residents with income below 50% of the poverty level in 2022:
This zip code:
6.8%
Whole state:
7.3%
Median number of rooms in houses and condos:
Here:
6.0
State:
6.4
Median number of rooms in apartments:
Here:
5.2
State:
4.5
Notable locations in this zip code not listed on our city pages
Notable locations in zip code 29161: Sallie Hill Crossing (A), Sardis - Timmonsville Fire Department (B), Darlington County Fire Department Lake Swamp (C), Timmonsville Public Library (D), Howe Springs Fire Department Station 3 (E), Timmonsville Police Department (F), Timmonsville Fire Department (G), Sardis - Timmonsville Fire Department (H). Display/hide their locations on the map
Churches in zip code 29161 include: Saint Lukes Church (A), Cartersville Baptist Church (B), Calvary Pentecostal Holiness Church (C), Bay Branch Church (D), Timmonsville Presbyterian Church (E), Sardis Baptist Church (F), Saint Lukes Church (G), New Zion Church (H), Timmonsville United Methodist Church (I). Display/hide their locations on the map
Cemeteries: Sansbury Hill Cemetery (1), Field Cemetery (2), Anderson Cemetery (3), Sparrow Swamp Cemetery (4), Bethany Cemetery (5), Byrd Cemetery (6), Phillips Cemetery (7). Display/hide their locations on the map
1,234 married couples with children.
482 single-parent households (299 men, 183 women).
97.5% of residents of 29161 zip code speak English at home.
2.3% of residents speak Spanish at home (60% very well, 40% well).
0.1% of residents speak other Indo-European language at home (100% very well).
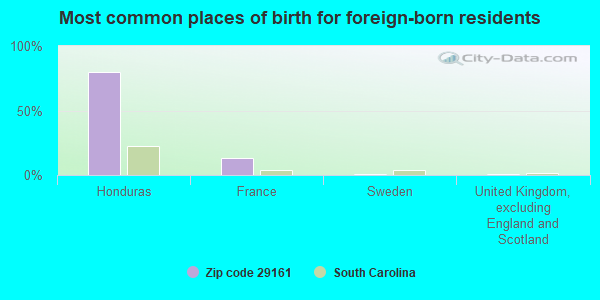
Foreign born population: 110 (1.0%) (2.0% of them are naturalized citizens)
This zip code:
1.0%
Whole state:
5.2%
80%Honduras
14%France
1%Sweden
1%United Kingdom, excluding England and Scotland
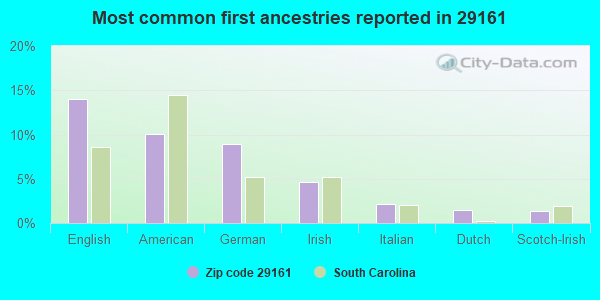
14%English
10%American
9%German
5%Irish
2%Italian
1%Dutch
1%Scotch-Irish
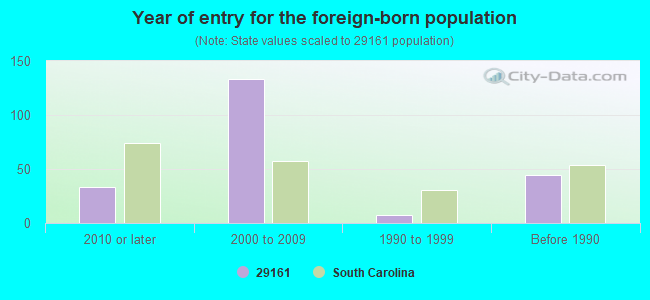
Year of entry for the foreign-born population
332010 or later
1332000 to 2009
71990 to 1999
44Before 1990
Facilities with environmental interests located in this zip code:
DIESEL COMPONENTS INCORPORATED (PALMETTO INDPARK HY 76 W in TIMMONSVILLE, SC)
(Resource Conservation and Recovery Act (tracking hazardous waste)) STATE MASTER (South Carolina database) - HAZARDOUS WASTE PROGRAM Organizations: OPERNAME (CONTACT/OPERATOR)
, CUMMINS ATLANTIC INC CHARLOTTE (CONTACT/OWNER)
Alternative names: DIESEL COMPONENTS INCORPORATED DEACTIVATED
ENVIROQUEST TECHNOLOGIES SOUTHEAST INCORPORATED (4070 TIMMONSVILLE HWY in TIMMONSVILLE, SC)
(Resource Conservation and Recovery Act (tracking hazardous waste)) STATE MASTER (South Carolina database) - TRANSPORTER, HAZARDOUS WASTE PROGRAM Organizations: FRANK MCLEOD (CONTACT/OWNER)
BORDEN CHEMICAL (FOXWORTH ST in TIMMONSVILLE, SC)
(Resource Conservation and Recovery Act (tracking hazardous waste)) STATE MASTER (South Carolina database) - HAZARDOUS WASTE PROGRAM Alternative names: BORDEN CHEMICAL-SMITH DOUGLASS
APAC ATLANTIC INCORPORATED TIMMONSVILLE PLANT #692 (963 WARREN ST in TIMMONSVILLE, SC)
AIR SYNTHETIC MINOR (AIRS/AFS) STATE MASTER (South Carolina database) - AIR MAJOR, AIR PROGRAM, Business SIC classification: ASPHALT PAVING MIXTURES AND BLOCKS; READY-MIXED CONCRETE Organizations: LANDTECH INC / JAMES G CACAVIAS (CONTACT/ENGINEERING/CONSULTING FIRM)
Alternative names: APAC-CAROLINA INC - TIMMONSVILLE, APAC CAROLINA TIMMONSVILLE, READY MIXED CONCRETE #88 TIMMONSVILLE
BROCKINGTON ELEMENTARY (401 NORTH BROCKINGTON ST in TIMMONSVILLE, SC)
(National Center for Education Statistics) - STATE ID-2104043 Organizations: FLORENCE COUNTY SCHOOL DISTRICT 04 (SCHOOL DISTRICT)
FLORENCE COUNTY SCHOOL DISTRICT 4 (220 N. PINCKNEY STREET in TIMMONSVILLE, SC)
COMPLIANCE ACTIVITY (Tracking inspections of insecticide, fungicide, and rodenticide, and toxic substances) STATE MASTER (South Carolina database) - DRINKING WATER PROGRAM Alternative names: FLORENCE SCHOOL DISTRICT FOUR
APAC CAROLINA:PLANT 692 TIMMONSVILLE (963 WARREN ST in TIMMONSVILLE, SC)
CRITERIA AND HAZARDOUS AIR POLLUTANT INVENTORY (Inventory of air pollution sources) Business SIC classification: READY-MIXED CONCRETE
FLORENCE COUNTY SCHOOL DISTRICT 4 (202 NORTH PINCKNEY STREET in TIMMONSVILLE, SC)
COMPLIANCE ACTIVITY (Tracking inspections of insecticide, fungicide, and rodenticide, and toxic substances)
Housing units lacking complete plumbing facilities: 5.1% Housing units lacking complete kitchen facilities: 5.4%
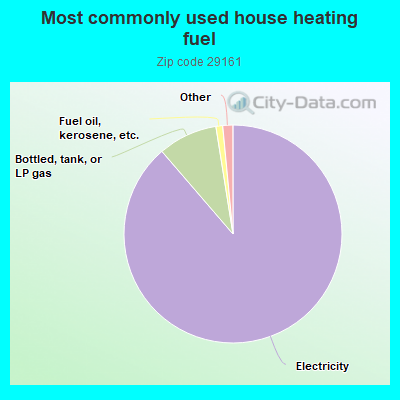
88.7%Electricity
8.8%Bottled, tank, or LP gas
1.0%Fuel oil, kerosene, etc.
0.9%Utility gas
0.6%No fuel used
Population in 1990: 6,644. Population change in the 1990s: +4,458 (+67.1%).
Place of birth for U.S.-born residents:
This state: 8,868
Northeast: 646
Midwest: 645
South: 662
West: 24
67% of the 29161 zip code residents lived in the same house 5 years ago. Out of people who lived in different houses, 70% lived in this county. Out of people who lived in different counties, 50% lived in South Carolina.
96% of the 29161 zip code residents lived in the same house 1 year ago. Out of people who lived in different houses, 57% moved from this county. Out of people who lived in different houses, 17% moved from different county within same state. Out of people who lived in different houses, 15% moved from different state. Out of people who lived in different houses, 3% moved from abroad.
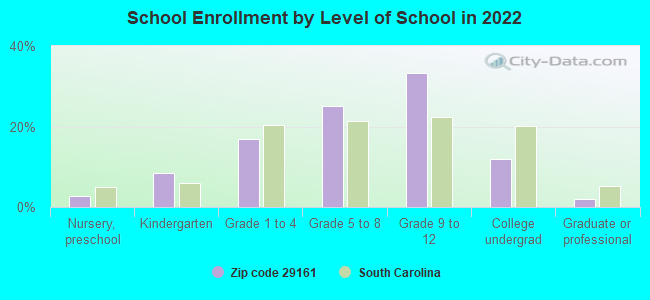
Private vs. public school enrollment:
Students in private schools in grades 1 to 8 (elementary and middle school): 64
Here:
8.4%
South Carolina:
14.4%
Students in private schools in grades 9 to 12 (high school): 19
Here:
3.2%
South Carolina:
11.1%
Students in private undergraduate colleges: 9
Here:
4.1%
South Carolina:
21.9%
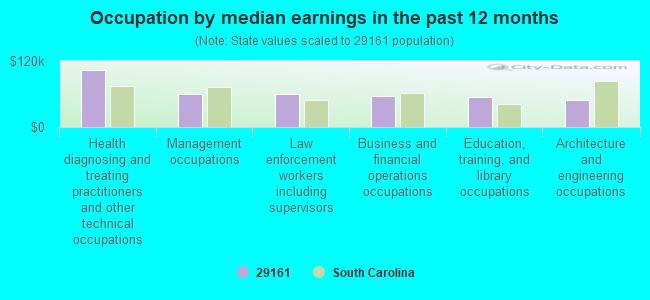
Occupation by median earnings in the past 12 months ($)
104,442Health diagnosing and treating practitioners and other technical occupations
60,776Management occupations
59,163Law enforcement workers including supervisors
56,503Business and financial operations occupations
55,046Education, training, and library occupations
48,593Architecture and engineering occupations
Companies with federal contracts located in this zip code:
FELDERS CONSTRUCTION LLC (3616 N SALLY HILL RD in TIMMONSVILLE, SC; small business) : $160,941 in 7 contractsfrom 2002 to 2005
Contracts for Maintenance, Repair or Alteration of Real Property -- Miscellaneous Buildings, Maintenance, Repair or Alteration of Real Property -- Ammunition Facilities, Maintenance, Repair or Alteration of Real Property -- Recreation Facilities (Non-Building), Construction of Structures and Facilities -- Miscellaneous Buildings by Air Force, Army Signed by year:2000: $0; 2001: $0; 2002: $35,206; 2003: $21,720; 2004: $24,000; 2005: $80,015; 2006: $0.
Biggest contracts:
$57,777 with Air Force for Maintenance, Repair or Alteration of Real Property -- Miscellaneous Buildings. Signed on 2005-09-19. Completion date: 2005-11-21.
$24,000 with Army for Maintenance, Repair or Alteration of Real Property -- Ammunition Facilities. Signed on 2004-04-08. Completion date: 2004-05-04.
$22,500 with Army for Maintenance, Repair or Alteration of Real Property -- Recreation Facilities (Non-Building). Signed on 2002-09-09. Completion date: 2002-09-30.
$22,238 with Air Force for Maintenance, Repair or Alteration of Real Property -- Miscellaneous Buildings. Signed on 2005-09-29. Completion date: 2005-11-14.
SPANN PAINTING COMPANY (505 EAST BYRD STREET in TIMMONSVILLE, SC; small business) : $40,770 in 2 contractsfrom 2000 to 2001
$45,108 with Navy for Construction of Structures and Facilities -- Hospitals and Infirmaries. Signed on 2000-09-28. Completion date: 2000-12-29.
-$4,338, same as above.Signed on 2001-10-01. Completion date: 2000-12-29.
T-KARTOR SWEDEN AB (OLOF MOHLINS VAG 12 in KRISTIANSTAD, ) 35 employees, $3500000 revenue: $34,062 in 2 contractsfrom 2005 to 2006
$28,159 with U.S. Customs Service for ADPE System Configuration. Taking place in DC. Signed on 2006-06-02. Completion date: 2006-09-30.
$5,903, same as above.Signed on 2005-12-22. Completion date: 2006-09-30.
Top industries in this zip code by the number of employees in 2005:
Administrative and Support and Waste Management and Remediation Services: Temporary Help Services (250-499 employees: 1 establishment)
Other Services (except Public Administration): Religious Organizations (10-19: 1, 5-9: 3, 1-4: 6)
2009 - 2018 National Fire Incident Reporting System (NFIRS) incidents
According to the data from the years 2009 - 2018 the average number of fire incidents per year is 34. The highest number of reported fires - 102 took place in 2018, and the least - 4 in 2009. The data has a growing trend.
When looking into fire subcategories, the most reports belonged to: Outside Fires (43.8%), and Structure Fires (39.3%).
Fire incident types reported to NFIRS in Zip Code 29161


 Nearest zip codes: 29114, 29501, 29080, 29069, 29532, 29541.


 According to the data from the years 2009 - 2018 the average number of fire incidents per year is 34. The highest number of reported fires - 102 took place in 2018, and the least - 4 in 2009. The data has a growing trend.
 When looking into fire subcategories, the most reports belonged to: Outside Fires (43.8%), and Structure Fires (39.3%).