Estimated zip code population in 2022: 1,819 Zip code population in 2010: 1,741 Zip code population in 2000: 1,834
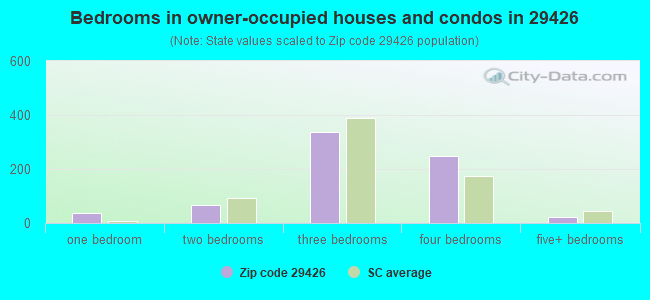
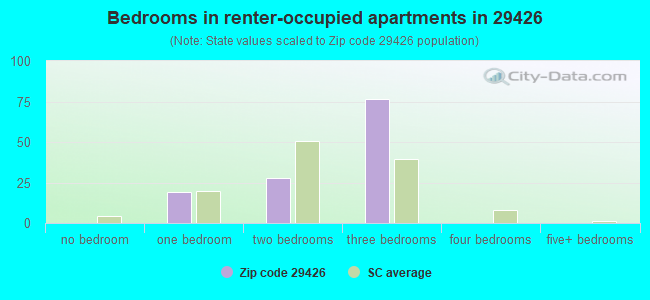
Houses and condos: 932 Renter-occupied apartments: 124
% of renters here:
15%
State:
28%
March 2022 cost of living index in zip code 29426: 83.4 (less than average, U.S. average is 100)
Land area: 67.3 sq. mi. Water area: 0.5 sq. mi.
Population density: 27 people per square mile
(very low).
OSM Map
General Map
Google Map
MSN Map
OSM Map
General Map
Google Map
MSN Map
OSM Map
General Map
Google Map
MSN Map
OSM Map
General Map
Google Map
MSN Map
Please wait while loading the map...
Real estate property taxes paid for housing units in 2022:
This zip code:
0.5% ($1,100)
South Carolina:
0.5% ($1,185)
Median real estate property taxes paid for housing units with mortgages in 2022: $755 (0.4%) Median real estate property taxes paid for housing units with no mortgage in 2022: $1,610 (0.4%)
Business Search- 14 Million verified businesses
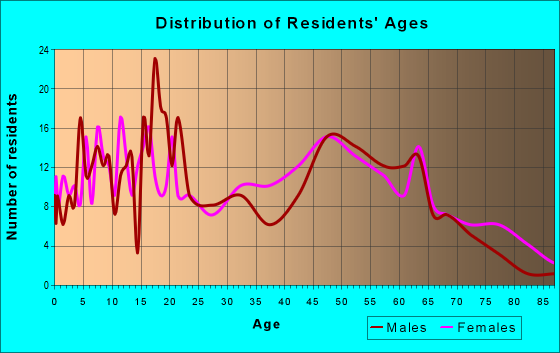
Males: 779
(42.8%)
Females: 1,040
(57.2%)
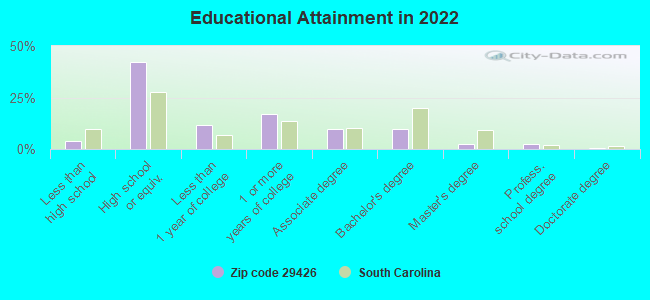
For population 25 years and over in 29426:
High school or higher: 94.9%
Bachelor's degree or higher: 15.2%
Graduate or professional degree: 5.4%
Mean travel time to work (commute): 36.6 minutes
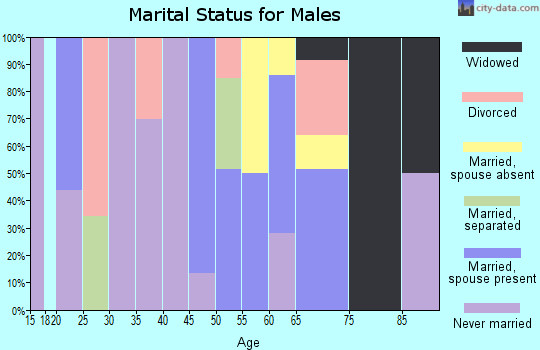
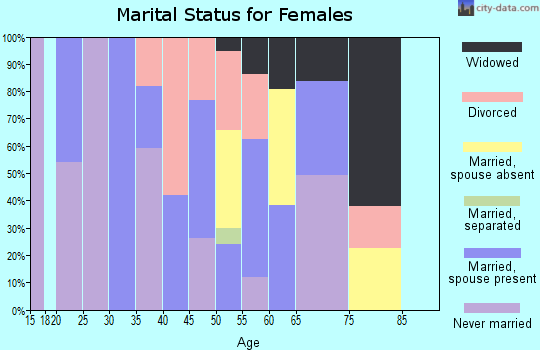
For population 15 years and over in 29426:
Never married: 32.0%
Now married: 47.2%
Separated: 3.3%
Widowed: 6.2%
Divorced: 11.3%
Zip code 29426 compared to state average:
Unemployed percentage significantly below state average.
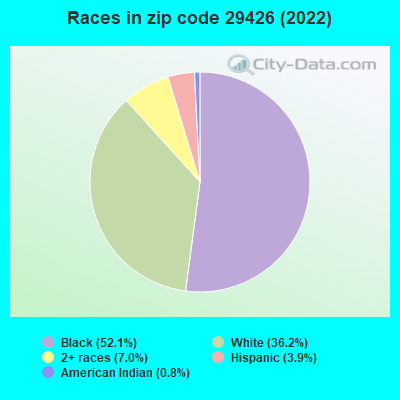
Black race population percentage above state average.
Median age above state average.
Foreign-born population percentage significantly below state average.
Renting percentage below state average.
Length of stay since moving in significantly above state average.
Percentage of population with a bachelor's degree or higher below state average.
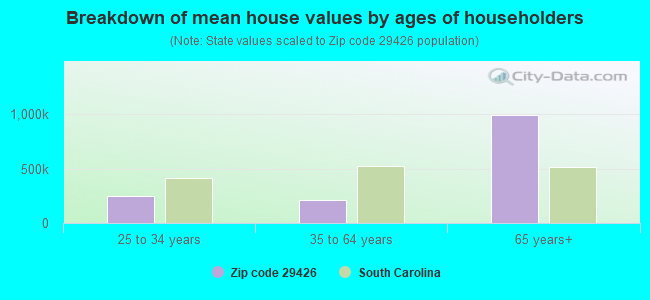
Estimated median house/condo value in 2022: $218,447
29426:
$218,447
South Carolina:
$254,600
According to our research of South Carolina and other state lists, there was 1 registered sex offender living in 29426 zip code as of April 28, 2024. The ratio of all residents to sex offenders in zip code 29426 is 1,686 to 1. The ratio of registered sex offenders to all residents in this zip code is lower than the state average.
Median resident age:
This zip code:
47.4 years
South Carolina median age:
40.5 years
Average household size:
This zip code:
2.2 people
South Carolina:
2.4 people
Averages for the 2020 tax year for zip code 29426, filed in 2021:
Average Adjusted Gross Income (AGI) in 2020: $41,920 (Individual Income Tax Returns)
Here:
$41,920
State:
$65,754
Salary/wage: $38,032 (reported on 85.2% of returns)
Here:
$38,032
State:
$52,566
(% of AGI for various income ranges: 1301.2% for AGIs below $25k, 3917.4% for AGIs $25k-50k, 9554.0% for AGIs $50k-75k, 9932.5% for AGIs $75k-100k, 22653.3% for AGIs $100k-200k)
Taxable interest for individuals: $288 (reported on 9.9% of returns)
This zip code:
$288
South Carolina:
$1,749
(% of AGI for various income ranges: 0.4% for AGIs below $25k, 3.2% for AGIs $25k-50k, 53.3% for AGIs $100k-200k)
Ordinary dividends: $1,700 (reported on 4.9% of returns)
Here:
$1,700
State:
$8,783
(% of AGI for various income ranges: 4.0% for AGIs below $25k, 116.0% for AGIs $50k-75k)
Net capital gain/loss in AGI: +$560 (reported on 6.2% of returns)
Here:
+$560
State:
+$24,194
(% of AGI for various income ranges: 56.0% for AGIs $50k-75k)
Profit/loss from business: +$7,029 (reported on 17.3% of returns)
Here:
+$7,029
State:
+$11,253
(% of AGI for various income ranges: 147.2% for AGIs below $25k, 310.5% for AGIs $25k-50k, 65.0% for AGIs $75k-100k)
Taxable individual retirement arrangement distribution: $10,000 (reported on 3.7% of returns)
29426:
$10,000
South Carolina:
$21,604
(% of AGI for various income ranges: 157.9% for AGIs $25k-50k)
Total itemized deductions: $25,075 (reported on 4.9% of returns)
Here:
$25,075
State:
$35,199
(% of AGI for various income ranges: 2507.5% for AGIs $75k-100k)
Charity contributions: $9,100 (reported on 3.7% of returns)
Here:
$9,100
State:
$14,319
(% of AGI for various income ranges: 546.0% for AGIs $50k-75k)
Taxes paid: $7,267 (reported on 3.7% of returns)
29426:
$7,267
State:
$7,486
(% of AGI for various income ranges: 436.0% for AGIs $50k-75k)
Earned income credit: $2,164 (reported on 27.2% of returns)
Here:
$2,164
State:
$2,397
(% of AGI for various income ranges: 112.4% for AGIs below $25k, 102.6% for AGIs $25k-50k)
Percentage of individuals using paid preparers for their 2020 taxes: 91.4%
Here:
91%
State:
93%
(% for various income ranges: 91.2% for AGIs below $25k, 96.0% for AGIs $25k-50k, 90.0% for AGIs $50k-75k, 83.3% for AGIs $75k-100k, 83.3% for AGIs $100k-200k)
Averages for the 2012 tax year for zip code 29426, filed in 2013:
Average Adjusted Gross Income (AGI) in 2012: $30,682 (Individual Income Tax Returns)
Here:
$30,682
State:
$51,133
Salary/wage: $28,484 (reported on 88.5% of returns)
Here:
$28,484
State:
$42,173
(% of AGI for various income ranges: 85.7% for AGIs below $25k, 82.9% for AGIs $25k-50k, 78.7% for AGIs $50k-75k, 76.4% for AGIs $75k-100k, 83.1% for AGIs $100k-200k)
Taxable interest for individuals: $210 (reported on 12.8% of returns)
This zip code:
$210
South Carolina:
$1,468
(% of AGI for various income ranges: 0.2% for AGIs below $25k, 0.2% for AGIs $75k-100k)
Ordinary dividends: $400 (reported on 3.8% of returns)
Here:
$400
State:
$6,511
Profit/loss from business: +$3,540 (reported on 12.8% of returns)
Here:
+$3,540
State:
+$10,167
(% of AGI for various income ranges: 2.3% for AGIs below $25k, 2.5% for AGIs $25k-50k, 0.8% for AGIs $50k-75k)
Taxable individual retirement arrangement distribution: $7,950 (reported on 2.6% of returns)
29426:
$7,950
South Carolina:
$17,019
Total itemized deductions: $16,173 (28% of AGI, reported on 19.2% of returns)
Here:
$16,173
State:
$22,890
Here:
27.9% of AGI
State:
21.4% of AGI
(% of AGI for various income ranges: 12.4% for AGIs $25k-50k, 19.6% for AGIs $50k-75k, 16.9% for AGIs $100k-200k)
Charity contributions: $3,791 (reported on 14.1% of returns)
Here:
$3,791
State:
$5,169
(% of AGI for various income ranges: 1.8% for AGIs $25k-50k, 4.4% for AGIs $50k-75k, 2.2% for AGIs $100k-200k)
Taxes paid: $4,667 (reported on 19.2% of returns)
29426:
$4,667
State:
$7,644
(% of AGI for various income ranges: 2.5% for AGIs $25k-50k, 5.6% for AGIs $50k-75k, 7.1% for AGIs $100k-200k)
Earned income credit: $2,407 (reported on 37.2% of returns)
Here:
$2,407
State:
$2,418
(% of AGI for various income ranges: 9.9% for AGIs below $25k, 1.7% for AGIs $25k-50k)
Percentage of individuals using paid preparers for their 2012 taxes: 61.5%
Here:
62%
State:
57%
(% for various income ranges: 59.1% for AGIs below $25k, 66.7% for AGIs $25k-50k, 57.1% for AGIs $50k-75k, 133.3% for AGIs $75k-100k)
Averages for the 2004 tax year for zip code 29426, filed in 2005:
Average Adjusted Gross Income (AGI) in 2004: $26,086 (Individual Income Tax Returns)
Here:
$26,086
State:
$41,965
Salary/wage: $25,796 (reported on 89.2% of returns)
Here:
$25,796
State:
$35,695
(% of AGI for various income ranges: 106.0% for AGIs below $10k, 86.3% for AGIs $10k-25k, 92.6% for AGIs $25k-50k, 86.9% for AGIs $50k-75k, 91.5% for AGIs $75k-100k, 73.2% for AGIs over 100k)
Taxable interest for individuals: $320 (reported on 17.8% of returns)
This zip code:
$320
South Carolina:
$1,623
(% of AGI for various income ranges: 1.1% for AGIs below $10k, 0.3% for AGIs $10k-25k, 0.1% for AGIs $25k-50k, 0.2% for AGIs $50k-75k, 0.1% for AGIs $75k-100k, 0.2% for AGIs over 100k)
Taxable dividends: $848 (reported on 4.0% of returns)
Here:
$848
State:
$3,999
Profit/loss from business: +$4,845 (reported on 13.3% of returns)
Here:
+$4,845
State:
+$9,144
(% of AGI for various income ranges: 15.7% for AGIs below $10k, 2.9% for AGIs $10k-25k, 0.7% for AGIs $25k-50k, 4.8% for AGIs $50k-75k)
IRA payment deduction: $1,200 (reported on 1.2% of returns)
29426:
$1,200
South Carolina:
$2,972
Total itemized deductions: $14,880 (28% of AGI, reported on 20.1% of returns)
Here:
$14,880
State:
$19,039
Here:
28.3% of AGI
State:
22.8% of AGI
(% of AGI for various income ranges: 7.2% for AGIs $10k-25k, 12.4% for AGIs $25k-50k, 14.9% for AGIs $50k-75k, 15.6% for AGIs $75k-100k, 13.4% for AGIs over 100k)
Charity contributions deductions: $3,128 (6% of AGI, reported on 17.9% of returns)
Here:
$3,128
State:
$4,305
Here:
5.8% of AGI
State:
5.0% of AGI
(% of AGI for various income ranges: 1.2% for AGIs $10k-25k, 2.5% for AGIs $25k-50k, 3.0% for AGIs $50k-75k, 2.7% for AGIs $75k-100k, 1.9% for AGIs over 100k)
Total tax: $2,981 (reported on 57.5% of returns)
29426:
$2,981
State:
$6,497
(% of AGI for various income ranges: 2.7% for AGIs below $10k, 2.3% for AGIs $10k-25k, 5.3% for AGIs $25k-50k, 8.1% for AGIs $50k-75k, 9.8% for AGIs $75k-100k, 16.0% for AGIs over 100k)
Earned income credit: $1,969 (reported on 38.9% of returns)
Here:
$1,969
State:
$1,882
Percentage of individuals using paid preparers for their 2004 taxes: 71.5%
Here:
72%
State:
66%
(% for various income ranges: 72.2% for AGIs below $10k, 74.6% for AGIs $10k-25k, 70.0% for AGIs $25k-50k, 63.2% for AGIs $50k-75k, 66.7% for AGIs $75k-100k, 64.7% for AGIs over 100k)
Household received Food Stamps/SNAP in the past 12 months: 137 Household did not receive Food Stamps/SNAP in the past 12 months: 686
Women who had a birth in the past 12 months: 11 (11 now married, 0 unmarried) Women who did not have a birth in the past 12 months: 510 (133 now married, 373 unmarried)
Housing units in zip code 29426 with a mortgage: 389 (9 second mortgage, 9 both second mortgage and home equity loan) Median monthly owner costs for units with a mortgage: $1,224 Median monthly owner costs for units without a mortgage: $696
Residents with income below the poverty level in 2022:
This zip code:
32.1%
Whole state:
14.0%
Residents with income below 50% of the poverty level in 2022:
This zip code:
9.8%
Whole state:
7.3%
Median number of rooms in houses and condos:
Here:
6.3
State:
6.4
Median number of rooms in apartments:
Here:
4.9
State:
4.5
Notable locations in this zip code not listed on our city pages
Churches in zip code 29426 include: Saint Marks Church (A), Shiloh Church (B), Calvary Church (C), Shepherd Grove Church (D), Faith Church (E), Hopewell Church (F), Church of God (G), Mount Nebo Church (H), Osborn Church (I). Display/hide their locations on the map
Size of family households: 254 2-persons, 101 3-persons, 136 4-persons, 5 5-persons
Size of nonfamily households: 232 1-person, 91 2-persons
157 married couples with children.
95 single-parent households (95 women).
95.1% of residents of 29426 zip code speak English at home.
3.4% of residents speak Spanish at home (48% very well, 52% well).
1.5% of residents speak other Indo-European language at home (100% very well).
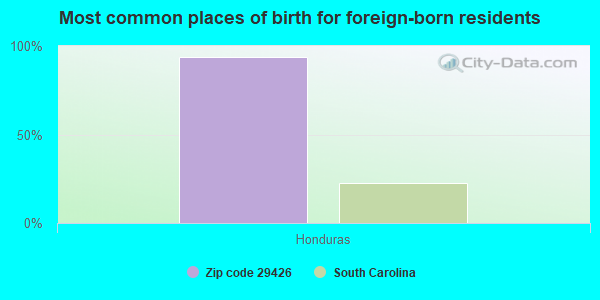
Foreign born population: 29 (1.6%) (0.0% of them are naturalized citizens)
:
1.6%
Whole state:
5.2%
94%Honduras
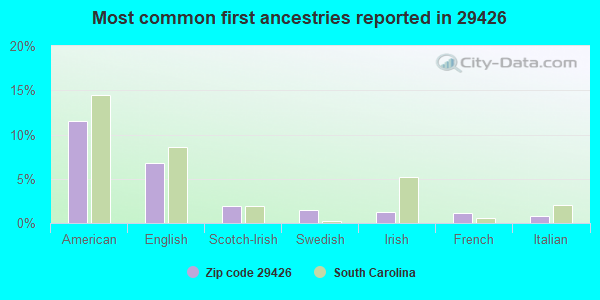
12%American
7%English
2%Scotch-Irish
1%Swedish
1%Irish
1%French
1%Italian
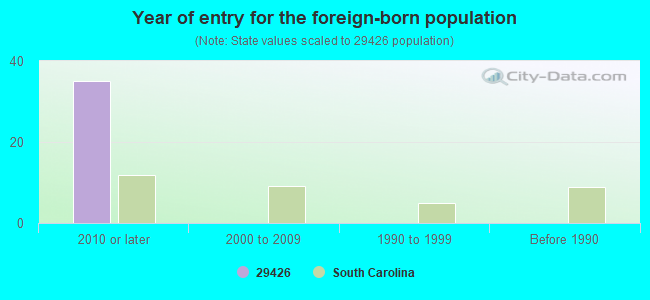
Year of entry for the foreign-born population
352010 or later
02000 to 2009
01990 to 1999
0Before 1990
Housing units lacking complete plumbing facilities: 4.5% Housing units lacking complete kitchen facilities: 5.4%
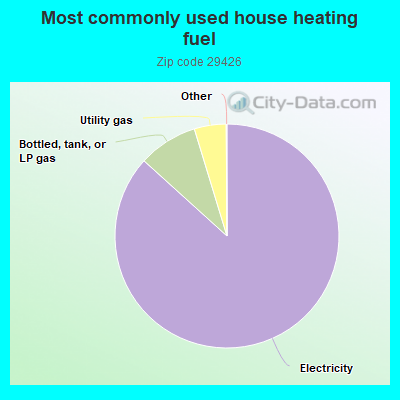
86.8%Electricity
8.6%Bottled, tank, or LP gas
4.6%Utility gas
Population in 1990: 1,723. Population change in the 1990s: +111 (+6.4%).
Place of birth for U.S.-born residents:
This state: 1,413
Northeast: 114
Midwest: 97
South: 110
West: 27
85% of the 29426 zip code residents lived in the same house 5 years ago. Out of people who lived in different houses, 67% lived in this county. Out of people who lived in different counties, 50% lived in South Carolina.
94% of the 29426 zip code residents lived in the same house 1 year ago. Out of people who lived in different houses, 61% moved from this county. Out of people who lived in different houses, 31% moved from different state.
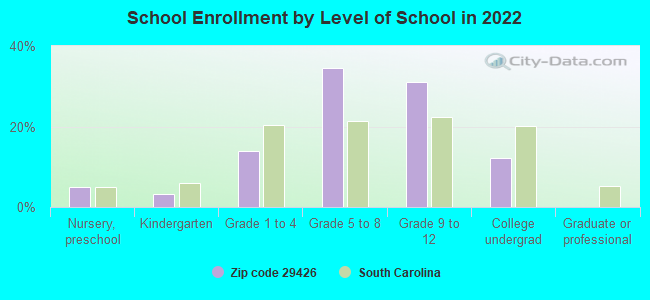
Private vs. public school enrollment:
Students in private schools in grades 1 to 8 (elementary and middle school): 5
Here:
2.5%
South Carolina:
14.4%
Students in private schools in grades 9 to 12 (high school):
Here:
0.0%
South Carolina:
11.1%
Students in private undergraduate colleges:
Here:
0.0%
South Carolina:
21.9%
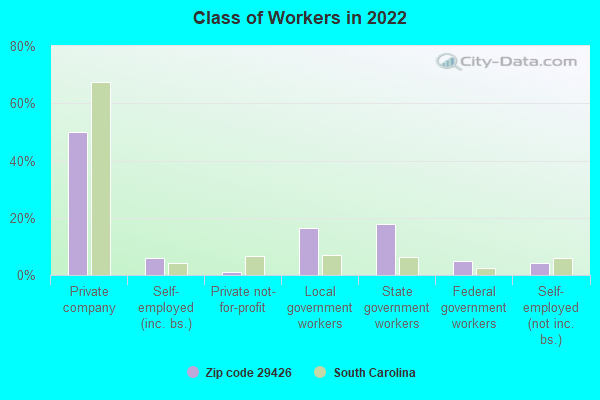
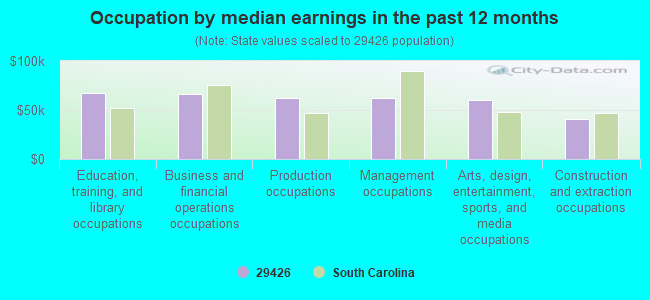
Occupation by median earnings in the past 12 months ($)
67,376Education, training, and library occupations
66,795Business and financial operations occupations
62,688Production occupations
61,836Management occupations
60,362Arts, design, entertainment, sports, and media occupations
40,509Construction and extraction occupations
Top industries in this zip code by the number of employees in 2005:
Wholesale Trade: Farm and Garden Machinery and Equipment Merchant Wholesalers (10-19 employees: 1 establishment)
Other Services (except Public Administration): Religious Organizations (1-4: 1)
Other Services (except Public Administration): Consumer Electronics Repair and Maintenance (1-4: 1)
Construction: Residential Remodelers (1-4: 1)
Administrative and Support and Waste Management and Remediation Services: Landscaping Services (1-4: 1)
Professional, Scientific, and Technical Services: Environmental Consulting Services (1-4: 1)
Administrative and Support and Waste Management and Remediation Services: Exterminating and Pest Control Services (1-4: 1)
Wholesale Trade: Wholesale Trade Agents and Brokers (1-4: 1)
Fatal accident statistics in 2012:
Fatal accident count: 2
Vehicles involved in fatal accidents: 2
Fatal accidents caused by drunken drivers: 2
Fatalities: 2
Persons involved in fatal accidents: 3
Pedestrians involved in fatal accidents: 0
Fatal accident statistics in 2011:
Fatal accident count: 1
Vehicles involved in fatal accidents: 3
Fatal accidents caused by drunken drivers: 0
Fatalities: 2
Persons involved in fatal accidents: 7
Pedestrians involved in fatal accidents: 0
Home Mortgage Disclosure Act Aggregated Statistics For Year 2009 (Based on 2 partial tracts)
A) FHA, FSA/RHS & VA Home Purchase Loans
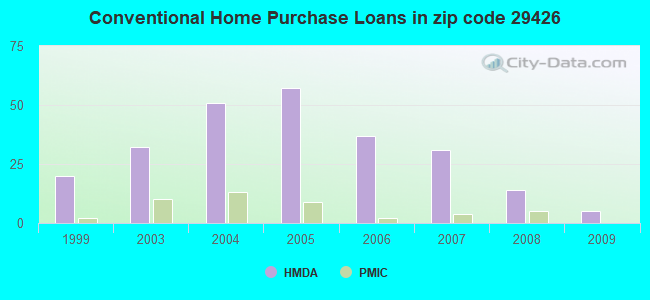
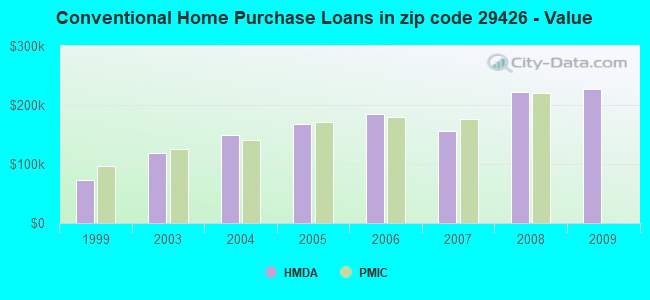
B) Conventional Home Purchase Loans
C) Refinancings
D) Home Improvement Loans
F) Non-occupant Loans on < 5 Family Dwellings (A B C & D)
G) Loans On Manufactured Home Dwelling (A B C & D)
Number
Average Value
Number
Average Value
Number
Average Value
Number
Average Value
Number
Average Value
Number
Average Value
LOANS ORIGINATED
2
$135,390
5
$227,184
41
$208,129
6
$75,055
7
$203,151
6
$66,413
APPLICATIONS APPROVED, NOT ACCEPTED
2
$106,580
0
$0
3
$66,893
0
$0
0
$0
2
$76,335
APPLICATIONS DENIED
0
$0
7
$73,799
36
$278,031
7
$54,183
7
$199,859
11
$61,016
APPLICATIONS WITHDRAWN
2
$155,070
1
$138,270
15
$213,037
0
$0
3
$153,313
1
$127,710
FILES CLOSED FOR INCOMPLETENESS
0
$0
0
$0
4
$248,692
0
$0
1
$372,560
0
$0
Aggregated Statistics For Year 2008 (Based on 2 partial tracts)
A) FHA, FSA/RHS & VA Home Purchase Loans
B) Conventional Home Purchase Loans
C) Refinancings
D) Home Improvement Loans
F) Non-occupant Loans on < 5 Family Dwellings (A B C & D)
G) Loans On Manufactured Home Dwelling (A B C & D)
Number
Average Value
Number
Average Value
Number
Average Value
Number
Average Value
Number
Average Value
Number
Average Value
LOANS ORIGINATED
4
$160,832
14
$222,424
44
$204,173
10
$74,800
10
$146,815
11
$39,805
APPLICATIONS APPROVED, NOT ACCEPTED
0
$0
5
$103,318
12
$137,388
1
$26,890
1
$67,210
7
$54,046
APPLICATIONS DENIED
1
$297,660
7
$108,229
56
$178,066
20
$82,625
6
$237,170
18
$84,764
APPLICATIONS WITHDRAWN
1
$128,670
2
$74,415
12
$176,837
1
$28,810
2
$184,840
5
$82,194
FILES CLOSED FOR INCOMPLETENESS
0
$0
0
$0
2
$139,230
0
$0
0
$0
0
$0
Aggregated Statistics For Year 2007 (Based on 2 partial tracts)
A) FHA, FSA/RHS & VA Home Purchase Loans
B) Conventional Home Purchase Loans
C) Refinancings
D) Home Improvement Loans
F) Non-occupant Loans on < 5 Family Dwellings (A B C & D)
G) Loans On Manufactured Home Dwelling (A B C & D)
Number
Average Value
Number
Average Value
Number
Average Value
Number
Average Value
Number
Average Value
Number
Average Value
LOANS ORIGINATED
4
$201,642
31
$156,760
53
$192,964
11
$131,198
14
$157,816
19
$83,184
APPLICATIONS APPROVED, NOT ACCEPTED
0
$0
4
$66,015
14
$217,829
3
$68,813
4
$304,382
5
$111,576
APPLICATIONS DENIED
3
$112,663
20
$121,562
50
$120,928
23
$60,326
4
$105,142
27
$98,118
APPLICATIONS WITHDRAWN
0
$0
3
$120,667
12
$204,362
3
$96,340
3
$124,827
1
$151,710
FILES CLOSED FOR INCOMPLETENESS
0
$0
3
$102,100
5
$844,976
1
$115,220
0
$0
1
$115,220
Aggregated Statistics For Year 2006 (Based on 2 partial tracts)
A) FHA, FSA/RHS & VA Home Purchase Loans
B) Conventional Home Purchase Loans
C) Refinancings
D) Home Improvement Loans
F) Non-occupant Loans on < 5 Family Dwellings (A B C & D)
G) Loans On Manufactured Home Dwelling (A B C & D)
Number
Average Value
Number
Average Value
Number
Average Value
Number
Average Value
Number
Average Value
Number
Average Value
LOANS ORIGINATED
0
$0
37
$184,955
72
$172,729
8
$37,808
10
$132,508
22
$72,451
APPLICATIONS APPROVED, NOT ACCEPTED
1
$154,590
11
$105,011
17
$89,129
2
$27,845
2
$64,815
10
$66,158
APPLICATIONS DENIED
3
$78,737
39
$108,995
60
$102,597
20
$32,839
5
$115,416
56
$72,821
APPLICATIONS WITHDRAWN
0
$0
6
$156,513
20
$142,494
8
$85,338
2
$146,910
6
$74,575
FILES CLOSED FOR INCOMPLETENESS
0
$0
3
$231,087
3
$96,020
0
$0
0
$0
1
$213,160
Aggregated Statistics For Year 2005 (Based on 2 partial tracts)
A) FHA, FSA/RHS & VA Home Purchase Loans
B) Conventional Home Purchase Loans
C) Refinancings
D) Home Improvement Loans
F) Non-occupant Loans on < 5 Family Dwellings (A B C & D)
G) Loans On Manufactured Home Dwelling (A B C & D)
Number
Average Value
Number
Average Value
Number
Average Value
Number
Average Value
Number
Average Value
Number
Average Value
LOANS ORIGINATED
2
$72,975
57
$168,372
63
$170,596
8
$35,408
13
$215,823
22
$74,634
APPLICATIONS APPROVED, NOT ACCEPTED
2
$61,455
17
$106,921
13
$170,694
1
$19,200
2
$90,740
13
$58,720
APPLICATIONS DENIED
4
$52,330
49
$78,795
86
$104,952
25
$30,534
2
$212,205
59
$61,616
APPLICATIONS WITHDRAWN
0
$0
7
$118,927
29
$124,991
5
$41,480
4
$101,300
8
$72,255
FILES CLOSED FOR INCOMPLETENESS
0
$0
4
$145,710
10
$190,984
0
$0
1
$95,060
0
$0
Aggregated Statistics For Year 2004 (Based on 2 partial tracts)
A) FHA, FSA/RHS & VA Home Purchase Loans
B) Conventional Home Purchase Loans
C) Refinancings
D) Home Improvement Loans
F) Non-occupant Loans on < 5 Family Dwellings (A B C & D)
G) Loans On Manufactured Home Dwelling (A B C & D)
Number
Average Value
Number
Average Value
Number
Average Value
Number
Average Value
Number
Average Value
Number
Average Value
LOANS ORIGINATED
6
$82,577
51
$149,584
68
$193,523
7
$29,491
21
$200,453
29
$64,102
APPLICATIONS APPROVED, NOT ACCEPTED
2
$85,460
12
$50,731
17
$138,269
1
$182,440
1
$92,180
20
$58,380
APPLICATIONS DENIED
2
$60,010
39
$67,706
62
$108,565
11
$40,154
1
$96,020
53
$63,862
APPLICATIONS WITHDRAWN
0
$0
5
$69,518
16
$631,571
1
$96,020
0
$0
2
$32,165
FILES CLOSED FOR INCOMPLETENESS
0
$0
0
$0
11
$114,002
1
$18,240
0
$0
1
$6,720
Aggregated Statistics For Year 2003 (Based on 2 partial tracts)
A) FHA, FSA/RHS & VA Home Purchase Loans
B) Conventional Home Purchase Loans
C) Refinancings
D) Home Improvement Loans
F) Non-occupant Loans on < 5 Family Dwellings (A B C & D)
Number
Average Value
Number
Average Value
Number
Average Value
Number
Average Value
Number
Average Value
LOANS ORIGINATED
0
$0
32
$119,005
96
$148,781
12
$30,967
12
$172,516
APPLICATIONS APPROVED, NOT ACCEPTED
4
$39,128
11
$93,750
22
$87,858
0
$0
1
$38,410
APPLICATIONS DENIED
12
$34,968
37
$58,884
66
$98,377
6
$47,850
5
$196,840
APPLICATIONS WITHDRAWN
1
$77,780
7
$137,309
18
$127,333
2
$47,050
3
$123,547
FILES CLOSED FOR INCOMPLETENESS
0
$0
2
$170,915
4
$198,282
0
$0
1
$208,360
Aggregated Statistics For Year 1999 (Based on 1 partial tract)
B) Conventional Home Purchase Loans
C) Refinancings
D) Home Improvement Loans
F) Non-occupant Loans on < 5 Family Dwellings (A B C & D)
Detailed PMIC statistics for the following Tracts:0024.00
2002 - 2018 National Fire Incident Reporting System (NFIRS) incidents
According to the data from the years 2002 - 2018 the average number of fire incidents per year is 33. The highest number of reported fires - 55 took place in 2004, and the least - 15 in 2013. The data has a rising trend.
When looking into fire subcategories, the most reports belonged to: Outside Fires (57.0%), and Mobile Property/Vehicle Fires (23.6%).
Fire incident types reported to NFIRS in Zip Code 29426
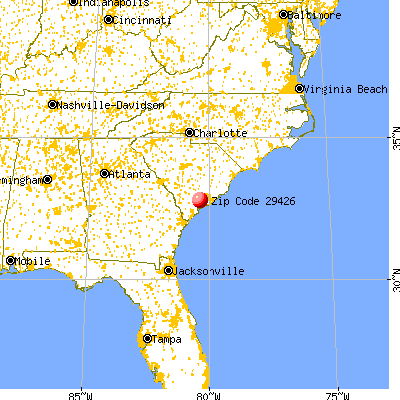


 Nearest zip codes: 29470, 29449, 29452, 29474, 29435, 29487.
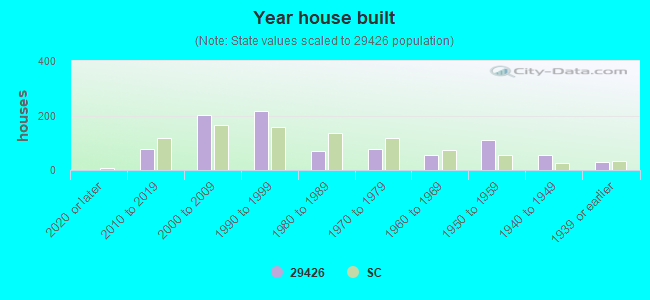


 According to the data from the years 2002 - 2018 the average number of fire incidents per year is 33. The highest number of reported fires - 55 took place in 2004, and the least - 15 in 2013. The data has a rising trend.
 When looking into fire subcategories, the most reports belonged to: Outside Fires (57.0%), and Mobile Property/Vehicle Fires (23.6%).