Estimated zip code population in 2022: 14,164 Zip code population in 2010: 12,387 Zip code population in 2000: 11,254
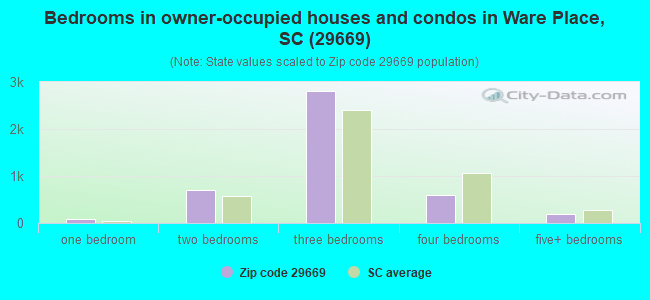
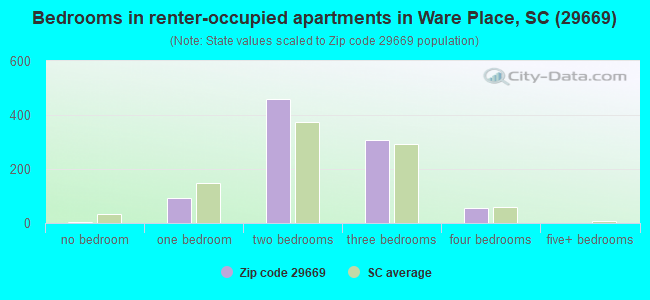
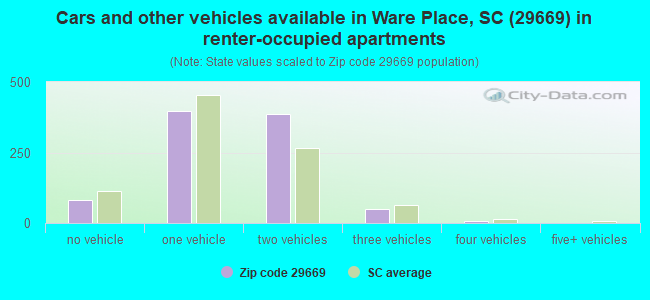
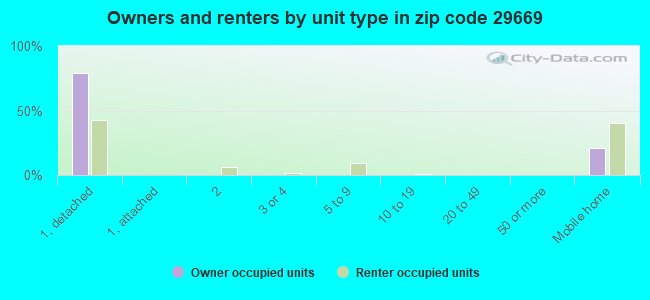
Houses and condos: 5,863 Renter-occupied apartments: 914
% of renters here:
17%
State:
28%
March 2022 cost of living index in zip code 29669: 81.0 (low, U.S. average is 100)
Land area: 62.6 sq. mi. Water area: 0.7 sq. mi.
Population density: 226 people per square mile
(very low).
OSM Map
General Map
Google Map
MSN Map
OSM Map
General Map
Google Map
MSN Map
OSM Map
General Map
Google Map
MSN Map
OSM Map
General Map
Google Map
MSN Map
Please wait while loading the map...
Real estate property taxes paid for housing units in 2022:
This zip code:
0.4% ($830)
South Carolina:
0.5% ($1,185)
Median real estate property taxes paid for housing units with mortgages in 2022: $1,204 (0.5%) Median real estate property taxes paid for housing units with no mortgage in 2022: $452 (0.2%)
Estimated median house/condo value in 2022: $209,262
29669:
$209,262
South Carolina:
$254,600
According to our research of South Carolina and other state lists, there were 6 registered sex offenders living in 29669 zip code as of May 02, 2024. The ratio of all residents to sex offenders in zip code 29669 is 2,066 to 1. The ratio of registered sex offenders to all residents in this zip code is lower than the state average.
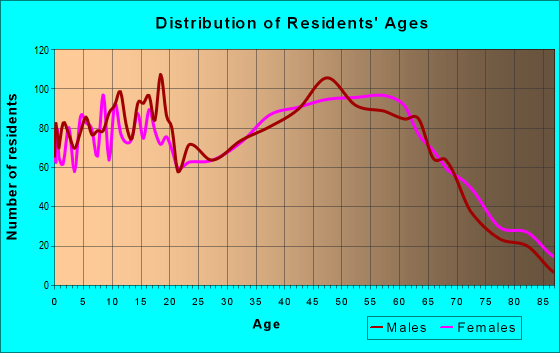
Median resident age:
This zip code:
44.3 years
South Carolina median age:
40.5 years
Average household size:
This zip code:
2.5 people
South Carolina:
2.4 people
Averages for the 2020 tax year for zip code 29669, filed in 2021:
Average Adjusted Gross Income (AGI) in 2020: $53,055 (Individual Income Tax Returns)
Here:
$53,055
State:
$65,754
Salary/wage: $48,047 (reported on 84.4% of returns)
Here:
$48,047
State:
$52,566
(% of AGI for various income ranges: 1174.9% for AGIs below $25k, 3975.6% for AGIs $25k-50k, 7091.8% for AGIs $50k-75k, 10029.5% for AGIs $75k-100k, 18902.2% for AGIs $100k-200k, 54524.0% for AGIs over 200k)
Taxable interest for individuals: $944 (reported on 17.7% of returns)
This zip code:
$944
South Carolina:
$1,749
(% of AGI for various income ranges: 8.7% for AGIs below $25k, 13.8% for AGIs $25k-50k, 18.0% for AGIs $50k-75k, 49.2% for AGIs $75k-100k, 89.2% for AGIs $100k-200k, 178.0% for AGIs over 200k)
Ordinary dividends: $3,260 (reported on 10.2% of returns)
Here:
$3,260
State:
$8,783
(% of AGI for various income ranges: 11.4% for AGIs below $25k, 21.8% for AGIs $25k-50k, 49.4% for AGIs $50k-75k, 71.4% for AGIs $75k-100k, 191.4% for AGIs $100k-200k, 586.0% for AGIs over 200k)
Net capital gain/loss in AGI: +$7,513 (reported on 8.7% of returns)
Here:
+$7,513
State:
+$24,194
(% of AGI for various income ranges: 0.8% for AGIs below $25k, 21.1% for AGIs $25k-50k, 14.9% for AGIs $50k-75k, 60.8% for AGIs $75k-100k, 433.5% for AGIs $100k-200k, 3684.0% for AGIs over 200k)
Profit/loss from business: +$8,225 (reported on 15.5% of returns)
Here:
+$8,225
State:
+$11,253
(% of AGI for various income ranges: 159.1% for AGIs below $25k, 95.5% for AGIs $25k-50k, 168.2% for AGIs $50k-75k, 202.4% for AGIs $75k-100k, 481.1% for AGIs $100k-200k, 954.0% for AGIs over 200k)
Taxable individual retirement arrangement distribution: $19,511 (reported on 7.4% of returns)
29669:
$19,511
South Carolina:
$21,604
(% of AGI for various income ranges: 54.9% for AGIs below $25k, 100.7% for AGIs $25k-50k, 206.8% for AGIs $50k-75k, 352.2% for AGIs $75k-100k, 1116.2% for AGIs $100k-200k)
Total itemized deductions: $30,397 (reported on 5.2% of returns)
Here:
$30,397
State:
$35,199
(% of AGI for various income ranges: 91.8% for AGIs $25k-50k, 262.9% for AGIs $50k-75k, 277.3% for AGIs $75k-100k, 1013.2% for AGIs $100k-200k, 4080.0% for AGIs over 200k)
Charity contributions: $12,488 (reported on 4.2% of returns)
Here:
$12,488
State:
$14,319
(% of AGI for various income ranges: 13.4% for AGIs $25k-50k, 64.8% for AGIs $50k-75k, 93.0% for AGIs $75k-100k, 372.7% for AGIs $100k-200k, 1856.0% for AGIs over 200k)
Taxes paid: $7,265 (reported on 5.0% of returns)
29669:
$7,265
State:
$7,486
(% of AGI for various income ranges: 11.8% for AGIs $25k-50k, 52.9% for AGIs $50k-75k, 63.2% for AGIs $75k-100k, 285.1% for AGIs $100k-200k, 928.0% for AGIs over 200k)
Earned income credit: $2,332 (reported on 19.5% of returns)
Here:
$2,332
State:
$2,397
(% of AGI for various income ranges: 114.9% for AGIs below $25k, 73.9% for AGIs $25k-50k, 2.5% for AGIs $50k-75k)
Percentage of individuals using paid preparers for their 2020 taxes: 93.4%
Here:
93%
State:
93%
(% for various income ranges: 91.9% for AGIs below $25k, 94.1% for AGIs $25k-50k, 94.6% for AGIs $50k-75k, 93.0% for AGIs $75k-100k, 94.1% for AGIs $100k-200k, 100.0% for AGIs over 200k)
Averages for the 2012 tax year for zip code 29669, filed in 2013:
Average Adjusted Gross Income (AGI) in 2012: $41,997 (Individual Income Tax Returns)
Here:
$41,997
State:
$51,133
Salary/wage: $38,870 (reported on 86.5% of returns)
Here:
$38,870
State:
$42,173
(% of AGI for various income ranges: 76.0% for AGIs below $25k, 84.9% for AGIs $25k-50k, 84.2% for AGIs $50k-75k, 81.4% for AGIs $75k-100k, 77.8% for AGIs $100k-200k, 55.9% for AGIs over 200k)
Taxable interest for individuals: $810 (reported on 20.6% of returns)
This zip code:
$810
South Carolina:
$1,468
(% of AGI for various income ranges: 0.8% for AGIs below $25k, 0.3% for AGIs $25k-50k, 0.3% for AGIs $50k-75k, 0.4% for AGIs $75k-100k, 0.3% for AGIs $100k-200k, 0.6% for AGIs over 200k)
Ordinary dividends: $1,921 (reported on 11.5% of returns)
Here:
$1,921
State:
$6,511
(% of AGI for various income ranges: 0.5% for AGIs below $25k, 0.4% for AGIs $25k-50k, 0.3% for AGIs $50k-75k, 0.6% for AGIs $75k-100k, 1.0% for AGIs $100k-200k)
Net capital gain/loss in AGI: +$1,931 (reported on 7.3% of returns)
Here:
+$1,931
State:
+$13,061
(% of AGI for various income ranges: 0.4% for AGIs $50k-75k, 1.2% for AGIs $100k-200k)
Profit/loss from business: +$7,047 (reported on 13.7% of returns)
Here:
+$7,047
State:
+$10,167
(% of AGI for various income ranges: 8.1% for AGIs below $25k, 1.8% for AGIs $25k-50k, 1.5% for AGIs $50k-75k, 1.1% for AGIs $75k-100k, 1.6% for AGIs $100k-200k)
Taxable individual retirement arrangement distribution: $12,586 (reported on 8.7% of returns)
29669:
$12,586
South Carolina:
$17,019
(% of AGI for various income ranges: 3.1% for AGIs below $25k, 2.5% for AGIs $25k-50k, 1.3% for AGIs $50k-75k, 2.3% for AGIs $75k-100k, 4.4% for AGIs $100k-200k)
Total itemized deductions: $19,747 (24% of AGI, reported on 24.2% of returns)
Here:
$19,747
State:
$22,890
Here:
24.3% of AGI
State:
21.4% of AGI
(% of AGI for various income ranges: 6.2% for AGIs below $25k, 7.4% for AGIs $25k-50k, 11.2% for AGIs $50k-75k, 14.0% for AGIs $75k-100k, 16.2% for AGIs $100k-200k, 15.1% for AGIs over 200k)
Charity contributions: $4,852 (reported on 20.6% of returns)
Here:
$4,852
State:
$5,169
(% of AGI for various income ranges: 0.7% for AGIs below $25k, 1.4% for AGIs $25k-50k, 2.4% for AGIs $50k-75k, 3.1% for AGIs $75k-100k, 3.4% for AGIs $100k-200k, 4.7% for AGIs over 200k)
Taxes paid: $5,955 (reported on 24.0% of returns)
29669:
$5,955
State:
$7,644
(% of AGI for various income ranges: 1.0% for AGIs below $25k, 1.4% for AGIs $25k-50k, 3.0% for AGIs $50k-75k, 4.3% for AGIs $75k-100k, 6.0% for AGIs $100k-200k, 6.7% for AGIs over 200k)
Earned income credit: $2,415 (reported on 24.6% of returns)
Here:
$2,415
State:
$2,418
(% of AGI for various income ranges: 8.3% for AGIs below $25k, 1.4% for AGIs $25k-50k)
Percentage of individuals using paid preparers for their 2012 taxes: 61.7%
Here:
62%
State:
57%
(% for various income ranges: 60.7% for AGIs below $25k, 61.9% for AGIs $25k-50k, 65.7% for AGIs $50k-75k, 60.0% for AGIs $75k-100k, 58.3% for AGIs $100k-200k, 100.0% for AGIs over 200k)
Averages for the 2004 tax year for zip code 29669, filed in 2005:
Average Adjusted Gross Income (AGI) in 2004: $35,668 (Individual Income Tax Returns)
Here:
$35,668
State:
$41,965
Salary/wage: $33,745 (reported on 88.1% of returns)
Here:
$33,745
State:
$35,695
(% of AGI for various income ranges: 100.9% for AGIs below $10k, 80.5% for AGIs $10k-25k, 87.4% for AGIs $25k-50k, 86.4% for AGIs $50k-75k, 85.6% for AGIs $75k-100k, 69.1% for AGIs over 100k)
Taxable interest for individuals: $1,040 (reported on 27.5% of returns)
This zip code:
$1,040
South Carolina:
$1,623
(% of AGI for various income ranges: 4.3% for AGIs below $10k, 1.5% for AGIs $10k-25k, 0.6% for AGIs $25k-50k, 0.7% for AGIs $50k-75k, 0.3% for AGIs $75k-100k, 0.7% for AGIs over 100k)
Taxable dividends: $1,228 (reported on 12.1% of returns)
Here:
$1,228
State:
$3,999
(% of AGI for various income ranges: 1.2% for AGIs below $10k, 0.7% for AGIs $10k-25k, 0.3% for AGIs $25k-50k, 0.5% for AGIs $50k-75k, 0.1% for AGIs $75k-100k, 0.6% for AGIs over 100k)
Net capital gain/loss: +$6,558 (reported on 8.2% of returns)
Here:
+$6,558
State:
+$13,100
(% of AGI for various income ranges: -0.4% for AGIs below $10k, 0.5% for AGIs $10k-25k, 0.2% for AGIs $25k-50k, 0.2% for AGIs $50k-75k, 0.1% for AGIs $75k-100k, 8.4% for AGIs over 100k)
Profit/loss from business: +$4,752 (reported on 14.2% of returns)
Here:
+$4,752
State:
+$9,144
(% of AGI for various income ranges: 10.3% for AGIs below $10k, 5.0% for AGIs $10k-25k, 1.8% for AGIs $25k-50k, 1.3% for AGIs $50k-75k, -0.7% for AGIs $75k-100k, 1.9% for AGIs over 100k)
IRA payment deduction: $2,478 (reported on 1.4% of returns)
29669:
$2,478
South Carolina:
$2,972
Total itemized deductions: $16,188 (25% of AGI, reported on 28.6% of returns)
Here:
$16,188
State:
$19,039
Here:
24.6% of AGI
State:
22.8% of AGI
(% of AGI for various income ranges: 6.8% for AGIs below $10k, 5.8% for AGIs $10k-25k, 11.4% for AGIs $25k-50k, 14.6% for AGIs $50k-75k, 16.9% for AGIs $75k-100k, 15.9% for AGIs over 100k)
Charity contributions deductions: $3,908 (6% of AGI, reported on 24.8% of returns)
Here:
$3,908
State:
$4,305
Here:
5.7% of AGI
State:
5.0% of AGI
(% of AGI for various income ranges: 0.7% for AGIs below $10k, 1.0% for AGIs $10k-25k, 2.0% for AGIs $25k-50k, 2.7% for AGIs $50k-75k, 3.5% for AGIs $75k-100k, 4.9% for AGIs over 100k)
Total tax: $4,201 (reported on 71.7% of returns)
29669:
$4,201
State:
$6,497
(% of AGI for various income ranges: 3.7% for AGIs below $10k, 3.7% for AGIs $10k-25k, 6.2% for AGIs $25k-50k, 8.0% for AGIs $50k-75k, 10.2% for AGIs $75k-100k, 15.9% for AGIs over 100k)
Earned income credit: $1,783 (reported on 20.7% of returns)
Here:
$1,783
State:
$1,882
Percentage of individuals using paid preparers for their 2004 taxes: 70.7%
Here:
71%
State:
66%
(% for various income ranges: 62.8% for AGIs below $10k, 74.3% for AGIs $10k-25k, 73.8% for AGIs $25k-50k, 71.1% for AGIs $50k-75k, 67.2% for AGIs $75k-100k, 69.3% for AGIs over 100k)
Likely homosexual households (counted as self-reported same-sex unmarried-partner households)
Lesbian couples: 0.3% of all households
Gay men: 0.0% of all households
Household received Food Stamps/SNAP in the past 12 months: 677 Household did not receive Food Stamps/SNAP in the past 12 months: 4,634
Women who had a birth in the past 12 months: 103 (79 now married, 26 unmarried) Women who did not have a birth in the past 12 months: 2,595 (1,346 now married, 1,258 unmarried)
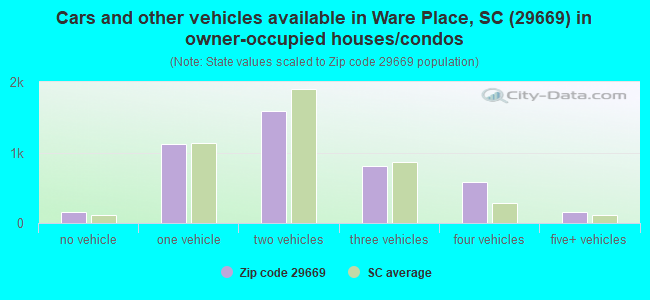
Housing units in zip code 29669 with a mortgage: 1,970 (99 second mortgage, 61 both second mortgage and home equity loan) Houses without a mortgage: 108
Median monthly owner costs for units with a mortgage: $1,171 Median monthly owner costs for units without a mortgage: $334
Residents with income below the poverty level in 2022:
This zip code:
14.8%
Whole state:
14.0%
Residents with income below 50% of the poverty level in 2022:
This zip code:
5.6%
Whole state:
7.3%
Median number of rooms in houses and condos:
Here:
6.2
State:
6.4
Median number of rooms in apartments:
Here:
4.6
State:
4.5
Notable locations in this zip code not listed on our city pages
Notable locations in zip code 29669: South Greenville Fire Department Station 4 (A), Canebreak Fire Department Fork Shoals Station (B), Anderson County Fire Protection Service West Pelzer (C). Display/hide their locations on the map
Churches in zip code 29669 include: Pleasant Grove Church (A), Sandy Springs Church (B), Shady Grove Church (C), White Plains Church (D), Oak Grove Baptist Church (E), Beulah Church (F), Bethel Church (G), Guthrie Church (H), New Shady Grove Church (I). Display/hide their locations on the map
Cemeteries: Harrison Cemetery (1), Waycross Cemetery (2), Washington Cemetery (3), Oak Grove Cemetery (4), Fork Shoals Cemetery (5), Daventon Cemetery (6), Beech Springs Cemetery (7). Display/hide their locations on the map
Lakes and reservoirs: Stoneybrook Lake (A), Snows Lake (B), Trollingwood Lake (C), Stewarts Pond (D), Trollingwood Lake (E), Water Shed Three Reservoir (F), Water Shed Number Two Reservoir (G). Display/hide their locations on the map
In group quarters: 801 (-1 institutionalized population)
Size of family households: 1,919 2-persons, 645 3-persons, 479 4-persons, 382 5-persons, 94 6-persons, 156 7-or-more-persons
Size of nonfamily households: 1,371 1-person, 252 2-persons, 27 3-persons
2,138 married couples with children.
721 single-parent households (222 men, 499 women).
93.3% of residents of 29669 zip code speak English at home.
5.0% of residents speak Spanish at home (58% very well, 29% well, 12% not well).
0.5% of residents speak other Indo-European language at home (56% very well, 44% well).
1.3% of residents speak other language at home (9% very well, 29% well, 63% not well).
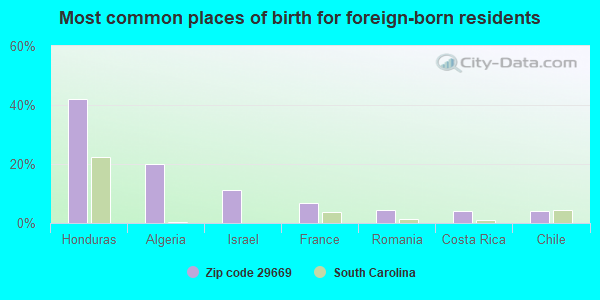
Foreign born population: 516 (3.6%) (34.6% of them are naturalized citizens)
This zip code:
3.6%
Whole state:
5.2%
42%Honduras
20%Algeria
11%Israel
7%France
5%Romania
4%Costa Rica
4%Chile
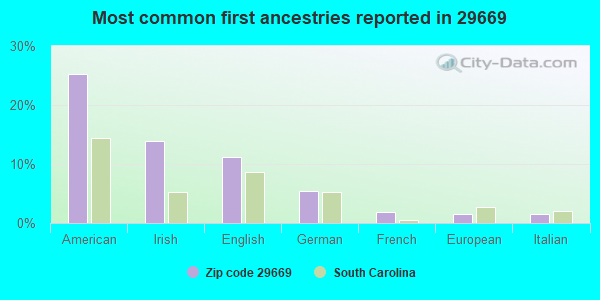
25%American
14%Irish
11%English
5%German
2%French
2%European
1%Italian
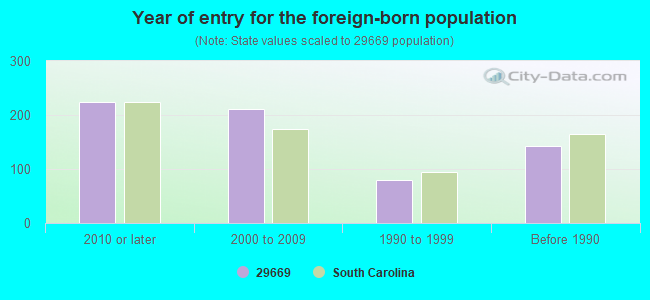
Year of entry for the foreign-born population
2242010 or later
2112000 to 2009
791990 to 1999
143Before 1990
Facilities with environmental interests located in this zip code:
DUKE POWER COMPANY LEE STEAM STATION (HIGHWAY S 4 178 in PELZER, SC)
AIR MAJOR (AIRS/AFS) AIR PROGRAM (Clean Air Markets Division Business System) (Integrated Compliance Information System) - ICIS-04-2000-0278, FORMAL ENFORCEMENT ACTION CRITERIA AND HAZARDOUS AIR POLLUTANT INVENTORY (Inventory of air pollution sources) National Pollutant Discharge Elimination System MAJOR (Tracking pollutant discharge elimination systems) - permit Conditionally Exempt Small Quantity Generators, less than 100 kg/month of hazardous waste (Resource Conservation and Recovery Act (tracking hazardous waste)) - notification (Resource Conservation and Recovery Act (tracking hazardous waste)) STATE MASTER (South Carolina database) - ASBESTOS ABATEMENT PROGRAM, TRI REPORTER, National Pollutant Discharge Elimination System Permit, HAZARDOUS WASTE PROGRAM, AIR MAJOR, AIR PROGRAM, ASBESTOS ABATEMENT PROGRAM STATE MASTER (South Carolina database) - LABORATORY CERTIFICATION STATE MASTER (South Carolina database) - UNDERGROUND STORAGE TANK PROGRAM, TRI REPORTER (Tracking of toxic chemicals releasing facilities) Business SIC classification: ELECTRIC SERVICES Organizations: OPERNAME (CONTACT/OPERATOR)
, DUKE ENERGY/LEE STEAM STATION (CONTACT/OWNER)
, DUKE ENERGY CORPORATION (OWNER/OPERATOR)
Alternative names: DUKE ENERGY CORP - LEE STEAM STATION, DUKE ENERGY LEE STEAM STATION, DUKE POWER LEE STEAM STATION, W S LEE
FORK SHOALS ELEMENTARY (916 MCKELVEY ROAD in PELZER, SC)
(National Center for Education Statistics) - STATE ID-2301057 STATE MASTER (South Carolina database) - DRINKING WATER SYSTEM STATE MASTER (South Carolina database) - DRINKING WATER PROGRAM Organizations: GREENVILLE COUNTY SCHOOL DISTRICT (SCHOOL DISTRICT)
Alternative names: FORK SHOALS ELEMENTARY SCHOOL
CHAPMAN CONCRETE PRODUCTS PELZER (8401 AUGUSTA RD in PELZER, SC)
AIR MINOR (AIRS/AFS) ENFORCEMENT/COMPLIANCE ACTIVITY (Integrated Compliance Information System) FORMAL ENFORCEMENT ACTION (Integrated Compliance Information System) CRITERIA AND HAZARDOUS AIR POLLUTANT INVENTORY (Inventory of air pollution sources) STATE MASTER (South Carolina database) - AIR PROGRAM, Business SIC classification: ASPHALT PAVING MIXTURES AND BLOCKS; READY-MIXED CONCRETE Alternative names: CHAPMAN CONCRETE PLANT NUMBER 7
ACTOL INDUSTRIES (550 GARRISON RD in PELZER, SC)
AIR MINOR (AIRS/AFS) Conditionally Exempt Small Quantity Generators, less than 100 kg/month of hazardous waste (Resource Conservation and Recovery Act (tracking hazardous waste)) - notification STATE MASTER (South Carolina database) - AIR PROGRAM, HAZARDOUS WASTE PROGRAM Business SIC classification: PLASTICS MATERIALS, SYNTHETIC RESINS, AND NONVULCANIZABLE ELASTOMERS; INDUSTRIAL ORGANIC CHEMICALS Organizations: MARK TOMIUK (CONTACT/OWNER)
CONSOLIDATED TIRES INCORPORATED (1107 EASLEY HIGHWAY in PELZER, SC)
AIR MINOR (AIRS/AFS) STATE MASTER (South Carolina database) - AIR PROGRAM, X-RAY EQUIPMENT Business SIC classification: TIRES AND INNER TUBES Organizations: ERM SOUTHEAST INC /DAVIS (CONTACT/ENGINEERING/CONSULTING FIRM)
ENTERGY INTEGRATED SOLUTIONS (8927 AUGUSTA RD in PELZER, SC)
(Resource Conservation and Recovery Act (tracking hazardous waste)) STATE MASTER (South Carolina database) - HAZARDOUS WASTE PROGRAM Organizations: ENTERGY INTEGRATED SOLUTIONS INC (CONTACT/OWNER)
Alternative names: ENTERGY INTEGRATED SOLUTIONS DEACTIVATED
FAST FARE SC 593 (80 MAIN STREET HWY 8 in PELZER, SC)
(Resource Conservation and Recovery Act (tracking hazardous waste)) STATE MASTER (South Carolina database) - HAZARDOUS WASTE PROGRAM Organizations: SANDERS STAN (CONTACT/OWNER)
Alternative names: FAST FARE SC 593 DEACTIVATED
FAST FARE SC 599 (110 HWY 20S in PELZER, SC)
(Resource Conservation and Recovery Act (tracking hazardous waste)) STATE MASTER (South Carolina database) - HAZARDOUS WASTE PROGRAM Organizations: FAST FARE INC (CONTACT/OWNER)
Alternative names: FAST FARE SC 599 DEACTIVATED
AMERICAN CONCRETE PRODUCTION (WEST OF ROARING RIVER ROAD in ROARING RIVER, NC)
AIR MINOR (AIRS/AFS) STATE MASTER (North Carolina facility info) - AIR PROGRAM Business SIC classification: READY-MIXED CONCRETE Alternative names: AMERICAN CONCRETE PRODucts, AMERICAN CONCRETE PROD **INACTIVE**
EXPERIMENTAL FABRICS (1709 EASLEY HWY in PELZER, SC)
AIR MINOR (AIRS/AFS) STATE MASTER (South Carolina database) - AIR PROGRAM, Business SIC classification: NARROW FABRIC AND OTHER SMALLWARES MILLS: COTTON, WOOL, SILK, AND MANMADE FIBER; COATED FABRICS, NOT RUBBERIZED
ELLEN WOODSIDE ELEM (9130 AUGUSTA ROAD in PELZER, SC)
(National Center for Education Statistics) - STATE ID-2301100 Organizations: GREENVILLE COUNTY SCHOOL DISTRICT (SCHOOL DISTRICT)
CARTEE AERO SERVICE (402 JOE BLACK ROAD in PELZER, SC)
(Resource Conservation and Recovery Act (tracking hazardous waste)) Organizations: ROBERT CARTEE (CONTACT/OWNER)
Alternative names: CARTEE AERO SERVICE DEACT
Housing units lacking complete plumbing facilities: 3.5% Housing units lacking complete kitchen facilities: 4.0%
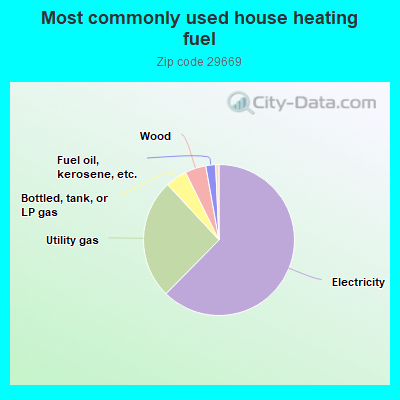
62.4%Electricity
25.7%Utility gas
4.6%Bottled, tank, or LP gas
4.5%Wood
2.1%Fuel oil, kerosene, etc.
0.7%No fuel used
Population in 1990: 3,224. Population change in the 1990s: +8,030 (+249.1%).
Place of birth for U.S.-born residents:
This state: 8,561
Northeast: 1,520
Midwest: 649
South: 2,125
West: 605
68% of the 29669 zip code residents lived in the same house 5 years ago. Out of people who lived in different houses, 56% lived in this county. Out of people who lived in different counties, 50% lived in South Carolina.
90% of the 29669 zip code residents lived in the same house 1 year ago. Out of people who lived in different houses, 28% moved from this county. Out of people who lived in different houses, 45% moved from different county within same state. Out of people who lived in different houses, 18% moved from different state. Out of people who lived in different houses, 10% moved from abroad.
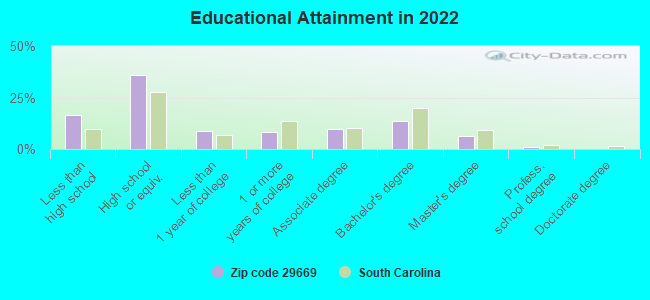
Private vs. public school enrollment:
Students in private schools in grades 1 to 8 (elementary and middle school): 395
Here:
22.1%
South Carolina:
14.4%
Students in private schools in grades 9 to 12 (high school): 111
Here:
18.4%
South Carolina:
11.1%
Students in private undergraduate colleges: 58
Here:
20.1%
South Carolina:
21.9%
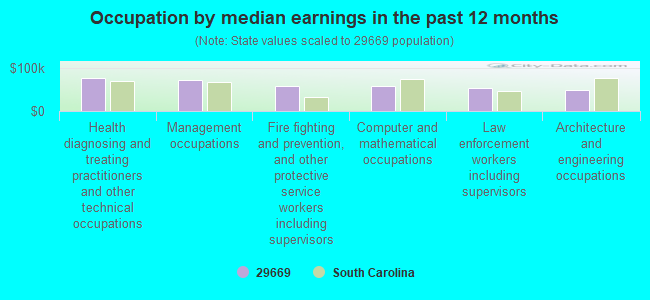
Occupation by median earnings in the past 12 months ($)
77,452Health diagnosing and treating practitioners and other technical occupations
71,198Management occupations
59,211Fire fighting and prevention, and other protective service workers including supervisors
59,127Computer and mathematical occupations
53,979Law enforcement workers including supervisors
49,527Architecture and engineering occupations
Companies with federal contracts located in this zip code:
MODERN CONTINENTAL SOUTH, INC (278 GARRISON RD in PELZER, SC) : $22,873,422 in 29 contractsfrom 2000 to 2006
Contracts for Construction of Structures and Facilities -- Canals, Construction of Structures and Facilities -- Recreation Facilities (Non-Building) by U.S. Army Corps of Engineers - civil program financing only, Army Signed by year:2000: $2,000,000; 2001: $6,200,956; 2002: $5,200,000; 2003: $7,213,647; 2004: $2,280,890; 2005: -$16,894; 2006: -$5,177.
Biggest contracts:
$3,200,000 with U.S. Army Corps of Engineers - civil program financing only for Construction of Structures and Facilities -- Canals. Taking place in FL. Signed on 2002-02-01. Completion date: 2003-01-27.
$2,400,000, same as above.Signed on 2003-07-14. Completion date: 2003-01-27.
$2,000,000, same as above.Signed on 2001-12-14. Completion date: 2003-01-27.
$1,999,000, same as above.Signed on 2000-12-04. Completion date: 2003-01-27.
Top industries in this zip code by the number of employees in 2005:
Other Services (except Public Administration): Religious Organizations (10-19 employees: 4 establishments, 5-9 employees: 4 establishments, 1-4 employees: 12 establishments)
Wholesale Trade: Tire and Tube Merchant Wholesalers (50-99: 1)
Accommodation and Food Services: Limited-Service Restaurants (20-49: 1, 1-4: 2)
Construction: Commercial and Institutional Building Construction (10-19: 1, 5-9: 3)
Administrative and Support and Waste Management and Remediation Services: Septic Tank and Related Services (20-49: 1)
People in group quarters in 2000:
34 people in homes or halfway houses for drug/alcohol abuse
Fatal accident statistics in 2014:
Fatal accident count: 4
Vehicles involved in fatal accidents: 7
Fatal accidents caused by drunken drivers: 2
Fatalities: 4
Persons involved in fatal accidents: 12
Pedestrians involved in fatal accidents: 0
Fatal accident statistics in 2013:
Fatal accident count: 1
Vehicles involved in fatal accidents: 1
Fatal accidents caused by drunken drivers: 1
Fatalities: 1
Persons involved in fatal accidents: 1
Pedestrians involved in fatal accidents: 0
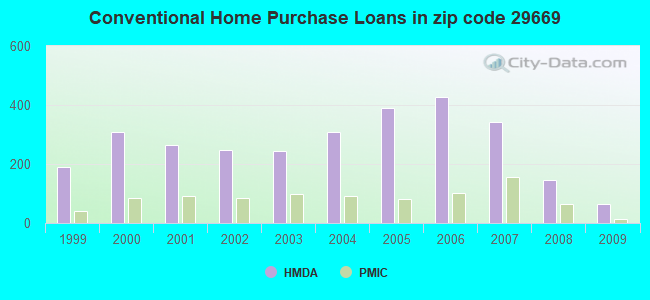
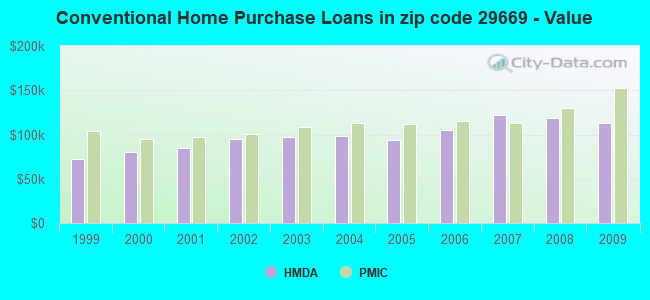
Home Mortgage Disclosure Act Aggregated Statistics For Year 2009 (Based on 2 full and 12 partial tracts)
A) FHA, FSA/RHS & VA Home Purchase Loans
B) Conventional Home Purchase Loans
C) Refinancings
D) Home Improvement Loans
F) Non-occupant Loans on < 5 Family Dwellings (A B C & D)
G) Loans On Manufactured Home Dwelling (A B C & D)
Number
Average Value
Number
Average Value
Number
Average Value
Number
Average Value
Number
Average Value
Number
Average Value
LOANS ORIGINATED
98
$123,993
65
$113,334
333
$143,395
23
$30,355
19
$84,170
25
$48,598
APPLICATIONS APPROVED, NOT ACCEPTED
8
$89,616
8
$86,841
33
$128,059
4
$35,805
2
$38,700
8
$63,476
APPLICATIONS DENIED
29
$94,731
23
$74,106
160
$140,583
14
$33,976
10
$57,643
17
$58,474
APPLICATIONS WITHDRAWN
14
$103,721
9
$143,683
103
$142,044
1
$100,400
7
$64,911
4
$71,682
FILES CLOSED FOR INCOMPLETENESS
3
$149,703
1
$46,930
24
$145,690
2
$31,660
0
$0
2
$45,800
Aggregated Statistics For Year 2008 (Based on 2 full and 12 partial tracts)
A) FHA, FSA/RHS & VA Home Purchase Loans
B) Conventional Home Purchase Loans
C) Refinancings
D) Home Improvement Loans
F) Non-occupant Loans on < 5 Family Dwellings (A B C & D)
G) Loans On Manufactured Home Dwelling (A B C & D)
Number
Average Value
Number
Average Value
Number
Average Value
Number
Average Value
Number
Average Value
Number
Average Value
LOANS ORIGINATED
105
$121,902
145
$119,020
248
$126,942
34
$37,205
63
$67,774
32
$50,792
APPLICATIONS APPROVED, NOT ACCEPTED
9
$105,743
20
$93,298
43
$156,003
2
$73,300
7
$393,414
6
$52,587
APPLICATIONS DENIED
31
$116,266
51
$89,286
275
$117,247
46
$47,882
17
$69,516
33
$55,600
APPLICATIONS WITHDRAWN
10
$109,881
18
$142,527
112
$135,427
12
$75,606
11
$135,575
6
$74,355
FILES CLOSED FOR INCOMPLETENESS
4
$108,570
8
$116,858
19
$175,718
3
$47,093
1
$65,060
1
$75,630
Aggregated Statistics For Year 2007 (Based on 2 full and 12 partial tracts)
A) FHA, FSA/RHS & VA Home Purchase Loans
B) Conventional Home Purchase Loans
C) Refinancings
D) Home Improvement Loans
E) Loans on Dwellings For 5+ Families
F) Non-occupant Loans on < 5 Family Dwellings (A B C & D)
G) Loans On Manufactured Home Dwelling (A B C & D)
Number
Average Value
Number
Average Value
Number
Average Value
Number
Average Value
Number
Average Value
Number
Average Value
Number
Average Value
LOANS ORIGINATED
52
$115,004
344
$122,480
307
$111,374
60
$38,982
1
$4,326,520
86
$96,400
54
$59,936
APPLICATIONS APPROVED, NOT ACCEPTED
2
$181,165
32
$111,263
71
$119,341
10
$100,922
0
$0
7
$112,609
7
$69,001
APPLICATIONS DENIED
10
$122,783
121
$97,874
334
$119,641
105
$51,075
0
$0
19
$93,303
51
$63,172
APPLICATIONS WITHDRAWN
6
$87,690
32
$126,995
151
$112,667
13
$70,528
0
$0
5
$112,090
7
$66,853
FILES CLOSED FOR INCOMPLETENESS
1
$56,080
12
$163,576
34
$135,974
2
$79,995
0
$0
1
$63,600
1
$110,140
Aggregated Statistics For Year 2006 (Based on 2 full and 12 partial tracts)
A) FHA, FSA/RHS & VA Home Purchase Loans
B) Conventional Home Purchase Loans
C) Refinancings
D) Home Improvement Loans
E) Loans on Dwellings For 5+ Families
F) Non-occupant Loans on < 5 Family Dwellings (A B C & D)
G) Loans On Manufactured Home Dwelling (A B C & D)
Number
Average Value
Number
Average Value
Number
Average Value
Number
Average Value
Number
Average Value
Number
Average Value
Number
Average Value
LOANS ORIGINATED
47
$114,684
426
$104,597
332
$102,576
76
$29,366
2
$266,780
107
$76,431
56
$49,446
APPLICATIONS APPROVED, NOT ACCEPTED
9
$81,024
67
$89,847
62
$89,454
5
$53,224
0
$0
12
$73,401
26
$60,456
APPLICATIONS DENIED
8
$130,259
153
$85,169
360
$95,369
108
$43,508
0
$0
28
$81,143
79
$55,040
APPLICATIONS WITHDRAWN
6
$103,487
42
$101,327
163
$99,162
25
$59,190
0
$0
13
$65,862
10
$60,533
FILES CLOSED FOR INCOMPLETENESS
0
$0
27
$102,092
42
$123,895
2
$62,450
0
$0
3
$106,317
3
$53,460
Aggregated Statistics For Year 2005 (Based on 2 full and 12 partial tracts)
A) FHA, FSA/RHS & VA Home Purchase Loans
B) Conventional Home Purchase Loans
C) Refinancings
D) Home Improvement Loans
F) Non-occupant Loans on < 5 Family Dwellings (A B C & D)
G) Loans On Manufactured Home Dwelling (A B C & D)
Number
Average Value
Number
Average Value
Number
Average Value
Number
Average Value
Number
Average Value
Number
Average Value
LOANS ORIGINATED
34
$111,674
391
$93,538
321
$96,491
64
$43,296
93
$68,493
50
$52,899
APPLICATIONS APPROVED, NOT ACCEPTED
5
$71,240
52
$73,329
71
$100,803
14
$24,534
12
$90,711
23
$50,561
APPLICATIONS DENIED
16
$84,941
148
$78,800
388
$100,372
87
$42,545
40
$78,431
108
$54,605
APPLICATIONS WITHDRAWN
4
$122,288
55
$107,361
167
$111,129
31
$111,367
18
$85,019
10
$80,871
FILES CLOSED FOR INCOMPLETENESS
4
$121,600
20
$85,096
54
$114,106
1
$37,730
1
$78,470
4
$64,108
Aggregated Statistics For Year 2004 (Based on 2 full and 12 partial tracts)
A) FHA, FSA/RHS & VA Home Purchase Loans
B) Conventional Home Purchase Loans
C) Refinancings
D) Home Improvement Loans
E) Loans on Dwellings For 5+ Families
F) Non-occupant Loans on < 5 Family Dwellings (A B C & D)
G) Loans On Manufactured Home Dwelling (A B C & D)
Number
Average Value
Number
Average Value
Number
Average Value
Number
Average Value
Number
Average Value
Number
Average Value
Number
Average Value
LOANS ORIGINATED
40
$107,316
310
$97,995
389
$96,870
44
$36,329
1
$634,550
78
$61,022
70
$50,882
APPLICATIONS APPROVED, NOT ACCEPTED
1
$130,960
40
$83,087
67
$87,348
14
$44,407
0
$0
7
$55,921
25
$52,583
APPLICATIONS DENIED
11
$117,618
94
$78,344
375
$92,930
45
$28,072
0
$0
18
$65,475
86
$58,901
APPLICATIONS WITHDRAWN
3
$96,643
44
$100,395
158
$109,236
14
$64,378
0
$0
7
$70,220
21
$81,792
FILES CLOSED FOR INCOMPLETENESS
1
$137,030
10
$75,240
45
$99,552
2
$84,885
0
$0
3
$44,523
4
$76,392
Aggregated Statistics For Year 2003 (Based on 2 full and 12 partial tracts)
A) FHA, FSA/RHS & VA Home Purchase Loans
B) Conventional Home Purchase Loans
C) Refinancings
D) Home Improvement Loans
F) Non-occupant Loans on < 5 Family Dwellings (A B C & D)
Number
Average Value
Number
Average Value
Number
Average Value
Number
Average Value
Number
Average Value
LOANS ORIGINATED
51
$104,288
243
$96,917
697
$98,535
24
$32,981
71
$58,590
APPLICATIONS APPROVED, NOT ACCEPTED
2
$99,710
35
$70,859
114
$84,648
5
$21,758
4
$95,860
APPLICATIONS DENIED
13
$87,212
79
$71,820
375
$87,594
42
$22,139
11
$74,171
APPLICATIONS WITHDRAWN
5
$107,748
36
$89,818
178
$93,435
5
$32,810
1
$51,830
FILES CLOSED FOR INCOMPLETENESS
2
$106,915
6
$118,685
33
$104,221
2
$40,785
2
$46,210
Aggregated Statistics For Year 2002 (Based on 2 full and 12 partial tracts)
A) FHA, FSA/RHS & VA Home Purchase Loans
B) Conventional Home Purchase Loans
C) Refinancings
D) Home Improvement Loans
F) Non-occupant Loans on < 5 Family Dwellings (A B C & D)
Number
Average Value
Number
Average Value
Number
Average Value
Number
Average Value
Number
Average Value
LOANS ORIGINATED
58
$101,446
246
$95,279
559
$96,068
32
$22,669
57
$61,391
APPLICATIONS APPROVED, NOT ACCEPTED
4
$75,265
50
$69,762
86
$95,362
5
$22,378
3
$40,867
APPLICATIONS DENIED
14
$92,704
151
$59,292
315
$82,916
35
$15,150
11
$58,660
APPLICATIONS WITHDRAWN
6
$109,897
24
$104,951
159
$91,718
5
$13,080
7
$79,706
FILES CLOSED FOR INCOMPLETENESS
4
$94,060
7
$92,771
42
$89,000
0
$0
0
$0
Aggregated Statistics For Year 2001 (Based on 2 full and 12 partial tracts)
A) FHA, FSA/RHS & VA Home Purchase Loans
B) Conventional Home Purchase Loans
C) Refinancings
D) Home Improvement Loans
E) Loans on Dwellings For 5+ Families
F) Non-occupant Loans on < 5 Family Dwellings (A B C & D)
Number
Average Value
Number
Average Value
Number
Average Value
Number
Average Value
Number
Average Value
Number
Average Value
LOANS ORIGINATED
74
$96,049
265
$84,745
502
$87,198
43
$16,410
1
$422,100
52
$66,704
APPLICATIONS APPROVED, NOT ACCEPTED
1
$103,570
53
$63,898
86
$72,524
7
$20,491
0
$0
5
$43,146
APPLICATIONS DENIED
8
$105,046
177
$58,493
372
$75,618
45
$16,985
0
$0
9
$99,392
APPLICATIONS WITHDRAWN
3
$79,233
32
$76,125
138
$78,450
7
$27,681
0
$0
3
$66,523
FILES CLOSED FOR INCOMPLETENESS
2
$105,920
4
$138,130
34
$76,686
3
$10,293
0
$0
3
$55,300
Aggregated Statistics For Year 2000 (Based on 2 full and 12 partial tracts)
A) FHA, FSA/RHS & VA Home Purchase Loans
B) Conventional Home Purchase Loans
C) Refinancings
D) Home Improvement Loans
F) Non-occupant Loans on < 5 Family Dwellings (A B C & D)
Number
Average Value
Number
Average Value
Number
Average Value
Number
Average Value
Number
Average Value
LOANS ORIGINATED
58
$91,548
309
$80,584
249
$67,763
59
$14,653
37
$73,094
APPLICATIONS APPROVED, NOT ACCEPTED
16
$41,698
73
$54,959
82
$68,755
13
$15,509
7
$46,756
APPLICATIONS DENIED
16
$96,510
303
$61,828
348
$66,038
62
$18,400
15
$46,423
APPLICATIONS WITHDRAWN
15
$98,785
47
$96,143
100
$63,991
9
$66,524
4
$58,038
FILES CLOSED FOR INCOMPLETENESS
0
$0
5
$102,474
45
$70,959
0
$0
0
$0
Aggregated Statistics For Year 1999 (Based on 1 full and 6 partial tracts)
A) FHA, FSA/RHS & VA Home Purchase Loans
B) Conventional Home Purchase Loans
C) Refinancings
D) Home Improvement Loans
F) Non-occupant Loans on < 5 Family Dwellings (A B C & D)
2003 - 2018 National Fire Incident Reporting System (NFIRS) incidents
According to the data from the years 2003 - 2018 the average number of fires per year is 90. The highest number of reported fire incidents - 136 took place in 2017, and the least - 57 in 2003. The data has an increasing trend.
When looking into fire subcategories, the most reports belonged to: Outside Fires (42.2%), and Structure Fires (34.9%).
Fire incident types reported to NFIRS in Zip Code 29669


 Nearest zip codes: 29673, 29680, 29697, 29627, 29605, 29662.


 According to the data from the years 2003 - 2018 the average number of fires per year is 90. The highest number of reported fire incidents - 136 took place in 2017, and the least - 57 in 2003. The data has an increasing trend.
 When looking into fire subcategories, the most reports belonged to: Outside Fires (42.2%), and Structure Fires (34.9%).