Estimated zip code population in 2022: 2,566 Zip code population in 2010: 2,330 Zip code population in 2000: 1,858
Houses and condos: 997 Renter-occupied apartments: 275
% of renters here:
28%
State:
33%
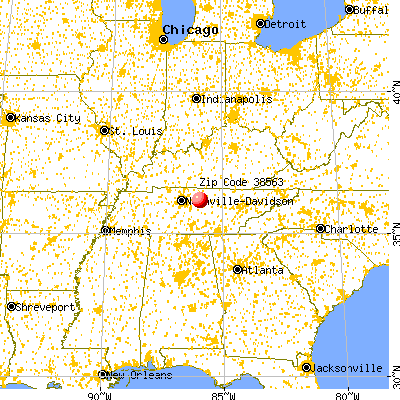
March 2022 cost of living index in zip code 38563: 80.7 (low, U.S. average is 100)
Land area: 31.7 sq. mi. Water area: 0.0 sq. mi.
Population density: 81 people per square mile
(very low).
OSM Map
General Map
Google Map
MSN Map
OSM Map
General Map
Google Map
MSN Map
OSM Map
General Map
Google Map
MSN Map
OSM Map
General Map
Google Map
MSN Map
Please wait while loading the map...
Real estate property taxes paid for housing units in 2022:
This zip code:
0.5% ($1,241)
Tennessee:
0.5% ($1,376)
Median real estate property taxes paid for housing units with mortgages in 2022: $1,128 (0.4%) Median real estate property taxes paid for housing units with no mortgage in 2022: $1,366 (0.5%)
Estimated median house/condo value in 2022: $272,775
38563:
$272,775
Tennessee:
$284,800
According to our research of Tennessee and other state lists, there were 3 registered sex offenders living in 38563 zip code as of May 28, 2024. The ratio of all residents to sex offenders in zip code 38563 is 1,006 to 1. The ratio of registered sex offenders to all residents in this zip code is much lower than the state average.
Median resident age:
This zip code:
34.0 years
Tennessee median age:
39.2 years
Average household size:
This zip code:
2.6 people
Tennessee:
2.4 people
Averages for the 2020 tax year for zip code 38563, filed in 2021:
Average Adjusted Gross Income (AGI) in 2020: $53,124 (Individual Income Tax Returns)
Here:
$53,124
State:
$69,014
Salary/wage: $47,631 (reported on 86.1% of returns)
Here:
$47,631
State:
$55,872
(% of AGI for various income ranges: 1167.7% for AGIs below $25k, 3562.0% for AGIs $25k-50k, 6304.7% for AGIs $50k-75k, 10273.3% for AGIs $75k-100k, 17622.2% for AGIs $100k-200k)
Taxable interest for individuals: $1,082 (reported on 27.0% of returns)
This zip code:
$1,082
Tennessee:
$1,945
(% of AGI for various income ranges: 22.0% for AGIs below $25k, 35.0% for AGIs $25k-50k, 41.2% for AGIs $50k-75k, 64.4% for AGIs $75k-100k, 64.4% for AGIs $100k-200k)
Ordinary dividends: $2,650 (reported on 9.8% of returns)
Here:
$2,650
State:
$8,105
(% of AGI for various income ranges: 15.7% for AGIs below $25k, 8.7% for AGIs $25k-50k, 39.4% for AGIs $50k-75k, 197.8% for AGIs $100k-200k)
Net capital gain/loss in AGI: +$8,700 (reported on 9.0% of returns)
Here:
+$8,700
State:
+$33,664
(% of AGI for various income ranges: 23.0% for AGIs below $25k, 1.7% for AGIs $25k-50k, 94.7% for AGIs $50k-75k, 802.2% for AGIs $100k-200k)
Profit/loss from business: +$12,842 (reported on 15.6% of returns)
Here:
+$12,842
State:
+$18,991
(% of AGI for various income ranges: 101.7% for AGIs below $25k, 162.7% for AGIs $25k-50k, 244.7% for AGIs $50k-75k, 557.8% for AGIs $75k-100k, 810.0% for AGIs $100k-200k)
Taxable individual retirement arrangement distribution: $12,043 (reported on 5.7% of returns)
38563:
$12,043
Tennessee:
$20,036
(% of AGI for various income ranges: 157.3% for AGIs $25k-50k, 412.2% for AGIs $75k-100k)
Earned income credit: $2,364 (reported on 18.0% of returns)
Here:
$2,364
State:
$2,391
(% of AGI for various income ranges: 104.7% for AGIs below $25k, 68.7% for AGIs $25k-50k)
Percentage of individuals using paid preparers for their 2020 taxes: 95.9%
Here:
96%
State:
93%
(% for various income ranges: 97.4% for AGIs below $25k, 97.1% for AGIs $25k-50k, 95.2% for AGIs $50k-75k, 92.3% for AGIs $75k-100k, 93.3% for AGIs $100k-200k)
Averages for the 2012 tax year for zip code 38563, filed in 2013:
Average Adjusted Gross Income (AGI) in 2012: $41,498 (Individual Income Tax Returns)
Here:
$41,498
State:
$53,767
Salary/wage: $37,111 (reported on 87.2% of returns)
Here:
$37,111
State:
$45,421
(% of AGI for various income ranges: 76.2% for AGIs below $25k, 83.6% for AGIs $25k-50k, 85.0% for AGIs $50k-75k, 83.5% for AGIs $75k-100k, 56.9% for AGIs $100k-200k)
Taxable interest for individuals: $1,291 (reported on 30.3% of returns)
This zip code:
$1,291
Tennessee:
$1,732
(% of AGI for various income ranges: 1.0% for AGIs below $25k, 0.8% for AGIs $25k-50k, 1.1% for AGIs $50k-75k, 1.2% for AGIs $75k-100k, 0.5% for AGIs $100k-200k)
Ordinary dividends: $3,530 (reported on 9.2% of returns)
Here:
$3,530
State:
$6,739
(% of AGI for various income ranges: 0.5% for AGIs below $25k, 0.4% for AGIs $25k-50k, 0.6% for AGIs $50k-75k, 2.5% for AGIs $75k-100k)
Net capital gain/loss in AGI: +$1,109 (reported on 10.1% of returns)
Here:
+$1,109
State:
+$19,082
(% of AGI for various income ranges: 0.4% for AGIs $25k-50k, 0.2% for AGIs $50k-75k, 0.6% for AGIs $75k-100k)
Profit/loss from business: +$9,426 (reported on 17.4% of returns)
Here:
+$9,426
State:
+$15,240
(% of AGI for various income ranges: 8.7% for AGIs below $25k, 1.6% for AGIs $25k-50k, 5.7% for AGIs $50k-75k, 6.2% for AGIs $100k-200k)
Taxable individual retirement arrangement distribution: $7,900 (reported on 7.3% of returns)
38563:
$7,900
Tennessee:
$15,505
(% of AGI for various income ranges: 3.0% for AGIs below $25k, 2.1% for AGIs $25k-50k, 2.4% for AGIs $75k-100k)
Total itemized deductions: $16,200 (25% of AGI, reported on 13.8% of returns)
Here:
$16,200
State:
$21,976
Here:
24.6% of AGI
State:
17.8% of AGI
(% of AGI for various income ranges: 6.0% for AGIs $25k-50k, 6.9% for AGIs $50k-75k, 6.0% for AGIs $75k-100k, 5.2% for AGIs $100k-200k)
Charity contributions: $3,600 (reported on 9.2% of returns)
Here:
$3,600
State:
$6,709
(% of AGI for various income ranges: 0.8% for AGIs $25k-50k, 0.8% for AGIs $50k-75k, 2.1% for AGIs $75k-100k)
Taxes paid: $3,127 (reported on 13.8% of returns)
38563:
$3,127
State:
$4,829
(% of AGI for various income ranges: 1.0% for AGIs $25k-50k, 1.3% for AGIs $50k-75k, 1.2% for AGIs $75k-100k, 1.1% for AGIs $100k-200k)
Earned income credit: $2,181 (reported on 24.8% of returns)
Here:
$2,181
State:
$2,404
(% of AGI for various income ranges: 7.4% for AGIs below $25k, 1.6% for AGIs $25k-50k)
Percentage of individuals using paid preparers for their 2012 taxes: 67.9%
Here:
68%
State:
52%
(% for various income ranges: 60.5% for AGIs below $25k, 69.7% for AGIs $25k-50k, 70.6% for AGIs $50k-75k, 80.0% for AGIs $75k-100k, 83.3% for AGIs $100k-200k)
Averages for the 2004 tax year for zip code 38563, filed in 2005:
Average Adjusted Gross Income (AGI) in 2004: $35,152 (Individual Income Tax Returns)
Here:
$35,152
State:
$44,088
Salary/wage: $33,981 (reported on 87.4% of returns)
Here:
$33,981
State:
$38,825
(% of AGI for various income ranges: 103.5% for AGIs below $10k, 77.5% for AGIs $10k-25k, 89.6% for AGIs $25k-50k, 88.2% for AGIs $50k-75k, 88.1% for AGIs $75k-100k, 61.9% for AGIs over 100k)
Taxable interest for individuals: $1,331 (reported on 39.2% of returns)
This zip code:
$1,331
Tennessee:
$1,802
(% of AGI for various income ranges: 6.3% for AGIs below $10k, 3.4% for AGIs $10k-25k, 1.3% for AGIs $25k-50k, 1.0% for AGIs $50k-75k, 0.9% for AGIs $75k-100k, 1.0% for AGIs over 100k)
Taxable dividends: $1,033 (reported on 12.6% of returns)
Here:
$1,033
State:
$3,727
(% of AGI for various income ranges: 1.6% for AGIs below $10k, 0.6% for AGIs $10k-25k, 0.5% for AGIs $25k-50k, 0.3% for AGIs $50k-75k, 0.2% for AGIs $75k-100k)
Net capital gain/loss: +$2,411 (reported on 11.0% of returns)
Here:
+$2,411
State:
+$15,776
(% of AGI for various income ranges: 0.8% for AGIs $10k-25k, 1.5% for AGIs $25k-50k, 0.0% for AGIs $50k-75k, 1.3% for AGIs $75k-100k)
Profit/loss from business: +$4,828 (reported on 15.6% of returns)
Here:
+$4,828
State:
+$12,882
(% of AGI for various income ranges: 13.0% for AGIs below $10k, 3.6% for AGIs $10k-25k, 1.3% for AGIs $25k-50k, 0.2% for AGIs $50k-75k, 6.5% for AGIs $75k-100k)
IRA payment deduction: $1,824 (reported on 1.8% of returns)
38563:
$1,824
Tennessee:
$2,934
Total itemized deductions: $14,531 (24% of AGI, reported on 16.7% of returns)
Here:
$14,531
State:
$18,035
Here:
23.5% of AGI
State:
19.9% of AGI
(% of AGI for various income ranges: 6.0% for AGIs $10k-25k, 6.0% for AGIs $25k-50k, 7.4% for AGIs $50k-75k, 8.0% for AGIs $75k-100k, 8.9% for AGIs over 100k)
Charity contributions deductions: $3,095 (5% of AGI, reported on 13.0% of returns)
Here:
$3,095
State:
$5,167
Here:
4.8% of AGI
State:
5.3% of AGI
(% of AGI for various income ranges: 1.0% for AGIs $10k-25k, 0.7% for AGIs $25k-50k, 1.5% for AGIs $50k-75k, 1.1% for AGIs $75k-100k, 2.0% for AGIs over 100k)
Total tax: $3,892 (reported on 75.1% of returns)
38563:
$3,892
State:
$7,482
(% of AGI for various income ranges: 3.7% for AGIs below $10k, 3.8% for AGIs $10k-25k, 6.1% for AGIs $25k-50k, 8.2% for AGIs $50k-75k, 11.0% for AGIs $75k-100k, 17.0% for AGIs over 100k)
Earned income credit: $1,635 (reported on 18.3% of returns)
Here:
$1,635
State:
$1,826
Percentage of individuals using paid preparers for their 2004 taxes: 74.0%
Here:
74%
State:
60%
(% for various income ranges: 68.5% for AGIs below $10k, 76.8% for AGIs $10k-25k, 75.7% for AGIs $25k-50k, 72.0% for AGIs $50k-75k, 74.1% for AGIs $75k-100k, 80.8% for AGIs over 100k)
Household received Food Stamps/SNAP in the past 12 months: 72 Household did not receive Food Stamps/SNAP in the past 12 months: 921
Women who had a birth in the past 12 months: 27 (16 now married, 11 unmarried) Women who did not have a birth in the past 12 months: 529 (230 now married, 299 unmarried)
Housing units in zip code 38563 with a mortgage: 382 (66 second mortgage, 63 both second mortgage and home equity loan) Median monthly owner costs for units with a mortgage: $1,535 Median monthly owner costs for units without a mortgage: $449
Residents with income below the poverty level in 2022:
This zip code:
5.3%
Whole state:
13.3%
Residents with income below 50% of the poverty level in 2022:
This zip code:
3.8%
Whole state:
7.1%
Median number of rooms in houses and condos:
Here:
7.0
State:
6.5
Median number of rooms in apartments:
Here:
4.5
State:
4.4
Notable locations in this zip code not listed on our city pages
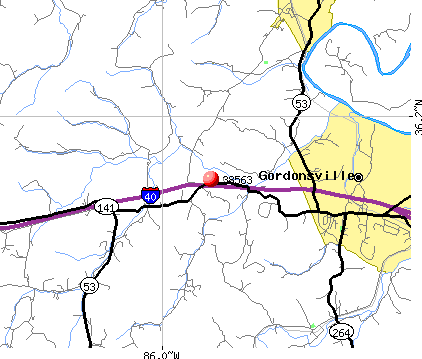
Churches in zip code 38563 include: Ducktown Church (A), Rawls Creek Church (B), Grant Church (C), Gordonsville First Baptist Church (D), Grant Baptist Church (E), Macedonia Baptist Church (F), New Middleton Baptist Church (G). Display/hide their locations on the map
Cemeteries: House Cemetery (1), Tuggle Cemetery (2), Shaver Cemetery (3), Kent Cemetery (4), Baird Cemetery (5), Barnett Cemetery (6), Bradford Cemetery (7). Display/hide their locations on the map
Streams, rivers, and creeks: Hickman Creek (A), Gills Branch (B), Dyer Branch (C), Denny Branch (D), Oliver Branch (E). Display/hide their locations on the map
Size of family households: 288 2-persons, 174 3-persons, 102 4-persons, 58 5-persons, 67 6-persons, 31 7-or-more-persons
Size of nonfamily households: 246 1-person, 19 2-persons
392 married couples with children.
266 single-parent households (42 men, 224 women).
96.3% of residents of 38563 zip code speak English at home.
2.5% of residents speak Spanish at home (84% very well, 16% not well).
0.7% of residents speak other Indo-European language at home (100% very well).
Foreign born population: 19 (0.8%) (52.2% of them are naturalized citizens)
This zip code:
0.8%
Whole state:
5.6%
89%Honduras
44%American
23%English
6%Scotch-Irish
5%Irish
2%German
2%Polish
0%Italian
Year of entry for the foreign-born population
102010 or later
02000 to 2009
101990 to 1999
21Before 1990
Facilities with environmental interests located in this zip code:
DANA CORP TORQUE TRACTION INTEGRATION TECH. INC. (187 SPICER DR. in GORDONSVILLE, TN)
Conditionally Exempt Small Quantity Generators, less than 100 kg/month of hazardous waste (Resource Conservation and Recovery Act (tracking hazardous waste)) - notification TRI REPORTER (Tracking of toxic chemicals releasing facilities) Business SIC classification: MOTOR VEHICLE PARTS AND ACCESSORIES Business NAICS classification: MOTOR VEHICLE BODY MANUFACTURING. Organizations: MICHELLE HARDS (CONTACT/OPERATOR)
, TORQUE TRACTION INT TECH INC (CONTACT/OWNER)
Alternative names: DANA CORP., DANA CORP., SPICER DRIVESHAFT DIV., DANA CORP. SPICER DRIVESHAFT DIV., SPICER DRIVESHAFT ASSEMBLY
A. O. SMITH ELECTRICAL PRODUCTS CO. (168 BENTLEY HARRIS WAY in GORDONSVILLE, TN)
CRITERIA AND HAZARDOUS AIR POLLUTANT INVENTORY (Inventory of air pollution sources) TRI REPORTER (Tracking of toxic chemicals releasing facilities) Business SIC classification: MOTORS AND GENERATORS Business NAICS classification: MOTOR AND GENERATOR MANUFACTURING. Alternative names: A O SMITH ELECTRICAL PRODUCTS CO GORDONSVILLE TN
51.4%Electricity
44.0%Utility gas
3.2%Bottled, tank, or LP gas
1.6%Wood
Population in 1990: 2,630.
Place of birth for U.S.-born residents:
This state: 2,130
Northeast: 29
Midwest: 65
South: 206
West: 59
54% of the 38563 zip code residents lived in the same house 5 years ago. Out of people who lived in different houses, 64% lived in this county. Out of people who lived in different counties, 50% lived in Tennessee.
97% of the 38563 zip code residents lived in the same house 1 year ago. Out of people who lived in different houses, 39% moved from this county. Out of people who lived in different houses, 76% moved from different county within same state.
Private vs. public school enrollment:
Students in private schools in grades 1 to 8 (elementary and middle school): 6
Here:
1.8%
Tennessee:
15.0%
Students in private schools in grades 9 to 12 (high school): 7
Here:
6.7%
Tennessee:
16.2%
Students in private undergraduate colleges: 17
Here:
23.4%
Tennessee:
23.5%
Occupation by median earnings in the past 12 months ($)
185,542Management occupations
54,173Construction and extraction occupations
54,106Business and financial operations occupations
48,527Architecture and engineering occupations
45,414Office and administrative support occupations
43,808Installation, maintenance, and repair occupations
Companies with federal contracts located in this zip code:
DYNATECH SPECIALTY SERVICES IN (480 C GORDONVILLE HWY in GORDONSVILLE, TN; small business)
$69,960 with Air Force for Construction of Structures and Facilities -- Other Industrial Buildings. Signed on 2004-05-19. Completion date: 2004-08-31.
Top industries in this zip code by the number of employees in 2005:
Accommodation and Food Services: Full-Service Restaurants (20-49: 2, 5-9: 2)
Professional, Scientific, and Technical Services: Testing Laboratories (20-49: 1)
Fatal accident statistics in 2014:
Fatal accident count: 1
Vehicles involved in fatal accidents: 2
Fatal accidents caused by drunken drivers: 0
Fatalities: 1
Persons involved in fatal accidents: 2
Pedestrians involved in fatal accidents: 0
Fatal accident statistics in 2013:
Fatal accident count: 1
Vehicles involved in fatal accidents: 1
Fatal accidents caused by drunken drivers: 0
Fatalities: 1
Persons involved in fatal accidents: 2
Pedestrians involved in fatal accidents: 0
2003 - 2018 National Fire Incident Reporting System (NFIRS) incidents
According to the data from the years 2003 - 2018 the average number of fire incidents per year is 27. The highest number of fires - 56 took place in 2005, and the least - 0 in 2017. The data has a dropping trend.
When looking into fire subcategories, the most reports belonged to: Outside Fires (41.6%), and Mobile Property/Vehicle Fires (32.9%).
Fire incident types reported to NFIRS in Zip Code 38563


 Nearest zip codes: 38547, 37151, 37030, 38567, 37012, 38560.


 According to the data from the years 2003 - 2018 the average number of fire incidents per year is 27. The highest number of fires - 56 took place in 2005, and the least - 0 in 2017. The data has a dropping trend.
 When looking into fire subcategories, the most reports belonged to: Outside Fires (41.6%), and Mobile Property/Vehicle Fires (32.9%).