Estimated zip code population in 2022: 1,571 Zip code population in 2010: 1,743 Zip code population in 2000: 1,045
Houses and condos: 657 Renter-occupied apartments: 86
% of renters here:
15%
State:
33%
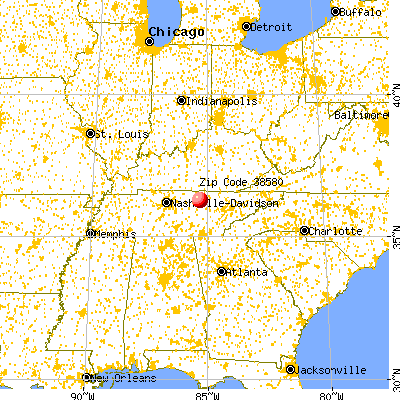
March 2022 cost of living index in zip code 38580: 78.6 (low, U.S. average is 100)
Land area: 34.9 sq. mi. Water area: 0.0 sq. mi.
Population density: 45 people per square mile
(very low).
OSM Map
General Map
Google Map
MSN Map
OSM Map
General Map
Google Map
MSN Map
OSM Map
General Map
Google Map
MSN Map
OSM Map
General Map
Google Map
MSN Map
Please wait while loading the map...
Real estate property taxes paid for housing units in 2022:
This zip code:
0.4% ($956)
Tennessee:
0.5% ($1,376)
Median real estate property taxes paid for housing units with mortgages in 2022: $986 (0.4%) Median real estate property taxes paid for housing units with no mortgage in 2022: $840 (0.4%)
Business Search- 14 Million verified businesses
Males: 740
(47.1%)
Females: 831
(52.9%)
For population 25 years and over in 38580:
High school or higher: 88.4%
Bachelor's degree or higher: 16.3%
Graduate or professional degree: 3.8%
Unemployed: 4.7%
Mean travel time to work (commute): 25.1 minutes
For population 15 years and over in 38580:
Never married: 12.5%
Now married: 74.9%
Separated: 0.0%
Widowed: 7.0%
Divorced: 5.6%
Zip code 38580 compared to state average:
Black race population percentage significantly below state average.
Hispanic race population percentage significantly below state average.
Foreign-born population percentage significantly below state average.
Renting percentage below state average.
Length of stay since moving in above state average.
Number of college students below state average.
Percentage of population with a bachelor's degree or higher below state average.
Estimated median house/condo value in 2022: $241,730
38580:
$241,730
Tennessee:
$284,800
According to our research of Tennessee and other state lists, there were 2 registered sex offenders living in 38580 zip code as of June 17, 2024. The ratio of all residents to sex offenders in zip code 38580 is 743 to 1. The ratio of registered sex offenders to all residents in this zip code is lower than the state average.
Median resident age:
This zip code:
38.6 years
Tennessee median age:
39.2 years
Average household size:
This zip code:
2.7 people
Tennessee:
2.4 people
Averages for the 2020 tax year for zip code 38580, filed in 2021:
Average Adjusted Gross Income (AGI) in 2020: $54,670 (Individual Income Tax Returns)
Here:
$54,670
State:
$69,014
Salary/wage: $50,232 (reported on 80.4% of returns)
Here:
$50,232
State:
$55,872
(% of AGI for various income ranges: 1041.2% for AGIs below $25k, 3314.5% for AGIs $25k-50k, 6360.8% for AGIs $50k-75k, 8897.5% for AGIs $75k-100k, 18990.0% for AGIs $100k-200k)
Taxable interest for individuals: $852 (reported on 33.7% of returns)
This zip code:
$852
Tennessee:
$1,945
(% of AGI for various income ranges: 17.9% for AGIs below $25k, 36.5% for AGIs $25k-50k, 16.7% for AGIs $50k-75k, 18.8% for AGIs $75k-100k, 161.4% for AGIs $100k-200k)
Ordinary dividends: $812 (reported on 8.7% of returns)
Here:
$812
State:
$8,105
(% of AGI for various income ranges: 19.0% for AGIs $25k-50k, 38.6% for AGIs $100k-200k)
Net capital gain/loss in AGI: +$9,909 (reported on 12.0% of returns)
Here:
+$9,909
State:
+$33,664
(% of AGI for various income ranges: 3.8% for AGIs below $25k, 48.5% for AGIs $25k-50k, 225.8% for AGIs $50k-75k, 1018.6% for AGIs $100k-200k)
Profit/loss from business: +$9,722 (reported on 19.6% of returns)
Here:
+$9,722
State:
+$18,991
(% of AGI for various income ranges: 122.9% for AGIs below $25k, 130.0% for AGIs $25k-50k, 328.3% for AGIs $50k-75k, 446.3% for AGIs $75k-100k, 634.3% for AGIs $100k-200k)
Taxable individual retirement arrangement distribution: $18,471 (reported on 7.6% of returns)
38580:
$18,471
Tennessee:
$20,036
(% of AGI for various income ranges: 59.2% for AGIs below $25k, 159.0% for AGIs $25k-50k, 1041.2% for AGIs $75k-100k)
Earned income credit: $2,367 (reported on 16.3% of returns)
Here:
$2,367
State:
$2,391
(% of AGI for various income ranges: 86.7% for AGIs below $25k, 73.5% for AGIs $25k-50k)
Percentage of individuals using paid preparers for their 2020 taxes: 97.8%
Here:
98%
State:
93%
(% for various income ranges: 96.8% for AGIs below $25k, 100.0% for AGIs $25k-50k, 93.8% for AGIs $50k-75k, 100.0% for AGIs $75k-100k, 120.0% for AGIs $100k-200k, 0.0% for AGIs over 200k)
Averages for the 2012 tax year for zip code 38580, filed in 2013:
Average Adjusted Gross Income (AGI) in 2012: $44,118 (Individual Income Tax Returns)
Here:
$44,118
State:
$53,767
Salary/wage: $38,562 (reported on 85.7% of returns)
Here:
$38,562
State:
$45,421
(% of AGI for various income ranges: 72.3% for AGIs below $25k, 84.4% for AGIs $25k-50k, 85.4% for AGIs $50k-75k, 66.9% for AGIs $75k-100k, 64.2% for AGIs $100k-200k)
Taxable interest for individuals: $572 (reported on 37.7% of returns)
This zip code:
$572
Tennessee:
$1,732
(% of AGI for various income ranges: 1.4% for AGIs below $25k, 0.3% for AGIs $25k-50k, 0.3% for AGIs $50k-75k, 0.5% for AGIs $75k-100k, 0.4% for AGIs $100k-200k)
Ordinary dividends: $533 (reported on 7.8% of returns)
Here:
$533
State:
$6,739
Net capital gain/loss in AGI: +$4,271 (reported on 9.1% of returns)
Here:
+$4,271
State:
+$19,082
Profit/loss from business: +$6,573 (reported on 19.5% of returns)
Here:
+$6,573
State:
+$15,240
(% of AGI for various income ranges: 10.9% for AGIs below $25k, 3.3% for AGIs $25k-50k, 2.2% for AGIs $50k-75k, 2.1% for AGIs $75k-100k)
Taxable individual retirement arrangement distribution: $9,257 (reported on 9.1% of returns)
38580:
$9,257
Tennessee:
$15,505
Total itemized deductions: $17,940 (24% of AGI, reported on 19.5% of returns)
Here:
$17,940
State:
$21,976
Here:
24.1% of AGI
State:
17.8% of AGI
(% of AGI for various income ranges: 10.4% for AGIs $25k-50k, 7.7% for AGIs $50k-75k, 9.7% for AGIs $75k-100k, 8.7% for AGIs $100k-200k)
Charity contributions: $4,267 (reported on 15.6% of returns)
Here:
$4,267
State:
$6,709
(% of AGI for various income ranges: 1.1% for AGIs $25k-50k, 1.3% for AGIs $50k-75k, 2.1% for AGIs $75k-100k, 2.3% for AGIs $100k-200k)
Taxes paid: $2,814 (reported on 18.2% of returns)
38580:
$2,814
State:
$4,829
(% of AGI for various income ranges: 1.2% for AGIs $25k-50k, 1.0% for AGIs $50k-75k, 1.6% for AGIs $75k-100k, 1.6% for AGIs $100k-200k)
Earned income credit: $2,133 (reported on 23.4% of returns)
Here:
$2,133
State:
$2,404
(% of AGI for various income ranges: 6.6% for AGIs below $25k, 1.4% for AGIs $25k-50k)
Percentage of individuals using paid preparers for their 2012 taxes: 70.1%
Here:
70%
State:
52%
(% for various income ranges: 66.7% for AGIs below $25k, 66.7% for AGIs $25k-50k, 83.3% for AGIs $50k-75k, 66.7% for AGIs $75k-100k, 80.0% for AGIs $100k-200k)
Averages for the 2004 tax year for zip code 38580, filed in 2005:
Average Adjusted Gross Income (AGI) in 2004: $33,054 (Individual Income Tax Returns)
Here:
$33,054
State:
$44,088
Salary/wage: $31,509 (reported on 88.6% of returns)
Here:
$31,509
State:
$38,825
(% of AGI for various income ranges: 90.1% for AGIs below $10k, 88.2% for AGIs $10k-25k, 86.6% for AGIs $25k-50k, 88.2% for AGIs $50k-75k, 77.9% for AGIs $75k-100k, 66.5% for AGIs over 100k)
Taxable interest for individuals: $719 (reported on 41.0% of returns)
This zip code:
$719
Tennessee:
$1,802
(% of AGI for various income ranges: 3.5% for AGIs below $10k, 1.8% for AGIs $10k-25k, 0.8% for AGIs $25k-50k, 0.7% for AGIs $50k-75k, 0.1% for AGIs $75k-100k, 0.3% for AGIs over 100k)
Taxable dividends: $258 (reported on 9.3% of returns)
Here:
$258
State:
$3,727
(% of AGI for various income ranges: 0.3% for AGIs $10k-25k, 0.0% for AGIs $25k-50k, 0.0% for AGIs $50k-75k, 0.2% for AGIs $75k-100k)
Net capital gain/loss: +$2,554 (reported on 9.7% of returns)
Here:
+$2,554
State:
+$15,776
Profit/loss from business: +$2,662 (reported on 20.8% of returns)
Here:
+$2,662
State:
+$12,882
(% of AGI for various income ranges: -13.5% for AGIs below $10k, 6.9% for AGIs $10k-25k, 2.9% for AGIs $25k-50k, -0.6% for AGIs $50k-75k)
IRA payment deduction: $2,667 (reported on 1.8% of returns)
38580:
$2,667
Tennessee:
$2,934
Total itemized deductions: $15,348 (26% of AGI, reported on 16.7% of returns)
Here:
$15,348
State:
$18,035
Here:
26.4% of AGI
State:
19.9% of AGI
Charity contributions deductions: $3,188 (5% of AGI, reported on 15.1% of returns)
Here:
$3,188
State:
$5,167
Here:
5.3% of AGI
State:
5.3% of AGI
Total tax: $3,236 (reported on 75.9% of returns)
38580:
$3,236
State:
$7,482
(% of AGI for various income ranges: 3.7% for AGIs below $10k, 3.8% for AGIs $10k-25k, 6.2% for AGIs $25k-50k, 8.5% for AGIs $50k-75k, 9.5% for AGIs $75k-100k, 13.7% for AGIs over 100k)
Earned income credit: $1,874 (reported on 22.6% of returns)
Here:
$1,874
State:
$1,826
Percentage of individuals using paid preparers for their 2004 taxes: 74.7%
Here:
75%
State:
60%
(% for various income ranges: 75.7% for AGIs below $10k, 80.3% for AGIs $10k-25k, 70.2% for AGIs $25k-50k, 74.7% for AGIs $50k-75k, 59.1% for AGIs $75k-100k, 68.8% for AGIs over 100k)
Household received Food Stamps/SNAP in the past 12 months: 32 Household did not receive Food Stamps/SNAP in the past 12 months: 545
Women who had a birth in the past 12 months: 35 (36 now married, 0 unmarried) Women who did not have a birth in the past 12 months: 250 (187 now married, 62 unmarried)
Housing units in zip code 38580 with a mortgage: 299 (29 second mortgage, 29 both second mortgage and home equity loan) Median monthly owner costs for units with a mortgage: $1,318 Median monthly owner costs for units without a mortgage: $292
Residents with income below the poverty level in 2022:
This zip code:
8.7%
Whole state:
13.3%
Residents with income below 50% of the poverty level in 2022:
This zip code:
8.7%
Whole state:
7.1%
Median number of rooms in houses and condos:
Here:
5.8
State:
6.5
Median number of rooms in apartments:
Here:
5.3
State:
4.4
Notable locations in this zip code not listed on our city pages
Notable locations in zip code 38580: Dry Hollow Volunteer Fire Department (A), Rickman Volunteer Fire Department (B). Display/hide their locations on the map
Churches in zip code 38580 include: Union Hill Church (A), Three Forks Church (B), Harris Chapel (C), Rickman First Baptist Church (D). Display/hide their locations on the map
Cemeteries: Hartsaw Cemetery (1), Harris Chapel Cemetery (2), Bilbrey Cemetery (3), Phillips Cemetery (4), Qualls Cemetery (5). Display/hide their locations on the map
Size of family households: 174 2-persons, 105 3-persons, 99 4-persons, 26 5-persons, 45 6-persons
Size of nonfamily households: 121 1-person
359 married couples with children.
0 single-parent households ().
99.7% of residents of 38580 zip code speak English at home.
Foreign born population: 0 (0.0%)
:
0.0%
Whole state:
5.6%
62%American
10%English
5%Irish
4%Eastern European
1%German
1%Scottish
Year of entry for the foreign-born population
02010 or later
02000 to 2009
01990 to 1999
1Before 1990
Facilities with environmental interests located in this zip code:
FOREST FLAVORS_INTERNATIONAL, INC. (4890 COOKEVILLE HWY in RICKMAN, TN)
AIR MINOR (AIRS/AFS) Business SIC classification: GUM AND WOOD CHEMICALS
72.7%Electricity
15.0%Utility gas
9.0%Bottled, tank, or LP gas
3.7%Wood
Population in 1990: 2,109.
Place of birth for U.S.-born residents:
This state: 1,070
Northeast: 122
Midwest: 138
South: 178
West: 53
73% of the 38580 zip code residents lived in the same house 5 years ago. Out of people who lived in different houses, 40% lived in this county. Out of people who lived in different counties, 50% lived in Tennessee.
94% of the 38580 zip code residents lived in the same house 1 year ago. Out of people who lived in different houses, 56% moved from this county. Out of people who lived in different houses, 45% moved from different state.
Private vs. public school enrollment:
Students in private schools in grades 1 to 8 (elementary and middle school):
Here:
0.0%
Tennessee:
15.0%
Students in private schools in grades 9 to 12 (high school):
Here:
0.0%
Tennessee:
16.2%
Students in private undergraduate colleges: 23
Here:
55.0%
Tennessee:
23.5%
Occupation by median earnings in the past 12 months ($)
65,538Installation, maintenance, and repair occupations
58,250Transportation occupations
46,785Business and financial operations occupations
45,155Management occupations
44,716Production occupations
35,036Sales and related occupations
Top industries in this zip code by the number of employees in 2005:
Construction: Plumbing, Heating, and Air-Conditioning Contractors (5-9: 1)
Health Care and Social Assistance: Offices of Physicians (except Mental Health Specialists) (5-9: 1)
Other Services (except Public Administration): Other Personal and Household Goods Repair and Maintenance (1-4: 1)
Finance and Insurance: Commercial Banking (1-4: 1)
Other Services (except Public Administration): Commercial and Industrial Machinery and Equipment (except Automotive and Electronic) Repair and Maintenance (1-4: 1)
Accommodation and Food Services: Limited-Service Restaurants (1-4: 1)
People in group quarters in 2000:
2 people in homes for the mentally retarded
Fatal accident statistics in 2014:
Fatal accident count: 1
Vehicles involved in fatal accidents: 2
Fatal accidents caused by drunken drivers: 0
Fatalities: 1
Persons involved in fatal accidents: 3
Pedestrians involved in fatal accidents: 0
Fatal accident statistics in 2012:
Fatal accident count: 1
Vehicles involved in fatal accidents: 2
Fatal accidents caused by drunken drivers: 0
Fatalities: 1
Persons involved in fatal accidents: 6
Pedestrians involved in fatal accidents: 0
2003 - 2018 National Fire Incident Reporting System (NFIRS) incidents
Based on the data from the years 2003 - 2018 the average number of fires per year is 8. The highest number of fire incidents - 20 took place in 2011, and the least - 0 in 2004. The data has an increasing trend.
When looking into fire subcategories, the most incidents belonged to: Structure Fires (47.6%), and Outside Fires (46.8%).
Fire incident types reported to NFIRS in Zip Code 38580


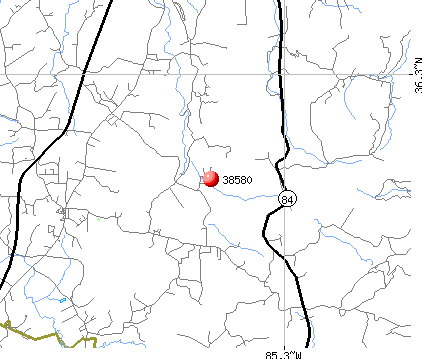 Nearest zip codes: 38570, 38542, 38554, 38543, 38574, 38506.


 Based on the data from the years 2003 - 2018 the average number of fires per year is 8. The highest number of fire incidents - 20 took place in 2011, and the least - 0 in 2004. The data has an increasing trend.
 When looking into fire subcategories, the most incidents belonged to: Structure Fires (47.6%), and Outside Fires (46.8%).