Estimated zip code population in 2022: 2,278 Zip code population in 2010: 2,370 Zip code population in 2000: 2,472
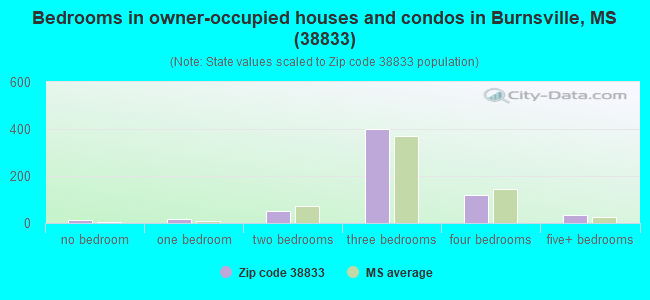
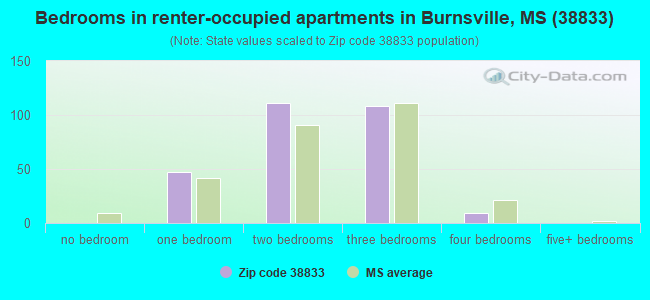
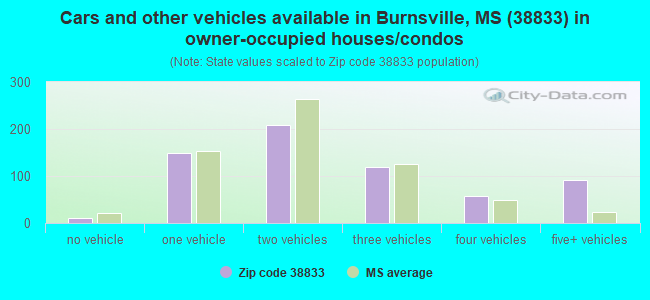
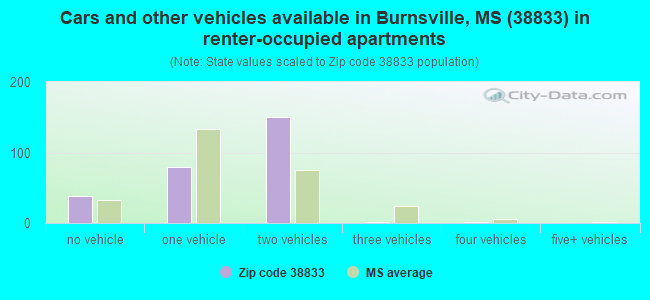
Houses and condos: 1,113 Renter-occupied apartments: 276
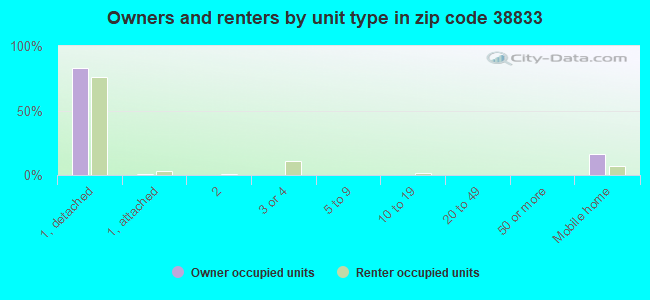
% of renters here:
31%
State:
30%
March 2022 cost of living index in zip code 38833: 77.3 (low, U.S. average is 100)
Land area: 52.5 sq. mi. Water area: 0.9 sq. mi.
Population density: 43 people per square mile
(very low).
OSM Map
General Map
Google Map
MSN Map
OSM Map
General Map
Google Map
MSN Map
OSM Map
General Map
Google Map
MSN Map
OSM Map
General Map
Google Map
MSN Map
Please wait while loading the map...
Real estate property taxes paid for housing units in 2022:
This zip code:
0.5% ($645)
Mississippi:
0.7% ($1,161)
Median real estate property taxes paid for housing units with mortgages in 2022: $544 (0.4%) Median real estate property taxes paid for housing units with no mortgage in 2022: $806 (0.6%)
Business Search- 14 Million verified businesses
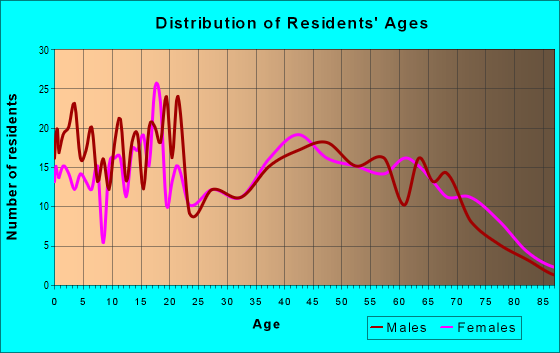
Males: 1,172
(51.5%)
Females: 1,105
(48.5%)
For population 25 years and over in 38833:
High school or higher: 85.6%
Bachelor's degree or higher: 14.1%
Graduate or professional degree: 4.7%
Unemployed: 4.2%
Mean travel time to work (commute): 25.9 minutes
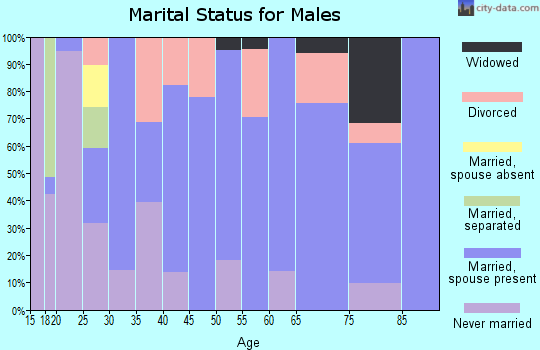
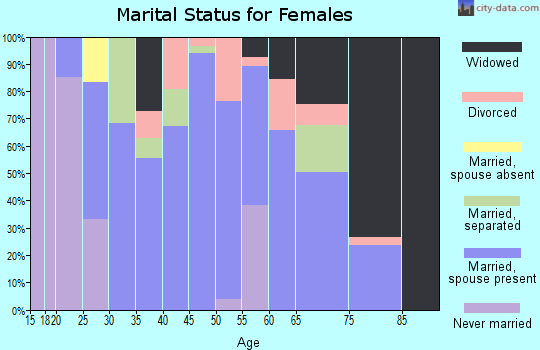
For population 15 years and over in 38833:
Never married: 22.1%
Now married: 60.4%
Separated: 1.8%
Widowed: 7.7%
Divorced: 8.1%
Zip code 38833 compared to state average:
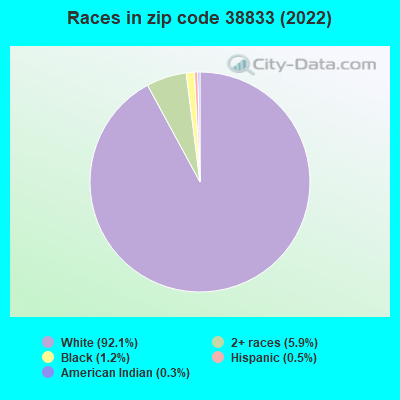
Black race population percentage significantly below state average.
Hispanic race population percentage significantly below state average.
Foreign-born population percentage significantly below state average.
Number of college students below state average.
Percentage of population with a bachelor's degree or higher below state average.
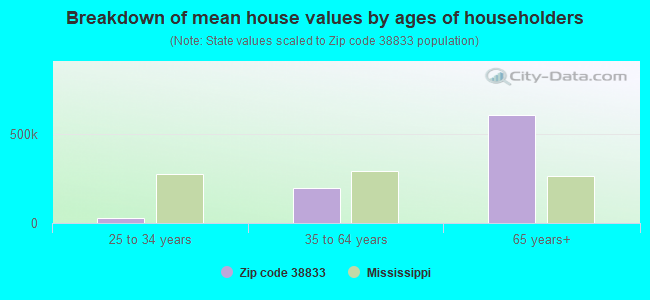
Estimated median house/condo value in 2022: $138,071
38833:
$138,071
Mississippi:
$162,500
According to our research of Mississippi and other state lists, there were 5 registered sex offenders living in 38833 zip code as of May 03, 2024. The ratio of all residents to sex offenders in zip code 38833 is 554 to 1. The ratio of registered sex offenders to all residents in this zip code is lower than the state average.
Median resident age:
This zip code:
35.6 years
Mississippi median age:
38.9 years
Average household size:
This zip code:
2.5 people
Mississippi:
2.5 people
Averages for the 2020 tax year for zip code 38833, filed in 2021:
Average Adjusted Gross Income (AGI) in 2020: $39,469 (Individual Income Tax Returns)
Here:
$39,469
State:
$54,084
Salary/wage: $37,086 (reported on 85.1% of returns)
Here:
$37,086
State:
$45,187
(% of AGI for various income ranges: 1054.0% for AGIs below $25k, 3464.5% for AGIs $25k-50k, 6043.0% for AGIs $50k-75k, 9118.0% for AGIs $75k-100k, 20193.3% for AGIs $100k-200k)
Taxable interest for individuals: $500 (reported on 16.1% of returns)
This zip code:
$500
Mississippi:
$1,434
(% of AGI for various income ranges: 3.0% for AGIs below $25k, 14.5% for AGIs $25k-50k, 6.0% for AGIs $50k-75k, 76.7% for AGIs $100k-200k)
Ordinary dividends: $1,100 (reported on 4.6% of returns)
Here:
$1,100
State:
$6,661
(% of AGI for various income ranges: 44.0% for AGIs $50k-75k)
Net capital gain/loss in AGI: +$1,400 (reported on 4.6% of returns)
Here:
+$1,400
State:
+$16,833
(% of AGI for various income ranges: 25.5% for AGIs $25k-50k)
Profit/loss from business: +$5,925 (reported on 13.8% of returns)
Here:
+$5,925
State:
+$7,724
(% of AGI for various income ranges: 184.7% for AGIs below $25k, 157.0% for AGIs $50k-75k)
Taxable individual retirement arrangement distribution: $6,800 (reported on 3.4% of returns)
38833:
$6,800
Mississippi:
$17,717
(% of AGI for various income ranges: 92.7% for AGIs $25k-50k)
Earned income credit: $2,607 (reported on 32.2% of returns)
Here:
$2,607
State:
$2,689
(% of AGI for various income ranges: 158.0% for AGIs below $25k, 116.4% for AGIs $25k-50k)
Percentage of individuals using paid preparers for their 2020 taxes: 96.6%
Here:
97%
State:
94%
(% for various income ranges: 97.3% for AGIs below $25k, 96.0% for AGIs $25k-50k, 92.3% for AGIs $50k-75k, 100.0% for AGIs $75k-100k, 100.0% for AGIs $100k-200k)
Averages for the 2012 tax year for zip code 38833, filed in 2013:
Average Adjusted Gross Income (AGI) in 2012: $33,039 (Individual Income Tax Returns)
Here:
$33,039
State:
$46,197
Salary/wage: $30,639 (reported on 87.5% of returns)
Here:
$30,639
State:
$38,549
(% of AGI for various income ranges: 74.8% for AGIs below $25k, 83.3% for AGIs $25k-50k, 83.4% for AGIs $50k-75k, 90.5% for AGIs $75k-100k, 73.5% for AGIs $100k-200k)
Taxable interest for individuals: $679 (reported on 15.9% of returns)
This zip code:
$679
Mississippi:
$1,482
(% of AGI for various income ranges: 0.3% for AGIs below $25k, 0.4% for AGIs $25k-50k, 0.5% for AGIs $50k-75k, 0.3% for AGIs $75k-100k)
Ordinary dividends: $375 (reported on 4.5% of returns)
Here:
$375
State:
$5,401
Net capital gain/loss in AGI: +$467 (reported on 3.4% of returns)
Here:
+$467
State:
+$12,121
Profit/loss from business: +$6,913 (reported on 17.0% of returns)
Here:
+$6,913
State:
+$10,220
(% of AGI for various income ranges: 13.0% for AGIs below $25k, 2.1% for AGIs $25k-50k, 1.4% for AGIs $50k-75k)
Taxable individual retirement arrangement distribution: $8,100 (reported on 4.5% of returns)
38833:
$8,100
Mississippi:
$13,665
Total itemized deductions: $18,782 (26% of AGI, reported on 12.5% of returns)
Here:
$18,782
State:
$22,078
Here:
26.0% of AGI
State:
21.8% of AGI
(% of AGI for various income ranges: 6.7% for AGIs $25k-50k, 8.3% for AGIs $50k-75k, 24.3% for AGIs $75k-100k)
Charity contributions: $4,962 (reported on 9.1% of returns)
Here:
$4,962
State:
$6,081
Taxes paid: $3,591 (reported on 12.5% of returns)
38833:
$3,591
State:
$5,794
(% of AGI for various income ranges: 0.8% for AGIs $25k-50k, 1.5% for AGIs $50k-75k, 2.6% for AGIs $75k-100k, 3.2% for AGIs $100k-200k)
Earned income credit: $2,653 (reported on 36.4% of returns)
Here:
$2,653
State:
$2,710
(% of AGI for various income ranges: 11.9% for AGIs below $25k, 1.7% for AGIs $25k-50k)
Percentage of individuals using paid preparers for their 2012 taxes: 71.6%
Here:
72%
State:
60%
(% for various income ranges: 67.4% for AGIs below $25k, 70.8% for AGIs $25k-50k, 80.0% for AGIs $50k-75k, 80.0% for AGIs $75k-100k, 100.0% for AGIs $100k-200k)
Averages for the 2004 tax year for zip code 38833, filed in 2005:
Average Adjusted Gross Income (AGI) in 2004: $27,485 (Individual Income Tax Returns)
Here:
$27,485
State:
$36,110
Salary/wage: $25,816 (reported on 89.4% of returns)
Here:
$25,816
State:
$31,757
(% of AGI for various income ranges: 103.6% for AGIs below $10k, 81.0% for AGIs $10k-25k, 86.2% for AGIs $25k-50k, 88.4% for AGIs $50k-75k, 81.5% for AGIs $75k-100k, 60.0% for AGIs over 100k)
Taxable interest for individuals: $1,260 (reported on 23.0% of returns)
This zip code:
$1,260
Mississippi:
$1,649
(% of AGI for various income ranges: 1.6% for AGIs below $10k, 1.6% for AGIs $10k-25k, 1.3% for AGIs $25k-50k, 0.5% for AGIs $50k-75k, 1.1% for AGIs $75k-100k)
Taxable dividends: $312 (reported on 5.3% of returns)
Here:
$312
State:
$3,089
Net capital gain/loss: +$740 (reported on 5.5% of returns)
Here:
+$740
State:
+$8,427
Profit/loss from business: +$7,069 (reported on 14.5% of returns)
Here:
+$7,069
State:
+$8,818
(% of AGI for various income ranges: 15.2% for AGIs below $10k, 9.1% for AGIs $10k-25k, 3.8% for AGIs $25k-50k, -0.2% for AGIs $50k-75k)
IRA payment deduction: $2,583 (reported on 1.3% of returns)
38833:
$2,583
Mississippi:
$3,024
Total itemized deductions: $16,271 (30% of AGI, reported on 9.4% of returns)
Here:
$16,271
State:
$17,896
Here:
30.2% of AGI
State:
22.5% of AGI
(% of AGI for various income ranges: 2.1% for AGIs $10k-25k, 5.4% for AGIs $25k-50k, 6.9% for AGIs $50k-75k, 17.8% for AGIs $75k-100k)
Charity contributions deductions: $3,697 (7% of AGI, reported on 7.3% of returns)
Here:
$3,697
State:
$4,735
Here:
6.6% of AGI
State:
5.7% of AGI
Total tax: $2,742 (reported on 65.9% of returns)
38833:
$2,742
State:
$5,562
(% of AGI for various income ranges: 2.9% for AGIs below $10k, 3.6% for AGIs $10k-25k, 5.6% for AGIs $25k-50k, 7.4% for AGIs $50k-75k, 11.7% for AGIs $75k-100k, 12.5% for AGIs over 100k)
Earned income credit: $1,893 (reported on 32.1% of returns)
Here:
$1,893
State:
$2,107
Percentage of individuals using paid preparers for their 2004 taxes: 79.2%
Here:
79%
State:
65%
(% for various income ranges: 70.4% for AGIs below $10k, 84.6% for AGIs $10k-25k, 80.7% for AGIs $25k-50k, 79.2% for AGIs $50k-75k, 62.5% for AGIs $75k-100k, 100.0% for AGIs over 100k)
Household received Food Stamps/SNAP in the past 12 months: 114 Household did not receive Food Stamps/SNAP in the past 12 months: 792
Women who had a birth in the past 12 months: 11 (2 now married, 9 unmarried) Women who did not have a birth in the past 12 months: 469 (262 now married, 205 unmarried)
Housing units in zip code 38833 with a mortgage: 246 Houses without a mortgage: 5
Median monthly owner costs for units with a mortgage: $898 Median monthly owner costs for units without a mortgage: $360
Residents with income below the poverty level in 2022:
This zip code:
15.0%
Whole state:
19.1%
Residents with income below 50% of the poverty level in 2022:
This zip code:
7.3%
Whole state:
10.3%
Median number of rooms in houses and condos:
Here:
6.4
State:
6.3
Median number of rooms in apartments:
Here:
5.9
State:
4.8
Notable locations in this zip code not listed on our city pages
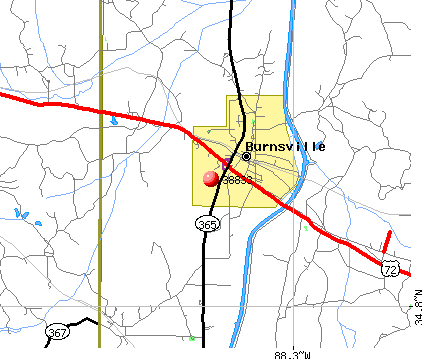
Notable locations in zip code 38833: Holts Spur (A), Burnsville Fire Department (B), Holtspur Volunteer Fire Department (C). Display/hide their locations on the map
Churches in zip code 38833 include: Rowland Mill Church (A), Shady Grove Church (B), Antioch Church (C), Berea Church (D), Twentieth Century Church (E), Burgess Creek Church (F), Grissom Chapel (G), Church of Christ (H), Burnsville United Pentecostal Church (I). Display/hide their locations on the map
Cemeteries: Chapel Hill Cemetery (1), Johnson Cemetery (2), Lambs Chapel Cemetery (3), Opossum Trot Cemetery (4), Stricklen Cemetery (5), Shady Grove Cemetery (6), Rowland Mills Cemetery (7). Display/hide their locations on the map
Streams, rivers, and creeks: Clausel Creek (A), Berea Creek (B), Caroline Branch (C), Caney Creek (D), Utley Branch (E), Burgess Creek (F), Reedy Branch (G), Pine Branch (H), Pigeon Roost Branch (I). Display/hide their locations on the map
Size of family households: 242 2-persons, 83 3-persons, 112 4-persons, 115 5-persons, 32 6-persons
Size of nonfamily households: 245 1-person, 73 2-persons
395 married couples with children.
197 single-parent households (70 men, 127 women).
99.9% of residents of 38833 zip code speak English at home.
0.2% of residents speak Spanish at home (100% very well).
Foreign born population: 0 (0.0%)
:
0.0%
Whole state:
2.2%
38%American
10%Irish
6%English
4%Italian
2%German
1%Danish
1%European
Facilities with environmental interests located in this zip code:
BURNSVILLE POTW (92 FRONT STREET in BURNSVILLE, MS)
STATE MASTER (Mississippi compliance, permits, activity tracking ) - ENSITE-MS0042307, National Pollutant Discharge Elimination System Permit National Pollutant Discharge Elimination System NON-MAJOR (Tracking pollutant discharge elimination systems) - permit Business SIC classification: SEWERAGE SYSTEMS Alternative names: TISHOMINGO COUNTY
CUTSHALL FUNERAL HOME (HIGHWAY 72 WEST in BURNSVILLE, MS)
STATE MASTER (Mississippi compliance, permits, activity tracking ) - ENSITE-MSU020042, WASTEWATER FACILITY National Pollutant Discharge Elimination System NON-MAJOR (Tracking pollutant discharge elimination systems) - permit Business SIC classification: FUNERAL SERVICE AND CREMATORIES Alternative names: TISHOMINGO
BURNSVILLE ELEMENTARY (HWY. 72 EAST in BURNSVILLE, MS)
(National Center for Education Statistics) - STATE ID-7100008 Organizations: TISHOMINGO CO SP MUN SCH DIST (SCHOOL DISTRICT)
Housing units lacking complete plumbing facilities: 5.6% Housing units lacking complete kitchen facilities: 8.0%
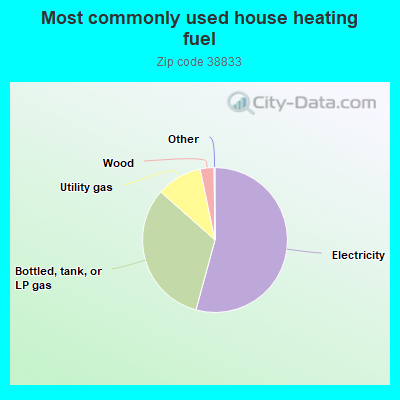
54.4%Electricity
32.4%Bottled, tank, or LP gas
10.2%Utility gas
3.1%Wood
Population in 1990: 3,574.
Place of birth for U.S.-born residents:
This state: 1,828
Northeast: 53
Midwest: 99
South: 286
West: 2
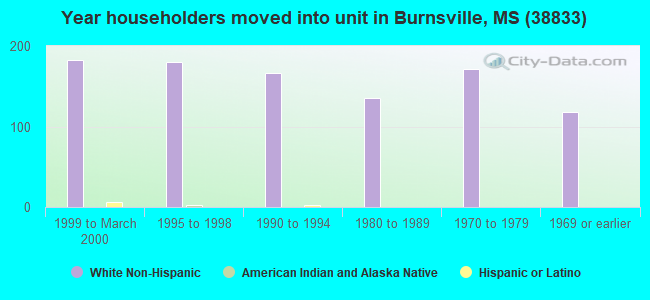
60% of the 38833 zip code residents lived in the same house 5 years ago. Out of people who lived in different houses, 53% lived in this county. Out of people who lived in different counties, 50% lived in Mississippi.
92% of the 38833 zip code residents lived in the same house 1 year ago. Out of people who lived in different houses, 70% moved from this county. Out of people who lived in different houses, 22% moved from different county within same state. Out of people who lived in different houses, 2% moved from different state.
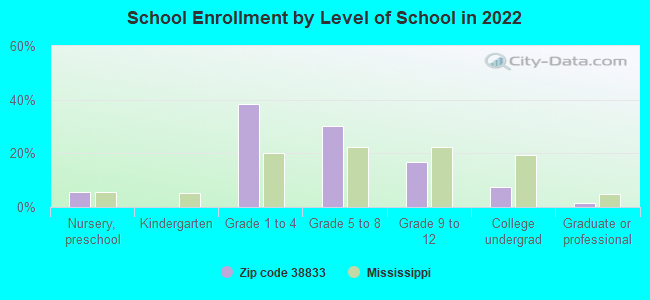
Private vs. public school enrollment:
Students in private schools in grades 1 to 8 (elementary and middle school):
Here:
0.0%
Mississippi:
16.1%
Students in private schools in grades 9 to 12 (high school):
Here:
0.0%
Mississippi:
14.6%
Students in private undergraduate colleges:
Here:
0.0%
Mississippi:
12.8%
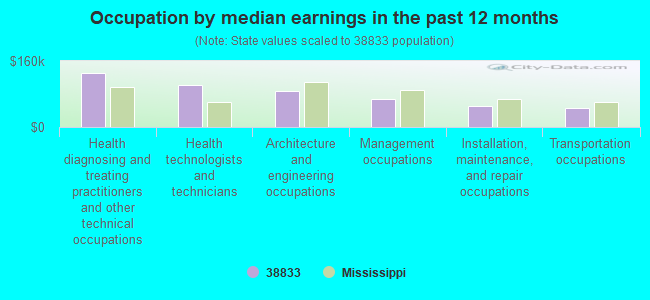
Occupation by median earnings in the past 12 months ($)
131,108Health diagnosing and treating practitioners and other technical occupations
101,829Health technologists and technicians
87,569Architecture and engineering occupations
67,072Management occupations
50,515Installation, maintenance, and repair occupations
44,887Transportation occupations
Companies with federal contracts located in this zip code:
PLANT PROCESS SUPPORT INC (50 INDUSTRIAL PARK in BURNSVILLE, MS; small business) : $135,968 in 3 contractsfrom 2004 to 2006
$65,657 with Army for Material Handling Equipment, Nonself-Propelled. Signed on 2004-07-22. Completion date: 2004-09-17.
$35,983 with Army for Miscellaneous Special Industry Machinery. Signed on 2006-02-28. Completion date: 2006-04-10.
$34,328 with Army for Material Handling Equipment, Nonself-Propelled. Signed on 2005-10-03. Completion date: 2005-11-14.
Top industries in this zip code by the number of employees in 2005:
Other Services (except Public Administration): Commercial and Industrial Machinery and Equipment (except Automotive and Electronic) Repair and Maintenance (20-49 employees: 1 establishment)
Educational Services: Elementary and Secondary Schools (20-49: 1)
Other Services (except Public Administration): General Automotive Repair (5-9: 1, 1-4: 1)
Fatal accident statistics in 2013:
Fatal accident count: 1
Vehicles involved in fatal accidents: 1
Fatal accidents caused by drunken drivers: 1
Fatalities: 1
Persons involved in fatal accidents: 1
Pedestrians involved in fatal accidents: 0
Fatal accident statistics in 2011:
Fatal accident count: 1
Vehicles involved in fatal accidents: 1
Fatal accidents caused by drunken drivers: 1
Fatalities: 1
Persons involved in fatal accidents: 2
Pedestrians involved in fatal accidents: 0
2003 - 2018 National Fire Incident Reporting System (NFIRS) incidents
Based on the data from the years 2003 - 2018 the average number of fires per year is 51. The highest number of fires - 89 took place in 2006, and the least - 23 in 2008. The data has a decreasing trend.
When looking into fire subcategories, the most reports belonged to: Outside Fires (49.0%), and Structure Fires (32.0%).
Fire incident types reported to NFIRS in Zip Code 38833
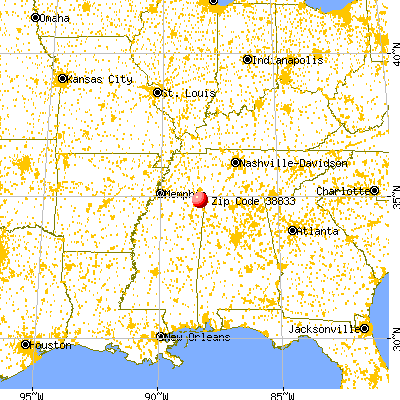


 Nearest zip codes: 38846, 38852, 38326, 38357, 38365, 38376.
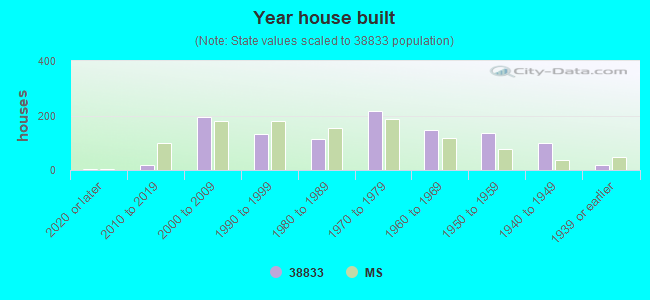


 Based on the data from the years 2003 - 2018 the average number of fires per year is 51. The highest number of fires - 89 took place in 2006, and the least - 23 in 2008. The data has a decreasing trend.
 When looking into fire subcategories, the most reports belonged to: Outside Fires (49.0%), and Structure Fires (32.0%).