Estimated zip code population in 2022: 2,577 Zip code population in 2010: 2,799 Zip code population in 2000: 3,115
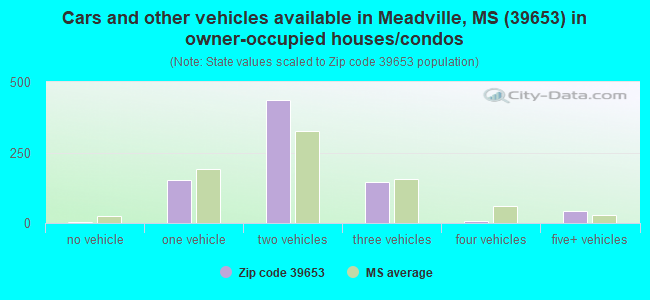
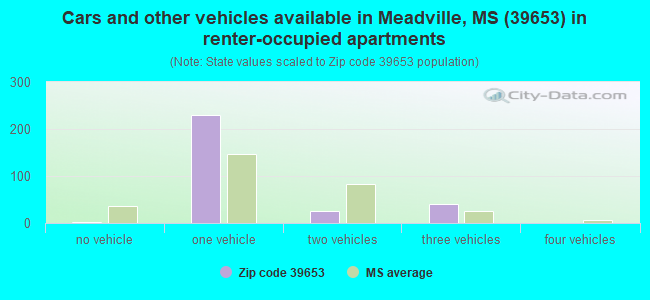
Houses and condos: 1,452 Renter-occupied apartments: 291
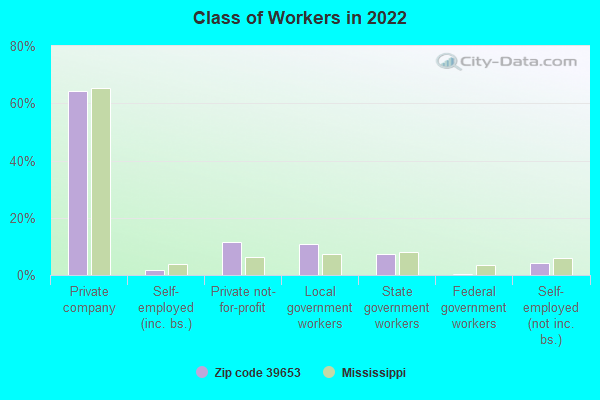
% of renters here:
27%
State:
30%
March 2022 cost of living index in zip code 39653: 75.2 (low, U.S. average is 100)
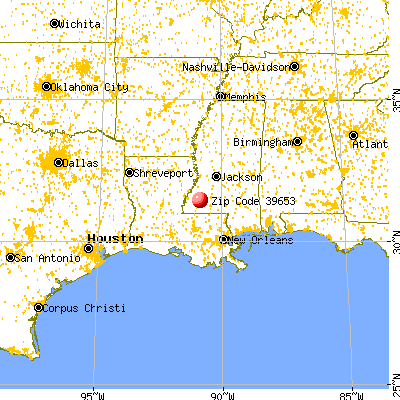
Land area: 219.4 sq. mi. Water area: 2.6 sq. mi.
Population density: 12 people per square mile
(very low).
OSM Map
General Map
Google Map
MSN Map
OSM Map
General Map
Google Map
MSN Map
OSM Map
General Map
Google Map
MSN Map
OSM Map
General Map
Google Map
MSN Map
Please wait while loading the map...
Real estate property taxes paid for housing units in 2022:
This zip code:
0.5% ($575)
Mississippi:
0.7% ($1,161)
Median real estate property taxes paid for housing units with mortgages in 2022: $702 (0.6%) Median real estate property taxes paid for housing units with no mortgage in 2022: $560 (0.5%)
Business Search- 14 Million verified businesses
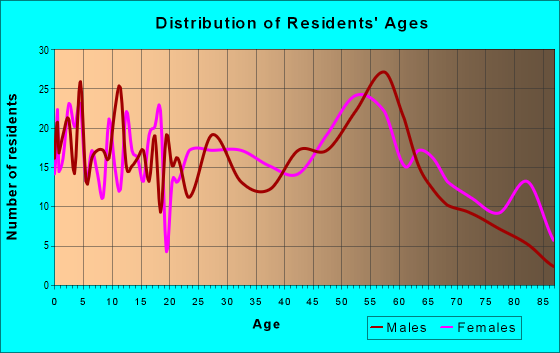
Males: 1,307
(50.7%)
Females: 1,269
(49.3%)
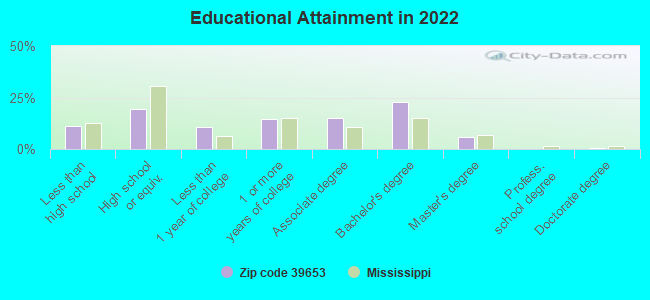
For population 25 years and over in 39653:
High school or higher: 88.7%
Bachelor's degree or higher: 29.2%
Graduate or professional degree: 6.5%
Unemployed: 0.3%
Mean travel time to work (commute): 27.3 minutes
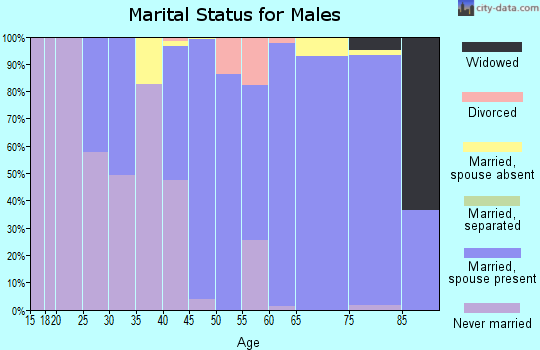
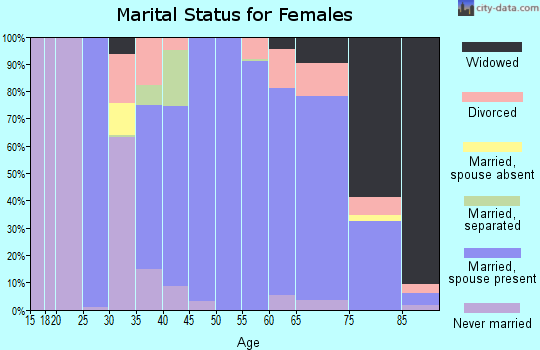
For population 15 years and over in 39653:
Never married: 22.1%
Now married: 57.6%
Separated: 1.2%
Widowed: 5.2%
Divorced: 13.8%
Zip code 39653 compared to state average:
Unemployed percentage significantly below state average.
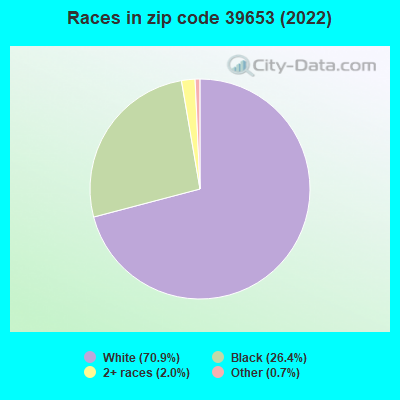
Hispanic race population percentage significantly below state average.
Median age significantly above state average.
Foreign-born population percentage significantly below state average.
Length of stay since moving in significantly above state average.
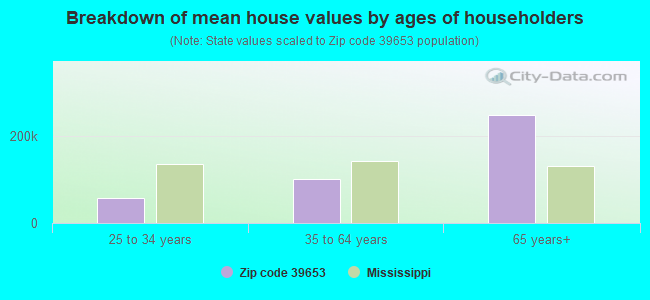
Estimated median house/condo value in 2022: $110,306
39653:
$110,306
Mississippi:
$162,500
According to our research of Mississippi and other state lists, there were 2 registered sex offenders living in 39653 zip code as of April 26, 2024. The ratio of all residents to sex offenders in zip code 39653 is 1,419 to 1. The ratio of registered sex offenders to all residents in this zip code is much lower than the state average.
Median resident age:
This zip code:
49.0 years
Mississippi median age:
38.9 years
Average household size:
This zip code:
2.3 people
Mississippi:
2.5 people
Averages for the 2020 tax year for zip code 39653, filed in 2021:
Average Adjusted Gross Income (AGI) in 2020: $55,629 (Individual Income Tax Returns)
Here:
$55,629
State:
$54,084
Salary/wage: $51,986 (reported on 79.8% of returns)
Here:
$51,986
State:
$45,187
(% of AGI for various income ranges: 1314.8% for AGIs below $25k, 3519.1% for AGIs $25k-50k, 6796.0% for AGIs $50k-75k, 9621.4% for AGIs $75k-100k, 14724.4% for AGIs $100k-200k)
Taxable interest for individuals: $1,056 (reported on 31.2% of returns)
This zip code:
$1,056
Mississippi:
$1,434
(% of AGI for various income ranges: 26.2% for AGIs below $25k, 34.8% for AGIs $25k-50k, 92.0% for AGIs $50k-75k, 62.9% for AGIs $75k-100k, 74.4% for AGIs $100k-200k)
Ordinary dividends: $1,346 (reported on 11.9% of returns)
Here:
$1,346
State:
$6,661
(% of AGI for various income ranges: 20.4% for AGIs $25k-50k, 58.0% for AGIs $50k-75k, 77.8% for AGIs $100k-200k)
Net capital gain/loss in AGI: +$1,508 (reported on 11.9% of returns)
Here:
+$1,508
State:
+$16,833
(% of AGI for various income ranges: 0.9% for AGIs $25k-50k, 58.0% for AGIs $50k-75k, 151.1% for AGIs $100k-200k)
Profit/loss from business: +$3,764 (reported on 20.2% of returns)
Here:
+$3,764
State:
+$7,724
(% of AGI for various income ranges: 144.8% for AGIs below $25k, 34.3% for AGIs $25k-50k, 55.0% for AGIs $50k-75k, 312.2% for AGIs $100k-200k)
Taxable individual retirement arrangement distribution: $17,710 (reported on 9.2% of returns)
39653:
$17,710
Mississippi:
$17,717
(% of AGI for various income ranges: 51.4% for AGIs below $25k, 121.3% for AGIs $25k-50k, 285.0% for AGIs $50k-75k, 1175.6% for AGIs $100k-200k)
Total itemized deductions: $30,700 (reported on 3.7% of returns)
Here:
$30,700
State:
$34,027
(% of AGI for various income ranges: 1364.4% for AGIs $100k-200k)
Charity contributions: $12,400 (reported on 2.8% of returns)
Here:
$12,400
State:
$14,997
(% of AGI for various income ranges: 413.3% for AGIs $100k-200k)
Taxes paid: $6,450 (reported on 3.7% of returns)
39653:
$6,450
State:
$6,353
(% of AGI for various income ranges: 286.7% for AGIs $100k-200k)
Earned income credit: $2,667 (reported on 24.8% of returns)
Here:
$2,667
State:
$2,689
(% of AGI for various income ranges: 160.3% for AGIs below $25k, 110.9% for AGIs $25k-50k)
Percentage of individuals using paid preparers for their 2020 taxes: 94.5%
Here:
94%
State:
94%
(% for various income ranges: 94.7% for AGIs below $25k, 93.1% for AGIs $25k-50k, 100.0% for AGIs $50k-75k, 90.9% for AGIs $75k-100k, 92.3% for AGIs $100k-200k, 100.0% for AGIs over 200k)
Averages for the 2012 tax year for zip code 39653, filed in 2013:
Average Adjusted Gross Income (AGI) in 2012: $47,563 (Individual Income Tax Returns)
Here:
$47,563
State:
$46,197
Salary/wage: $44,160 (reported on 83.5% of returns)
Here:
$44,160
State:
$38,549
(% of AGI for various income ranges: 79.5% for AGIs below $25k, 79.0% for AGIs $25k-50k, 76.9% for AGIs $50k-75k, 76.6% for AGIs $75k-100k, 78.2% for AGIs $100k-200k, 73.8% for AGIs over 200k)
Taxable interest for individuals: $1,074 (reported on 33.0% of returns)
This zip code:
$1,074
Mississippi:
$1,482
(% of AGI for various income ranges: 1.5% for AGIs below $25k, 1.2% for AGIs $25k-50k, 0.6% for AGIs $50k-75k, 0.7% for AGIs $75k-100k, 0.5% for AGIs $100k-200k)
Ordinary dividends: $2,308 (reported on 10.4% of returns)
Here:
$2,308
State:
$5,401
(% of AGI for various income ranges: 0.4% for AGIs below $25k, 1.5% for AGIs $50k-75k, 0.7% for AGIs $100k-200k)
Net capital gain/loss in AGI: +$3,891 (reported on 9.6% of returns)
Here:
+$3,891
State:
+$12,121
(% of AGI for various income ranges: 0.7% for AGIs $25k-50k, 2.1% for AGIs $50k-75k, 1.0% for AGIs $100k-200k)
Profit/loss from business: +$8,183 (reported on 20.0% of returns)
Here:
+$8,183
State:
+$10,220
(% of AGI for various income ranges: 6.1% for AGIs below $25k, 2.0% for AGIs $25k-50k, 0.5% for AGIs $50k-75k, 3.5% for AGIs $75k-100k, 7.1% for AGIs $100k-200k)
Taxable individual retirement arrangement distribution: $8,611 (reported on 7.8% of returns)
39653:
$8,611
Mississippi:
$13,665
(% of AGI for various income ranges: 2.1% for AGIs below $25k, 3.0% for AGIs $25k-50k, 4.2% for AGIs $75k-100k)
Total itemized deductions: $19,023 (21% of AGI, reported on 26.1% of returns)
Here:
$19,023
State:
$22,078
Here:
21.4% of AGI
State:
21.8% of AGI
(% of AGI for various income ranges: 5.6% for AGIs below $25k, 10.9% for AGIs $25k-50k, 9.9% for AGIs $50k-75k, 11.2% for AGIs $75k-100k, 12.0% for AGIs $100k-200k, 10.8% for AGIs over 200k)
Charity contributions: $6,121 (reported on 20.9% of returns)
Here:
$6,121
State:
$6,081
(% of AGI for various income ranges: 3.2% for AGIs $25k-50k, 2.1% for AGIs $50k-75k, 3.0% for AGIs $75k-100k, 5.0% for AGIs $100k-200k)
Taxes paid: $4,657 (reported on 26.1% of returns)
39653:
$4,657
State:
$5,794
(% of AGI for various income ranges: 0.6% for AGIs below $25k, 1.5% for AGIs $25k-50k, 1.9% for AGIs $50k-75k, 2.3% for AGIs $75k-100k, 3.5% for AGIs $100k-200k, 5.4% for AGIs over 200k)
Earned income credit: $2,747 (reported on 27.8% of returns)
Here:
$2,747
State:
$2,710
(% of AGI for various income ranges: 11.7% for AGIs below $25k, 1.8% for AGIs $25k-50k)
Percentage of individuals using paid preparers for their 2012 taxes: 76.5%
Here:
77%
State:
60%
(% for various income ranges: 72.3% for AGIs below $25k, 78.6% for AGIs $25k-50k, 82.4% for AGIs $50k-75k, 70.0% for AGIs $75k-100k, 81.8% for AGIs $100k-200k, 100.0% for AGIs over 200k)
Averages for the 2004 tax year for zip code 39653, filed in 2005:
Average Adjusted Gross Income (AGI) in 2004: $33,870 (Individual Income Tax Returns)
Here:
$33,870
State:
$36,110
Salary/wage: $32,140 (reported on 85.4% of returns)
Here:
$32,140
State:
$31,757
(% of AGI for various income ranges: 92.4% for AGIs below $10k, 78.1% for AGIs $10k-25k, 84.0% for AGIs $25k-50k, 85.5% for AGIs $50k-75k, 81.4% for AGIs $75k-100k, 70.6% for AGIs over 100k)
Taxable interest for individuals: $1,477 (reported on 40.9% of returns)
This zip code:
$1,477
Mississippi:
$1,649
(% of AGI for various income ranges: 4.3% for AGIs below $10k, 3.1% for AGIs $10k-25k, 2.0% for AGIs $25k-50k, 1.4% for AGIs $50k-75k, 1.4% for AGIs $75k-100k, 0.6% for AGIs over 100k)
Taxable dividends: $1,633 (reported on 17.4% of returns)
Here:
$1,633
State:
$3,089
(% of AGI for various income ranges: 1.6% for AGIs below $10k, 0.5% for AGIs $10k-25k, 0.9% for AGIs $25k-50k, 1.5% for AGIs $50k-75k, 0.5% for AGIs $75k-100k, 0.3% for AGIs over 100k)
Net capital gain/loss: +$7,573 (reported on 12.0% of returns)
Here:
+$7,573
State:
+$8,427
(% of AGI for various income ranges: -3.0% for AGIs below $10k, 1.2% for AGIs $10k-25k, 1.1% for AGIs $25k-50k, 2.6% for AGIs $50k-75k, 1.1% for AGIs $75k-100k, 9.0% for AGIs over 100k)
Profit/loss from business: +$3,713 (reported on 13.7% of returns)
Here:
+$3,713
State:
+$8,818
(% of AGI for various income ranges: 3.2% for AGIs below $10k, 3.9% for AGIs $10k-25k, 0.3% for AGIs $25k-50k, 0.4% for AGIs $50k-75k, 3.8% for AGIs over 100k)
IRA payment deduction: $2,900 (reported on 2.5% of returns)
39653:
$2,900
Mississippi:
$3,024
Total itemized deductions: $16,618 (25% of AGI, reported on 20.2% of returns)
Here:
$16,618
State:
$17,896
Here:
25.1% of AGI
State:
22.5% of AGI
(% of AGI for various income ranges: 6.6% for AGIs $10k-25k, 8.9% for AGIs $25k-50k, 11.1% for AGIs $50k-75k, 12.8% for AGIs $75k-100k, 12.4% for AGIs over 100k)
Charity contributions deductions: $5,209 (8% of AGI, reported on 18.0% of returns)
Here:
$5,209
State:
$4,735
Here:
7.5% of AGI
State:
5.7% of AGI
(% of AGI for various income ranges: 1.5% for AGIs $10k-25k, 2.1% for AGIs $25k-50k, 3.1% for AGIs $50k-75k, 3.7% for AGIs $75k-100k, 4.2% for AGIs over 100k)
Total tax: $4,102 (reported on 68.7% of returns)
39653:
$4,102
State:
$5,562
(% of AGI for various income ranges: 2.9% for AGIs below $10k, 3.0% for AGIs $10k-25k, 6.0% for AGIs $25k-50k, 8.1% for AGIs $50k-75k, 10.3% for AGIs $75k-100k, 16.7% for AGIs over 100k)
Earned income credit: $1,920 (reported on 26.1% of returns)
Here:
$1,920
State:
$2,107
Percentage of individuals using paid preparers for their 2004 taxes: 70.2%
Here:
70%
State:
65%
(% for various income ranges: 67.1% for AGIs below $10k, 73.1% for AGIs $10k-25k, 66.8% for AGIs $25k-50k, 73.6% for AGIs $50k-75k, 71.4% for AGIs $75k-100k, 78.7% for AGIs over 100k)
Household received Food Stamps/SNAP in the past 12 months: 112 Household did not receive Food Stamps/SNAP in the past 12 months: 961
Women who had a birth in the past 12 months: 1 (1 now married, 0 unmarried) Women who did not have a birth in the past 12 months: 451 (192 now married, 258 unmarried)
Housing units in zip code 39653 with a mortgage: 108 (30 second mortgage, 3 both second mortgage and home equity loan) Median monthly owner costs for units with a mortgage: $1,363 Median monthly owner costs for units without a mortgage: $371
Residents with income below the poverty level in 2022:
This zip code:
22.5%
Whole state:
19.1%
Residents with income below 50% of the poverty level in 2022:
This zip code:
20.1%
Whole state:
10.3%
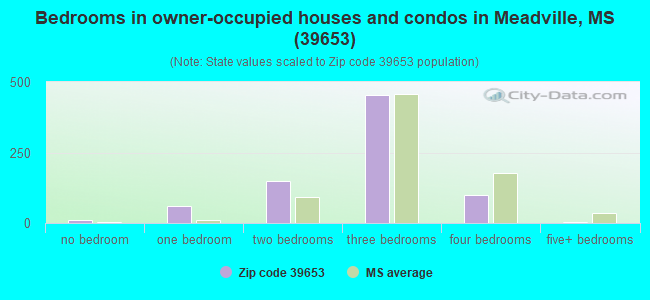
Median number of rooms in houses and condos:
Here:
5.5
State:
6.3
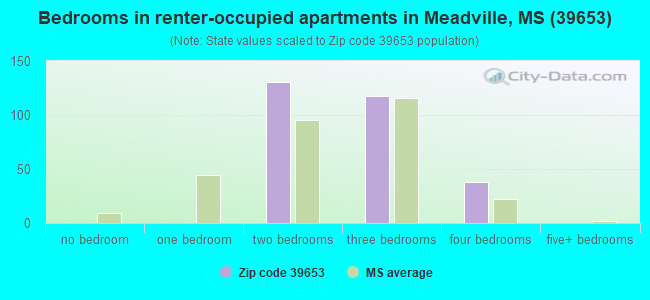
Median number of rooms in apartments:
Here:
6.6
State:
4.8
Notable locations in this zip code not listed on our city pages
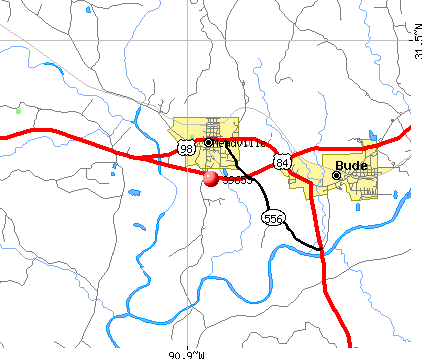
Notable locations in zip code 39653: Bude District Ranger Station (A), Bude Work Center (B), Frankin County Courthouse (C), Meadville Volunteer Fire Department District 5 (D), Bude Volunteer Fire Department (E). Display/hide their locations on the map
Churches in zip code 39653 include: New Hope Baptist Church (A), Bunkley Baptist Church (B), Oak Grove Church (C), Bunkley Church (D), Mount Zinia Church (E), Oak Grove Church (F), Wesley Chapel (G), Siloam Baptist Church (H), Sarepta Baptist Church (I). Display/hide their locations on the map
Cemeteries: Townsel Cemetery (1), Hegan Cemetery (2), Sullivan Cemetery (3), Griffin Cemetery (4), Sixteen Cemetery (5), Scott Cemetery (6), Freeman Cemetery (7). Display/hide their locations on the map
Streams, rivers, and creeks: Bean Branch (A), Booker Branch (B), Cameron Creek (C), Caston Creek (D), Clark Branch (E), Cool Springs Branch (F), Dry Creek (G), Goober Creek (H), Grass Patch Branch (I). Display/hide their locations on the map
In group quarters: 87 (-1 institutionalized population)
Size of family households: 570 2-persons, 98 3-persons, 99 4-persons, 68 5-persons, 7 6-persons
Size of nonfamily households: 216 1-person, 4 2-persons, 10 3-persons
306 married couples with children.
132 single-parent households (132 women).
100.2% of residents of 39653 zip code speak English at home.
0.2% of residents speak other Indo-European language at home (100% very well).
0.2% of residents speak other language at home (100% well).
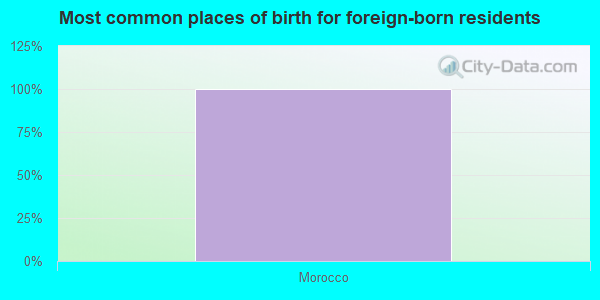
Foreign born population: 2 (0.1%) (100.0% of them are naturalized citizens)
This zip code:
0.1%
Whole state:
2.2%
100%Morocco
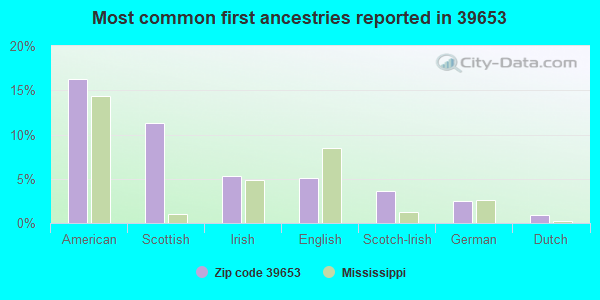
16%American
11%Scottish
5%Irish
5%English
4%Scotch-Irish
2%German
1%Dutch
Year of entry for the foreign-born population
02010 or later
22000 to 2009
51990 to 1999
0Before 1990
Facilities with environmental interests located in this zip code:
FRANKLIN COUNTY SCHOOL DISTRICT, FRANKLIN COUNTY ELEMENTARY SCHOOL (HIGHWAY 98 EAST in MEADVILLE, MS)
STATE MASTER (Mississippi compliance, permits, activity tracking ) - ENSITE-MS0032221, National Pollutant Discharge Elimination System Permit National Pollutant Discharge Elimination System NON-MAJOR (Tracking pollutant discharge elimination systems) - permit Business SIC classification: ELEMENTARY AND SECONDARY SCHOOLS
J D TILLMAN SWINE FACILITY (MEADVILLE OLDENBURG ROAD in MEADVILLE, MS)
STATE MASTER (Mississippi compliance, permits, activity tracking ) - ENSITE-MSU086003, WASTEWATER FACILITY National Pollutant Discharge Elimination System NON-MAJOR (Tracking pollutant discharge elimination systems) - permit Business SIC classification: HOGS; DAIRY FARMS
FRANKLIN HIGH SCHOOL (340 EDISON STREET SOUTH in MEADVILLE, MS)
(Geographic Names Information System) (National Center for Education Statistics) - STATE ID-1900010 Organizations: FRANKLIN CO SCHOOL DIST (SCHOOL DISTRICT)
WILSON BODY SHOP (410 SOUTH WALNUT in MEADVILLE, MS)
STATE MASTER (Mississippi compliance, permits, activity tracking ) - ENSITE-MSR000002899, CESQG Conditionally Exempt Small Quantity Generators, less than 100 kg/month of hazardous waste (Resource Conservation and Recovery Act (tracking hazardous waste)) - notification Organizations: JOHNNY WILSON (CONTACT/OWNER)
FRANKLIN JR HI SCHOOL (236 EDISON STREET SOUTH in MEADVILLE, MS)
(National Center for Education Statistics) - STATE ID-1900008 Organizations: FRANKLIN CO SCHOOL DIST (SCHOOL DISTRICT)
FRANKLIN LOWER ELEMENTARY (481 HWY 98 EAST in MEADVILLE, MS)
(National Center for Education Statistics) - STATE ID-1900004 Organizations: FRANKLIN CO SCHOOL DIST (SCHOOL DISTRICT)
FRANKLIN UPPER ELEMENTARY (409 HWY 98 EAST in MEADVILLE, MS)
(National Center for Education Statistics) - STATE ID-1900006 Organizations: FRANKLIN CO SCHOOL DIST (SCHOOL DISTRICT)
FRANKLIN VOC TECH COMPLEX (129 VO-TECH LANE in MEADVILLE, MS)
(National Center for Education Statistics) - STATE ID-1900090 Organizations: FRANKLIN CO SCHOOL DIST (SCHOOL DISTRICT)
FRANKLIN COUNTY (US 98 @ COLDWATER CHURCH ROAD in MEADVILLE, MS)
National Pollutant Discharge Elimination System NON-MAJOR (Tracking pollutant discharge elimination systems) - permit Business SIC classification: SEWERAGE SYSTEMS Alternative names: OKHISSA LAKE SEWER DISTRICT
FRANKLIN COUNTY SCHOOL DISTRICT (COUNTY COURTHOUSE in MEADVILLE, MS)
COMPLIANCE ACTIVITY (Tracking inspections of insecticide, fungicide, and rodenticide, and toxic substances)
Housing units lacking complete plumbing facilities: 14.6% Housing units lacking complete kitchen facilities: 3.4%
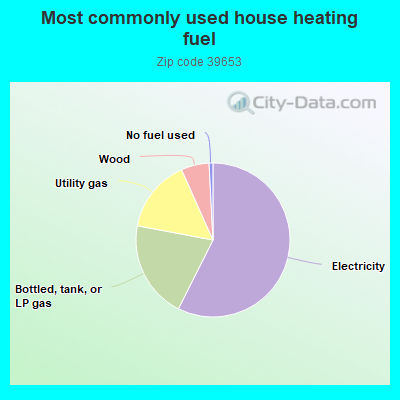
57.6%Electricity
20.6%Bottled, tank, or LP gas
15.4%Utility gas
5.9%Wood
0.8%No fuel used
Population in 1990: 1,673. Population change in the 1990s: +1,442 (+86.2%).
Place of birth for U.S.-born residents:
This state: 2,243
Northeast: 6
Midwest: 23
South: 271
West: 7
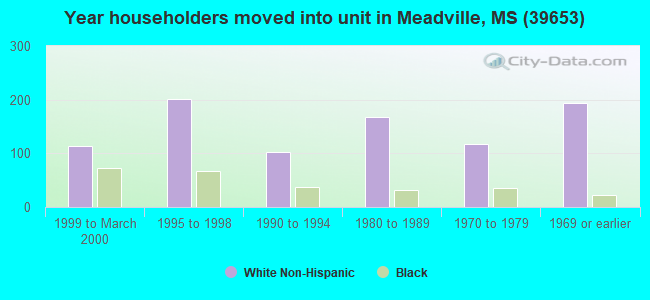
69% of the 39653 zip code residents lived in the same house 5 years ago. Out of people who lived in different houses, 49% lived in this county. Out of people who lived in different counties, 50% lived in Mississippi.
90% of the 39653 zip code residents lived in the same house 1 year ago. Out of people who lived in different houses, 70% moved from this county. Out of people who lived in different houses, 21% moved from different county within same state. Out of people who lived in different houses, 2% moved from different state.
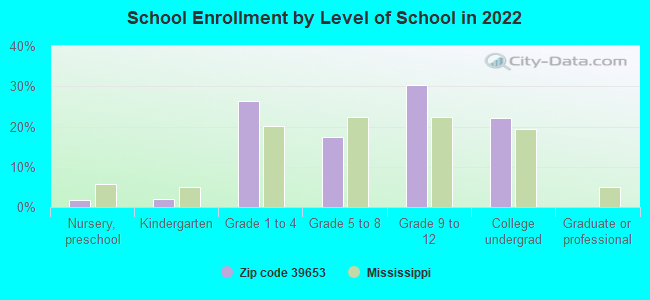
Private vs. public school enrollment:
Students in private schools in grades 1 to 8 (elementary and middle school): 6
Here:
2.2%
Mississippi:
16.1%
Students in private schools in grades 9 to 12 (high school): 1
Here:
0.6%
Mississippi:
14.6%
Students in private undergraduate colleges:
Here:
0.0%
Mississippi:
12.8%
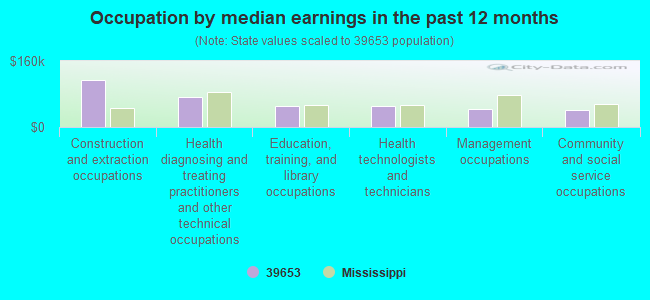
Occupation by median earnings in the past 12 months ($)
114,696Construction and extraction occupations
71,629Health diagnosing and treating practitioners and other technical occupations
50,466Education, training, and library occupations
50,079Health technologists and technicians
43,752Management occupations
40,325Community and social service occupations
Top industries in this zip code by the number of employees in 2005:
Information: Cellular and Other Wireless Telecommunications (100-249 employees: 1 establishment)
Health Care and Social Assistance: General Medical and Surgical Hospitals (100-249: 1)
Health Care and Social Assistance: Nursing Care Facilities (50-99: 1)
Finance and Insurance: Commercial Banking (20-49: 1, 1-4: 1)
Information: Internet Service Providers (20-49: 1)
Health Care and Social Assistance: Ambulance Services (20-49: 1)
Accommodation and Food Services: Full-Service Restaurants (10-19: 1)
People in group quarters in 2010:
57 people in nursing facilities/skilled-nursing facilities
10 people in local jails and other municipal confinement facilities
People in group quarters in 2000:
67 people in nursing homes
14 people in other noninstitutional group quarters
8 people in mental (psychiatric) hospitals or wards
2 people in local jails and other confinement facilities (including police lockups)
2 people in hospitals or wards for drug/alcohol abuse
Fatal accident statistics in 2014:
Fatal accident count: 1
Vehicles involved in fatal accidents: 1
Fatal accidents caused by drunken drivers: 0
Fatalities: 1
Persons involved in fatal accidents: 1
Pedestrians involved in fatal accidents: 0
Fatal accident statistics in 2013:
Fatal accident count: 2
Vehicles involved in fatal accidents: 2
Fatal accidents caused by drunken drivers: 0
Fatalities: 2
Persons involved in fatal accidents: 2
Pedestrians involved in fatal accidents: 1
2003 - 2018 National Fire Incident Reporting System (NFIRS) incidents
Based on the data from the years 2003 - 2018 the average number of fire incidents per year is 26. The highest number of fires - 50 took place in 2005, and the least - 13 in 2015. The data has a rising trend.
When looking into fire subcategories, the most reports belonged to: Outside Fires (53.4%), and Structure Fires (34.2%).
Fire incident types reported to NFIRS in Zip Code 39653


 Nearest zip codes: 39630, 39647, 39661, 39668, 39664, 39069.
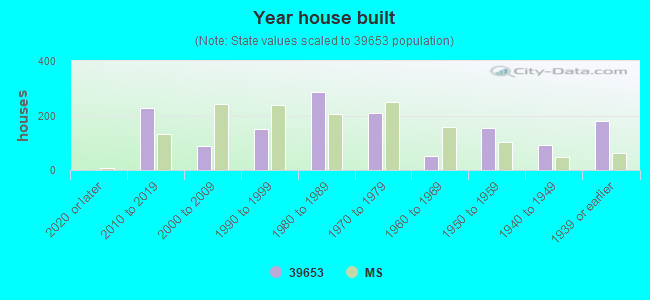


 Based on the data from the years 2003 - 2018 the average number of fire incidents per year is 26. The highest number of fires - 50 took place in 2005, and the least - 13 in 2015. The data has a rising trend.
 When looking into fire subcategories, the most reports belonged to: Outside Fires (53.4%), and Structure Fires (34.2%).