Estimated zip code population in 2022: 839 Zip code population in 2010: 999 Zip code population in 2000: 1,071
Houses and condos: 393 Renter-occupied apartments: 61
% of renters here:
17%
State:
33%
March 2022 cost of living index in zip code 43442: 83.2 (low, U.S. average is 100)
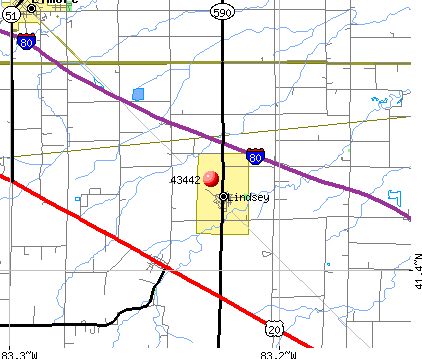
Land area: 17.4 sq. mi. Water area: 0.0 sq. mi.
Population density: 48 people per square mile
(very low).
OSM Map
General Map
Google Map
MSN Map
OSM Map
General Map
Google Map
MSN Map
OSM Map
General Map
Google Map
MSN Map
OSM Map
General Map
Google Map
MSN Map
Please wait while loading the map...
Real estate property taxes paid for housing units in 2022:
This zip code:
0.9% ($1,665)
Ohio:
1.3% ($2,639)
Median real estate property taxes paid for housing units with mortgages in 2022: $1,380 (0.8%) Median real estate property taxes paid for housing units with no mortgage in 2022: $1,820 (1.1%)
Business Search- 14 Million verified businesses
Males: 451
(53.8%)
Females: 388
(46.2%)
For population 25 years and over in 43442:
High school or higher: 94.9%
Bachelor's degree or higher: 14.1%
Graduate or professional degree: 7.1%
Unemployed: 1.0%
Mean travel time to work (commute): 23.7 minutes
For population 15 years and over in 43442:
Never married: 22.5%
Now married: 61.0%
Separated: 2.3%
Widowed: 4.7%
Divorced: 9.4%
Zip code 43442 compared to state average:
Unemployed percentage significantly below state average.
Black race population percentage significantly below state average.
Hispanic race population percentage above state average.
Foreign-born population percentage significantly below state average.
Renting percentage below state average.
Length of stay since moving in significantly above state average.
Number of rooms per house above state average.
House age above state average.
Number of college students below state average.
Percentage of population with a bachelor's degree or higher below state average.
Estimated median house/condo value in 2022: $176,486
43442:
$176,486
Ohio:
$204,100
According to our research of Ohio and other state lists, there was 1 registered sex offender living in 43442 zip code as of June 15, 2024. The ratio of all residents to sex offenders in zip code 43442 is 1,346 to 1. The ratio of registered sex offenders to all residents in this zip code is lower than the state average.
Median resident age:
This zip code:
40.8 years
Ohio median age:
39.9 years
Average household size:
This zip code:
2.3 people
Ohio:
2.4 people
Averages for the 2020 tax year for zip code 43442, filed in 2021:
Average Adjusted Gross Income (AGI) in 2020: $52,111 (Individual Income Tax Returns)
Here:
$52,111
State:
$67,288
Salary/wage: $44,523 (reported on 83.0% of returns)
Here:
$44,523
State:
$55,628
(% of AGI for various income ranges: 1159.0% for AGIs below $25k, 3893.3% for AGIs $25k-50k, 6251.4% for AGIs $50k-75k, 8775.0% for AGIs $75k-100k, 19576.7% for AGIs $100k-200k)
Taxable interest for individuals: $760 (reported on 28.3% of returns)
This zip code:
$760
Ohio:
$1,518
(% of AGI for various income ranges: 16.0% for AGIs below $25k, 16.7% for AGIs $25k-50k, 32.9% for AGIs $50k-75k, 30.0% for AGIs $75k-100k, 143.3% for AGIs $100k-200k)
Ordinary dividends: $1,427 (reported on 20.8% of returns)
Here:
$1,427
State:
$7,167
(% of AGI for various income ranges: 56.0% for AGIs below $25k, 62.9% for AGIs $50k-75k, 190.0% for AGIs $100k-200k)
Net capital gain/loss in AGI: +$1,310 (reported on 18.9% of returns)
Here:
+$1,310
State:
+$18,919
(% of AGI for various income ranges: 49.0% for AGIs below $25k, 80.0% for AGIs $50k-75k, 86.7% for AGIs $100k-200k)
Profit/loss from business: +$5,060 (reported on 9.4% of returns)
Here:
+$5,060
State:
+$13,744
(% of AGI for various income ranges: 210.8% for AGIs $25k-50k)
Taxable individual retirement arrangement distribution: $15,667 (reported on 11.3% of returns)
43442:
$15,667
Ohio:
$18,876
(% of AGI for various income ranges: 300.0% for AGIs below $25k, 914.3% for AGIs $50k-75k)
Earned income credit: $2,183 (reported on 11.3% of returns)
Here:
$2,183
State:
$2,304
(% of AGI for various income ranges: 78.0% for AGIs below $25k, 44.2% for AGIs $25k-50k)
Percentage of individuals using paid preparers for their 2020 taxes: 94.3%
Here:
94%
State:
94%
(% for various income ranges: 100.0% for AGIs below $25k, 93.8% for AGIs $25k-50k, 88.9% for AGIs $50k-75k, 100.0% for AGIs $75k-100k, 85.7% for AGIs $100k-200k)
Averages for the 2012 tax year for zip code 43442, filed in 2013:
Average Adjusted Gross Income (AGI) in 2012: $48,742 (Individual Income Tax Returns)
Here:
$48,742
State:
$54,926
Salary/wage: $41,829 (reported on 82.0% of returns)
Here:
$41,829
State:
$45,869
(% of AGI for various income ranges: 64.0% for AGIs below $25k, 76.3% for AGIs $25k-50k, 71.0% for AGIs $50k-75k, 78.6% for AGIs $75k-100k, 62.1% for AGIs $100k-200k)
Taxable interest for individuals: $639 (reported on 36.0% of returns)
This zip code:
$639
Ohio:
$1,297
(% of AGI for various income ranges: 1.9% for AGIs below $25k, 0.4% for AGIs $25k-50k, 0.4% for AGIs $50k-75k, 0.3% for AGIs $75k-100k, 0.3% for AGIs $100k-200k)
Ordinary dividends: $1,745 (reported on 22.0% of returns)
Here:
$1,745
State:
$5,821
(% of AGI for various income ranges: 1.1% for AGIs below $25k, 1.1% for AGIs $25k-50k, 0.8% for AGIs $50k-75k, 1.0% for AGIs $100k-200k)
Net capital gain/loss in AGI: +$1,233 (reported on 12.0% of returns)
Here:
+$1,233
State:
+$11,232
(% of AGI for various income ranges: 0.5% for AGIs $25k-50k, 1.0% for AGIs $75k-100k)
Profit/loss from business: +$3,400 (reported on 12.0% of returns)
Here:
+$3,400
State:
+$12,773
(% of AGI for various income ranges: 6.9% for AGIs below $25k, 1.1% for AGIs $50k-75k)
Taxable individual retirement arrangement distribution: $9,333 (reported on 12.0% of returns)
43442:
$9,333
Ohio:
$14,511
(% of AGI for various income ranges: 9.8% for AGIs $25k-50k)
Total itemized deductions: $19,482 (22% of AGI, reported on 22.0% of returns)
Here:
$19,482
State:
$21,278
Here:
21.7% of AGI
State:
18.8% of AGI
(% of AGI for various income ranges: 9.3% for AGIs $25k-50k, 7.3% for AGIs $50k-75k, 9.7% for AGIs $75k-100k, 11.5% for AGIs $100k-200k)
Charity contributions: $5,475 (reported on 16.0% of returns)
Here:
$5,475
State:
$3,943
(% of AGI for various income ranges: 2.1% for AGIs below $25k, 2.9% for AGIs $50k-75k, 3.5% for AGIs $100k-200k)
Taxes paid: $6,191 (reported on 22.0% of returns)
43442:
$6,191
State:
$9,568
(% of AGI for various income ranges: 1.9% for AGIs $25k-50k, 2.1% for AGIs $50k-75k, 2.8% for AGIs $75k-100k, 4.8% for AGIs $100k-200k)
Earned income credit: $2,250 (reported on 16.0% of returns)
Here:
$2,250
State:
$2,285
(% of AGI for various income ranges: 5.6% for AGIs below $25k, 1.0% for AGIs $25k-50k)
Percentage of individuals using paid preparers for their 2012 taxes: 70.0%
Here:
70%
State:
51%
(% for various income ranges: 58.8% for AGIs below $25k, 80.0% for AGIs $25k-50k, 62.5% for AGIs $50k-75k, 80.0% for AGIs $75k-100k, 80.0% for AGIs $100k-200k)
Averages for the 2004 tax year for zip code 43442, filed in 2005:
Average Adjusted Gross Income (AGI) in 2004: $36,603 (Individual Income Tax Returns)
Here:
$36,603
State:
$44,480
Salary/wage: $34,223 (reported on 84.4% of returns)
Here:
$34,223
State:
$39,198
(% of AGI for various income ranges: 80.7% for AGIs below $10k, 71.5% for AGIs $10k-25k, 82.0% for AGIs $25k-50k, 82.9% for AGIs $50k-75k, 85.2% for AGIs $75k-100k, 61.9% for AGIs over 100k)
Taxable interest for individuals: $902 (reported on 47.2% of returns)
This zip code:
$902
Ohio:
$1,532
(% of AGI for various income ranges: 2.0% for AGIs below $10k, 3.0% for AGIs $10k-25k, 1.8% for AGIs $25k-50k, 0.4% for AGIs $50k-75k, 0.2% for AGIs $75k-100k, 0.2% for AGIs over 100k)
Taxable dividends: $1,288 (reported on 27.1% of returns)
Here:
$1,288
State:
$3,496
(% of AGI for various income ranges: 2.2% for AGIs below $10k, 1.1% for AGIs $10k-25k, 1.4% for AGIs $25k-50k, 0.7% for AGIs $50k-75k, 0.3% for AGIs $75k-100k, 0.7% for AGIs over 100k)
Net capital gain/loss: +$1,010 (reported on 17.6% of returns)
Here:
+$1,010
State:
+$8,582
(% of AGI for various income ranges: -1.5% for AGIs below $10k, 0.3% for AGIs $10k-25k, -0.1% for AGIs $25k-50k, 0.7% for AGIs $50k-75k, 2.5% for AGIs over 100k)
Profit/loss from business: +$2,875 (reported on 9.9% of returns)
Here:
+$2,875
State:
+$10,813
IRA payment deduction: $2,938 (reported on 2.8% of returns)
43442:
$2,938
Ohio:
$2,794
Total itemized deductions: $13,431 (23% of AGI, reported on 27.1% of returns)
Here:
$13,431
State:
$17,503
Here:
23.4% of AGI
State:
20.8% of AGI
(% of AGI for various income ranges: 4.3% for AGIs $10k-25k, 10.8% for AGIs $25k-50k, 11.1% for AGIs $50k-75k, 8.8% for AGIs $75k-100k, 13.2% for AGIs over 100k)
Charity contributions deductions: $2,043 (3% of AGI, reported on 20.4% of returns)
Here:
$2,043
State:
$3,087
Here:
3.3% of AGI
State:
3.4% of AGI
(% of AGI for various income ranges: 6.9% for AGIs below $10k, 0.9% for AGIs $25k-50k, 1.3% for AGIs $50k-75k, 1.0% for AGIs $75k-100k, 1.6% for AGIs over 100k)
Total tax: $4,045 (reported on 79.4% of returns)
43442:
$4,045
State:
$6,781
(% of AGI for various income ranges: 2.2% for AGIs below $10k, 4.8% for AGIs $10k-25k, 7.1% for AGIs $25k-50k, 8.3% for AGIs $50k-75k, 10.9% for AGIs $75k-100k, 16.1% for AGIs over 100k)
Earned income credit: $1,641 (reported on 6.9% of returns)
Here:
$1,641
State:
$1,696
Percentage of individuals using paid preparers for their 2004 taxes: 66.3%
Here:
66%
State:
55%
(% for various income ranges: 53.3% for AGIs below $10k, 72.9% for AGIs $10k-25k, 70.1% for AGIs $25k-50k, 52.3% for AGIs $50k-75k, 79.4% for AGIs $75k-100k, 81.8% for AGIs over 100k)
In group quarters: 13 (-1 institutionalized population)
Size of family households: 152 2-persons, 17 3-persons, 63 4-persons, 5 5-persons, 11 6-persons, 1 7-or-more-persons
Size of nonfamily households: 102 1-person, 6 2-persons
60 married couples with children.
91 single-parent households (16 men, 75 women).
99.1% of residents of 43442 zip code speak English at home.
0.5% of residents speak Spanish at home (100% very well).
0.7% of residents speak other Indo-European language at home (60% very well, 40% not at all).
Foreign born population: 12 (1.5%) (83.6% of them are naturalized citizens)
This zip code:
1.5%
Whole state:
5.0%
67%Italy
25%Nepal
46%German
22%American
16%English
3%Polish
3%Portuguese
3%Irish
1%Swiss
Year of entry for the foreign-born population
22010 or later
32000 to 2009
01990 to 1999
10Before 1990
Housing units lacking complete kitchen facilities: 0.2%
50.4%Utility gas
19.5%Bottled, tank, or LP gas
16.7%Electricity
12.7%Wood
1.1%Fuel oil, kerosene, etc.
Population in 1990: 1,646.
Place of birth for U.S.-born residents:
This state: 702
Northeast: 22
Midwest: 33
South: 59
West: 2
68% of the 43442 zip code residents lived in the same house 5 years ago. Out of people who lived in different houses, 67% lived in this county. Out of people who lived in different counties, 50% lived in Ohio.
99% of the 43442 zip code residents lived in the same house 1 year ago. Out of people who lived in different houses, 67% moved from this county. Out of people who lived in different houses, 50% moved from different county within same state. Out of people who lived in different houses, 50% moved from different state.
Private vs. public school enrollment:
Students in private schools in grades 1 to 8 (elementary and middle school): 6
Here:
8.1%
Ohio:
16.0%
Students in private schools in grades 9 to 12 (high school): 2
Here:
6.4%
Ohio:
13.1%
Students in private undergraduate colleges:
Here:
0.0%
Ohio:
22.3%
Occupation by median earnings in the past 12 months ($)
71,538Health diagnosing and treating practitioners and other technical occupations
54,261Construction and extraction occupations
44,696Education, training, and library occupations
41,392Management occupations
36,863Health technologists and technicians
35,831Office and administrative support occupations
Top industries in this zip code by the number of employees in 2005:
Utilities: Electric Power Distribution (20-49 employees: 1 establishment, 1-4 employees: 1 establishment)
Wholesale Trade: Grain and Field Bean Merchant Wholesalers (10-19: 1)
Construction: All Other Specialty Trade Contractors (5-9: 1)
Construction: Drywall and Insulation Contractors (5-9: 1)
Other Services (except Public Administration): Religious Organizations (1-4: 1)
Health Care and Social Assistance: Offices of Chiropractors (1-4: 1)
Construction: Poured Concrete Foundation and Structure Contractors (1-4: 1)
Other Services (except Public Administration): Other Similar Organizations (except Business, Professional, Labor, and Political Organizations) (1-4: 1)
People in group quarters in 2000:
11 people in agriculture workers' dormitories on farms
6 people in unknown juvenile institutions
Fatal accident statistics in 2012:
Fatal accident count: 1
Vehicles involved in fatal accidents: 2
Fatal accidents caused by drunken drivers: 1
Fatalities: 1
Persons involved in fatal accidents: 2
Pedestrians involved in fatal accidents: 0
2002 - 2018 National Fire Incident Reporting System (NFIRS) incidents
According to the data from the years 2002 - 2018 the average number of fire incidents per year is 9. The highest number of fire incidents - 30 took place in 2005, and the least - 1 in 2002. The data has an increasing trend.
When looking into fire subcategories, the most incidents belonged to: Outside Fires (38.5%), and Mobile Property/Vehicle Fires (31.1%).
Fire incident types reported to NFIRS in Zip Code 43442

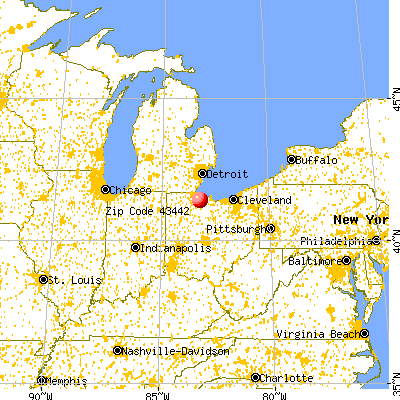


 Nearest zip codes: 43416, 43458, 43431, 43420, 43449, 43435.


 According to the data from the years 2002 - 2018 the average number of fire incidents per year is 9. The highest number of fire incidents - 30 took place in 2005, and the least - 1 in 2002. The data has an increasing trend.
 When looking into fire subcategories, the most incidents belonged to: Outside Fires (38.5%), and Mobile Property/Vehicle Fires (31.1%).