Estimated zip code population in 2022: 1,057 Zip code population in 2010: 1,236 Zip code population in 2000: 1,411
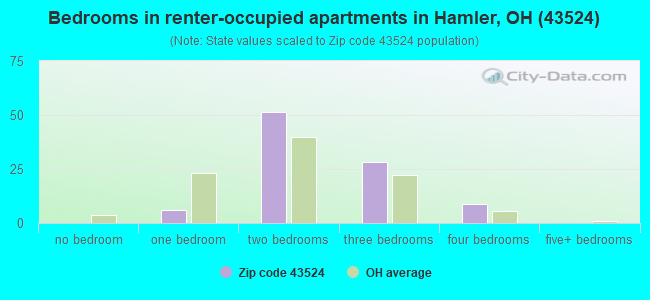
Houses and condos: 514 Renter-occupied apartments: 95
% of renters here:
20%
State:
33%
March 2022 cost of living index in zip code 43524: 83.6 (less than average, U.S. average is 100)
Land area: 30.1 sq. mi. Water area: 0.0 sq. mi.
Population density: 35 people per square mile
(very low).
OSM Map
General Map
Google Map
MSN Map
OSM Map
General Map
Google Map
MSN Map
OSM Map
General Map
Google Map
MSN Map
OSM Map
General Map
Google Map
MSN Map
Please wait while loading the map...
Real estate property taxes paid for housing units in 2022:
This zip code:
1.2% ($2,207)
Ohio:
1.3% ($2,639)
Median real estate property taxes paid for housing units with mortgages in 2022: $1,857 (1.2%) Median real estate property taxes paid for housing units with no mortgage in 2022: $2,443 (1.4%)
Business Search- 14 Million verified businesses
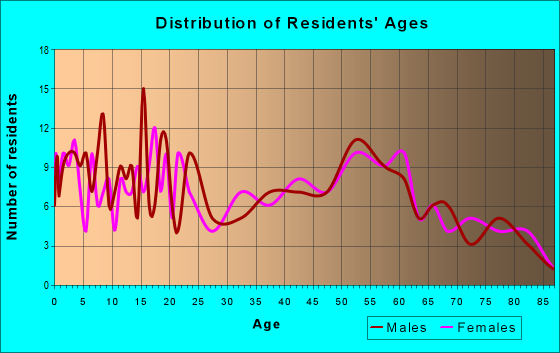
Males: 578
(54.7%)
Females: 478
(45.3%)
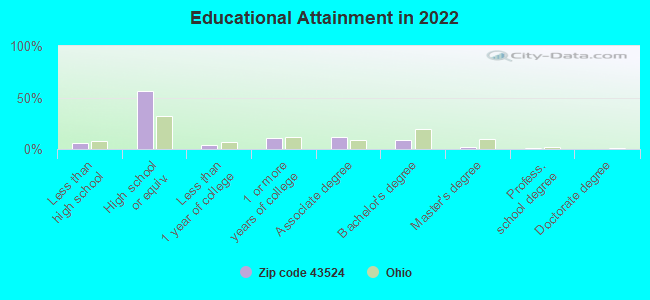
For population 25 years and over in 43524:
High school or higher: 92.2%
Bachelor's degree or higher: 11.5%
Graduate or professional degree: 3.2%
Unemployed: 4.2%
Mean travel time to work (commute): 30.1 minutes
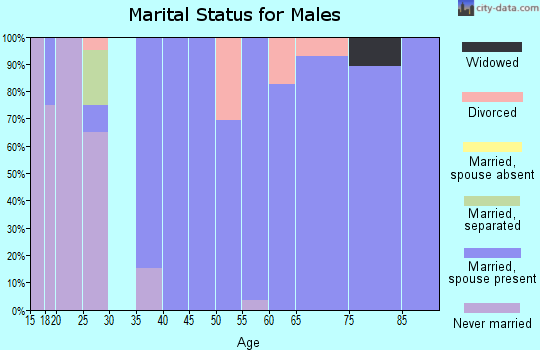
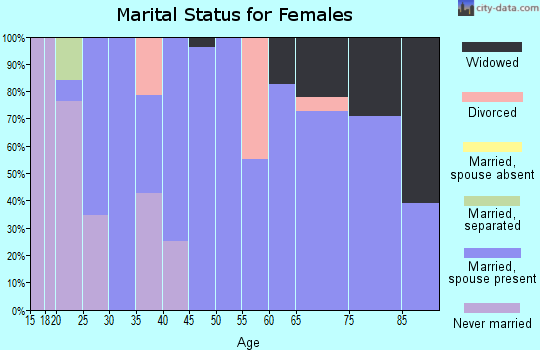
For population 15 years and over in 43524:
Never married: 20.7%
Now married: 59.1%
Separated: 2.1%
Widowed: 9.9%
Divorced: 8.1%
Zip code 43524 compared to state average:
Black race population percentage significantly below state average.
Hispanic race population percentage above state average.
Median age above state average.
Foreign-born population percentage significantly below state average.
Renting percentage below state average.
Length of stay since moving in significantly above state average.
House age above state average.
Percentage of population with a bachelor's degree or higher significantly below state average.
Averages for the 2020 tax year for zip code 43524, filed in 2021:
Average Adjusted Gross Income (AGI) in 2020: $56,700 (Individual Income Tax Returns)
Here:
$56,700
State:
$67,288
Salary/wage: $49,267 (reported on 77.4% of returns)
Here:
$49,267
State:
$55,628
(% of AGI for various income ranges: 1229.1% for AGIs below $25k, 4165.6% for AGIs $25k-50k, 7344.3% for AGIs $50k-75k, 12697.5% for AGIs $75k-100k, 20817.5% for AGIs $100k-200k)
Taxable interest for individuals: $1,154 (reported on 38.7% of returns)
This zip code:
$1,154
Ohio:
$1,518
(% of AGI for various income ranges: 32.7% for AGIs below $25k, 25.6% for AGIs $25k-50k, 104.3% for AGIs $50k-75k, 77.5% for AGIs $75k-100k, 285.0% for AGIs $100k-200k)
Ordinary dividends: $1,293 (reported on 22.6% of returns)
Here:
$1,293
State:
$7,167
(% of AGI for various income ranges: 2.7% for AGIs below $25k, 15.6% for AGIs $25k-50k, 44.3% for AGIs $50k-75k, 70.0% for AGIs $75k-100k, 262.5% for AGIs $100k-200k)
Net capital gain/loss in AGI: +$5,500 (reported on 12.9% of returns)
Here:
+$5,500
State:
+$18,919
(% of AGI for various income ranges: 0.9% for AGIs below $25k, 102.9% for AGIs $50k-75k, 917.5% for AGIs $100k-200k)
Profit/loss from business: +$12,440 (reported on 8.1% of returns)
Here:
+$12,440
State:
+$13,744
(% of AGI for various income ranges: 470.0% for AGIs $25k-50k, 497.5% for AGIs $75k-100k)
Taxable individual retirement arrangement distribution: $13,244 (reported on 14.5% of returns)
43524:
$13,244
Ohio:
$18,876
(% of AGI for various income ranges: 682.2% for AGIs $25k-50k, 1445.0% for AGIs $75k-100k)
Earned income credit: $1,983 (reported on 9.7% of returns)
Here:
$1,983
State:
$2,304
(% of AGI for various income ranges: 66.4% for AGIs below $25k, 51.1% for AGIs $25k-50k)
Percentage of individuals using paid preparers for their 2020 taxes: 83.9%
Here:
84%
State:
94%
(% for various income ranges: 73.7% for AGIs below $25k, 78.6% for AGIs $25k-50k, 91.7% for AGIs $50k-75k, 87.5% for AGIs $75k-100k, 100.0% for AGIs $100k-200k)
Averages for the 2012 tax year for zip code 43524, filed in 2013:
Average Adjusted Gross Income (AGI) in 2012: $45,978 (Individual Income Tax Returns)
Here:
$45,978
State:
$54,926
Salary/wage: $41,108 (reported on 80.0% of returns)
Here:
$41,108
State:
$45,869
(% of AGI for various income ranges: 69.1% for AGIs below $25k, 72.1% for AGIs $25k-50k, 72.6% for AGIs $50k-75k, 75.6% for AGIs $75k-100k, 68.0% for AGIs $100k-200k)
Taxable interest for individuals: $877 (reported on 40.0% of returns)
This zip code:
$877
Ohio:
$1,297
(% of AGI for various income ranges: 1.3% for AGIs below $25k, 1.1% for AGIs $25k-50k, 0.7% for AGIs $50k-75k, 0.4% for AGIs $75k-100k, 0.8% for AGIs $100k-200k)
Ordinary dividends: $912 (reported on 26.2% of returns)
Here:
$912
State:
$5,821
(% of AGI for various income ranges: 0.3% for AGIs below $25k, 0.6% for AGIs $25k-50k, 0.6% for AGIs $50k-75k, 0.5% for AGIs $75k-100k, 0.5% for AGIs $100k-200k)
Net capital gain/loss in AGI: +$156 (reported on 13.8% of returns)
Here:
+$156
State:
+$11,232
(% of AGI for various income ranges: 0.6% for AGIs $75k-100k)
Profit/loss from business: +$4,971 (reported on 10.8% of returns)
Here:
+$4,971
State:
+$12,773
(% of AGI for various income ranges: 5.9% for AGIs $25k-50k, 0.6% for AGIs $75k-100k)
Taxable individual retirement arrangement distribution: $6,200 (reported on 10.8% of returns)
43524:
$6,200
Ohio:
$14,511
(% of AGI for various income ranges: 3.8% for AGIs below $25k, 2.2% for AGIs $25k-50k, 2.9% for AGIs $50k-75k)
Total itemized deductions: $16,781 (22% of AGI, reported on 24.6% of returns)
Here:
$16,781
State:
$21,278
Here:
21.6% of AGI
State:
18.8% of AGI
(% of AGI for various income ranges: 12.7% for AGIs $25k-50k, 7.6% for AGIs $50k-75k, 8.9% for AGIs $75k-100k, 11.0% for AGIs $100k-200k)
Charity contributions: $2,738 (reported on 20.0% of returns)
Here:
$2,738
State:
$3,943
(% of AGI for various income ranges: 1.9% for AGIs below $25k, 1.1% for AGIs $50k-75k, 1.3% for AGIs $75k-100k, 1.7% for AGIs $100k-200k)
Taxes paid: $6,294 (reported on 24.6% of returns)
43524:
$6,294
State:
$9,568
(% of AGI for various income ranges: 2.3% for AGIs $25k-50k, 2.9% for AGIs $50k-75k, 3.5% for AGIs $75k-100k, 5.6% for AGIs $100k-200k)
Earned income credit: $2,700 (reported on 12.3% of returns)
Here:
$2,700
State:
$2,285
(% of AGI for various income ranges: 5.1% for AGIs below $25k, 1.3% for AGIs $25k-50k)
Percentage of individuals using paid preparers for their 2012 taxes: 50.8%
Here:
51%
State:
51%
(% for various income ranges: 39.1% for AGIs below $25k, 53.3% for AGIs $25k-50k, 58.3% for AGIs $50k-75k, 62.5% for AGIs $75k-100k, 57.1% for AGIs $100k-200k)
Averages for the 2004 tax year for zip code 43524, filed in 2005:
Average Adjusted Gross Income (AGI) in 2004: $37,616 (Individual Income Tax Returns)
Here:
$37,616
State:
$44,480
Salary/wage: $34,362 (reported on 85.8% of returns)
Here:
$34,362
State:
$39,198
(% of AGI for various income ranges: 72.3% for AGIs below $10k, 72.8% for AGIs $10k-25k, 79.9% for AGIs $25k-50k, 78.3% for AGIs $50k-75k, 85.0% for AGIs $75k-100k, 67.1% for AGIs over 100k)
Taxable interest for individuals: $1,230 (reported on 56.7% of returns)
This zip code:
$1,230
Ohio:
$1,532
(% of AGI for various income ranges: 11.3% for AGIs below $10k, 3.1% for AGIs $10k-25k, 2.3% for AGIs $25k-50k, 1.1% for AGIs $50k-75k, 1.0% for AGIs $75k-100k, 1.1% for AGIs over 100k)
Taxable dividends: $1,204 (reported on 31.6% of returns)
Here:
$1,204
State:
$3,496
(% of AGI for various income ranges: 3.0% for AGIs below $10k, 1.5% for AGIs $10k-25k, 1.0% for AGIs $25k-50k, 1.1% for AGIs $50k-75k, 0.7% for AGIs $75k-100k, 0.5% for AGIs over 100k)
Net capital gain/loss: +$1,206 (reported on 10.2% of returns)
Here:
+$1,206
State:
+$8,582
(% of AGI for various income ranges: -0.5% for AGIs below $10k, 0.3% for AGIs $25k-50k, 0.1% for AGIs $50k-75k, 1.0% for AGIs $75k-100k)
Profit/loss from business: +$1,831 (reported on 11.5% of returns)
Here:
+$1,831
State:
+$10,813
(% of AGI for various income ranges: 2.7% for AGIs $10k-25k, 0.3% for AGIs $25k-50k, 1.1% for AGIs $50k-75k, -0.5% for AGIs $75k-100k)
Profit/loss from farming: +$4,645 (reported on 11.4% of returns)
Here:
+$4,645
State:
-$3,706
(% of AGI for various income ranges: -1.5% for AGIs $10k-25k, -0.4% for AGIs $25k-50k, 0.2% for AGIs $50k-75k, 7.8% for AGIs $75k-100k)
Total itemized deductions: $13,299 (22% of AGI, reported on 26.1% of returns)
Here:
$13,299
State:
$17,503
Here:
21.7% of AGI
State:
20.8% of AGI
(% of AGI for various income ranges: 6.9% for AGIs $10k-25k, 7.9% for AGIs $25k-50k, 9.7% for AGIs $50k-75k, 11.9% for AGIs $75k-100k, 10.9% for AGIs over 100k)
Charity contributions deductions: $2,128 (3% of AGI, reported on 21.1% of returns)
Here:
$2,128
State:
$3,087
Here:
3.3% of AGI
State:
3.4% of AGI
(% of AGI for various income ranges: 1.1% for AGIs $25k-50k, 1.5% for AGIs $50k-75k, 1.9% for AGIs $75k-100k, 1.0% for AGIs over 100k)
Total tax: $4,156 (reported on 78.6% of returns)
43524:
$4,156
State:
$6,781
(% of AGI for various income ranges: 1.9% for AGIs below $10k, 4.3% for AGIs $10k-25k, 7.0% for AGIs $25k-50k, 9.3% for AGIs $50k-75k, 10.2% for AGIs $75k-100k, 14.5% for AGIs over 100k)
Earned income credit: $1,462 (reported on 12.0% of returns)
Here:
$1,462
State:
$1,696
Percentage of individuals using paid preparers for their 2004 taxes: 70.6%
Here:
71%
State:
55%
(% for various income ranges: 65.8% for AGIs below $10k, 73.5% for AGIs $10k-25k, 71.8% for AGIs $25k-50k, 68.9% for AGIs $50k-75k, 73.0% for AGIs $75k-100k, 66.7% for AGIs over 100k)
Household received Food Stamps/SNAP in the past 12 months: 45 Household did not receive Food Stamps/SNAP in the past 12 months: 430
Women who had a birth in the past 12 months: 6 (7 now married, 0 unmarried) Women who did not have a birth in the past 12 months: 164 (72 now married, 92 unmarried)
Housing units in zip code 43524 with a mortgage: 162 (24 second mortgage, 24 both second mortgage and home equity loan) Houses without a mortgage: 36
Median monthly owner costs for units with a mortgage: $1,231 Median monthly owner costs for units without a mortgage: $424
Residents with income below the poverty level in 2022:
This zip code:
18.5%
Whole state:
13.4%
Residents with income below 50% of the poverty level in 2022:
This zip code:
7.8%
Whole state:
7.0%
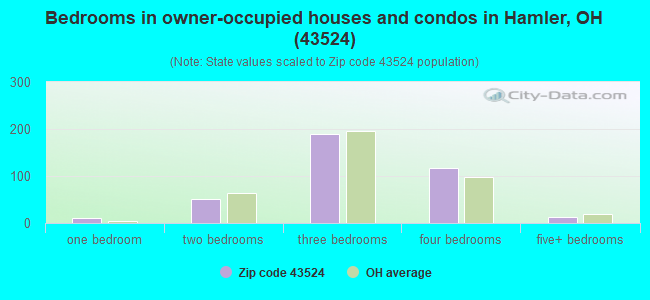
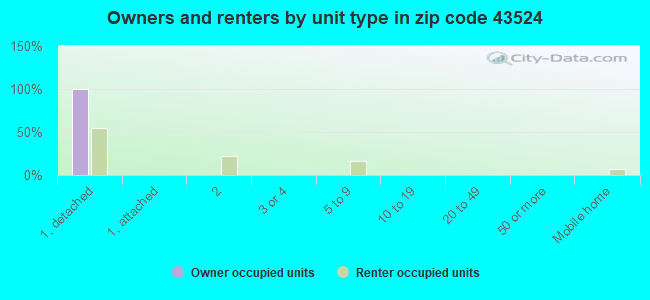
Median number of rooms in houses and condos:
Here:
7.2
State:
6.7
Median number of rooms in apartments:
Here:
5.9
State:
4.4
Notable locations in this zip code not listed on our city pages
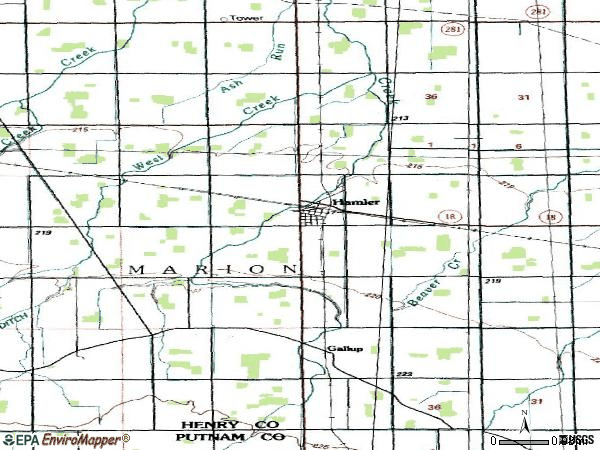
Notable locations in zip code 43524: Henry County South Joint Ambulance District Hamler Emergency Medical Services (A), Hamler Volunteer Fire Department (B). Display/hide their locations on the map
Churches in zip code 43524 include: Saint Stephen Lutheran Church (A), Hope Lutheran Church (B), Immanuel Church (C), Zion Church of God (D). Display/hide their locations on the map
Cemeteries: Saint Pauls Cemetery (1), Hope Lutheran Cemetery (2), Emanuel Lutheran Cemetery (3), Marion Township Cemetery (4). Display/hide their locations on the map
Size of family households: 189 2-persons, 42 3-persons, 85 4-persons, 4 5-persons, 8 6-persons, 1 7-or-more-persons
Size of nonfamily households: 125 1-person, 15 2-persons
92 married couples with children.
93 single-parent households (67 men, 26 women).
93.3% of residents of 43524 zip code speak English at home.
3.3% of residents speak Spanish at home (42% very well, 29% well, 29% not well).
3.8% of residents speak other Indo-European language at home (14% very well, 86% not well).
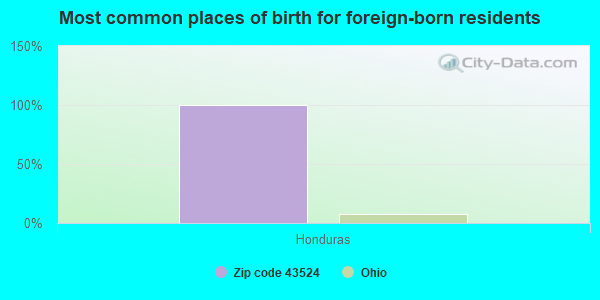
Foreign born population: 3 (0.3%) (100.0% of them are naturalized citizens)
This zip code:
0.3%
Whole state:
5.0%
100%Honduras
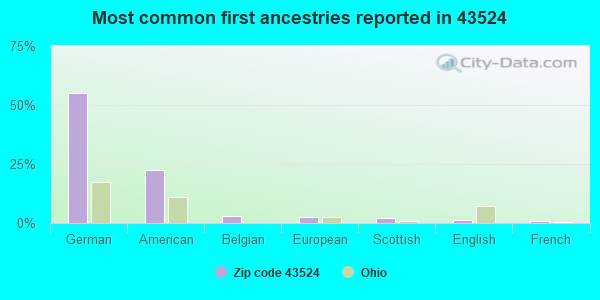
55%German
22%American
3%Belgian
2%European
2%Scottish
1%English
1%French
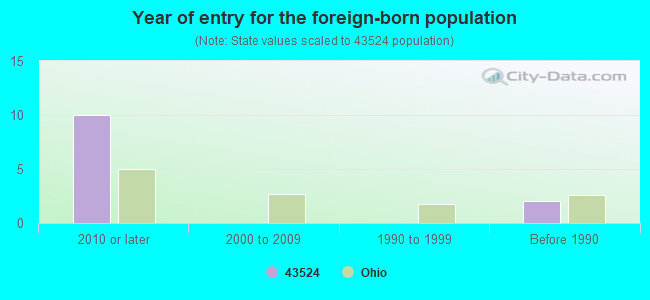
Year of entry for the foreign-born population
102010 or later
02000 to 2009
01990 to 1999
2Before 1990
Facilities with environmental interests located in this zip code:
AT&T LONG LINES HAMLER (4MI N OF HAMLER ON SR 281 in HAMLER, OH)
(Resource Conservation and Recovery Act (tracking hazardous waste))
BOWMANS BODY SHOP (6 899 ST RTE 18 in HAMLER, OH)
(Resource Conservation and Recovery Act (tracking hazardous waste)) Organizations: BOWMAN ROBERT (CONTACT/OWNER)
Housing units lacking complete plumbing facilities: 5.3% Housing units lacking complete kitchen facilities: 5.1%
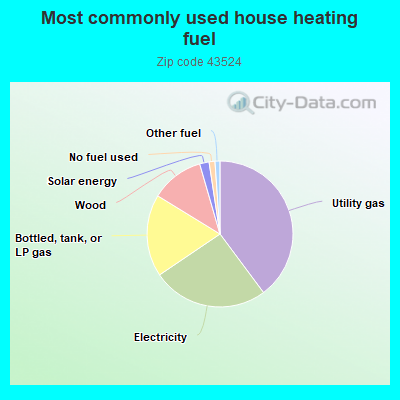
40.0%Utility gas
25.8%Electricity
18.3%Bottled, tank, or LP gas
11.8%Wood
2.1%Solar energy
1.3%No fuel used
1.1%Other fuel
Population in 1990: 1,949.
Place of birth for U.S.-born residents:
This state: 939
Northeast: 29
Midwest: 53
South: 18
West: 3
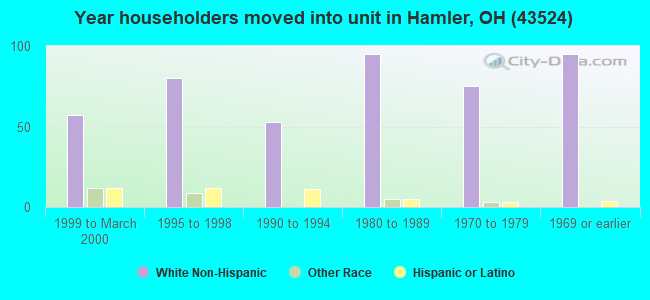
77% of the 43524 zip code residents lived in the same house 5 years ago. Out of people who lived in different houses, 71% lived in this county. Out of people who lived in different counties, 50% lived in Ohio.
93% of the 43524 zip code residents lived in the same house 1 year ago. Out of people who lived in different houses, 63% moved from this county. Out of people who lived in different houses, 25% moved from different county within same state. Out of people who lived in different houses, 10% moved from different state.
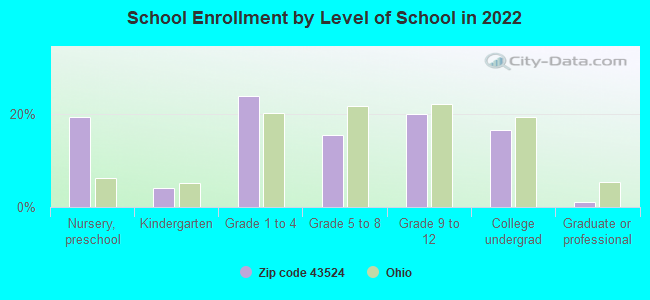
Private vs. public school enrollment:
Students in private schools in grades 1 to 8 (elementary and middle school):
Here:
0.0%
Ohio:
16.0%
Students in private schools in grades 9 to 12 (high school): 12
Here:
33.9%
Ohio:
13.1%
Students in private undergraduate colleges:
Here:
0.0%
Ohio:
22.3%
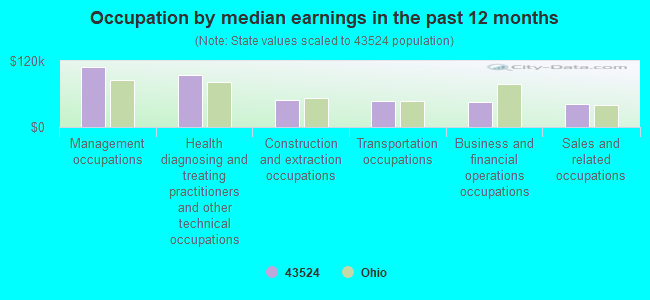
Occupation by median earnings in the past 12 months ($)
109,325Management occupations
94,335Health diagnosing and treating practitioners and other technical occupations
48,274Construction and extraction occupations
47,848Transportation occupations
44,926Business and financial operations occupations
41,861Sales and related occupations
Top industries in this zip code by the number of employees in 2005:
Finance and Insurance: Commercial Banking (10-19: 1)
Other Services (except Public Administration): Religious Organizations (5-9: 1, 1-4: 2)
Wholesale Trade: Grain and Field Bean Merchant Wholesalers (5-9: 1, 1-4: 1)
Accommodation and Food Services: Drinking Places (Alcoholic Beverages) (5-9: 1)
Finance and Insurance: Insurance Agencies and Brokerages (1-4: 2)
Construction: New Single-Family Housing Construction (except Operative Builders) (1-4: 2)
Fatal accident statistics in 2012:
Fatal accident count: 1
Vehicles involved in fatal accidents: 1
Fatal accidents caused by drunken drivers: 1
Fatalities: 1
Persons involved in fatal accidents: 2
Pedestrians involved in fatal accidents: 0
2002 - 2018 National Fire Incident Reporting System (NFIRS) incidents
Based on the data from the years 2002 - 2018 the average number of fire incidents per year is 9. The highest number of reported fire incidents - 22 took place in 2014, and the least - 2 in 2018. The data has a dropping trend.
When looking into fire subcategories, the most reports belonged to: Structure Fires (49.7%), and Outside Fires (39.7%).
Fire incident types reported to NFIRS in Zip Code 43524


+$4,645
-$3,706
(% of AGI for various income ranges: -1.5% for AGIs $10k-25k, -0.4% for AGIs $25k-50k, 0.2% for AGIs $50k-75k, 7.8% for AGIs $75k-100k) Nearest zip codes: 43535, 43523, 43527, 45856, 43516, 43548.
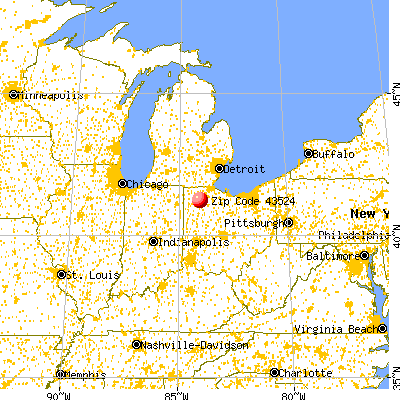
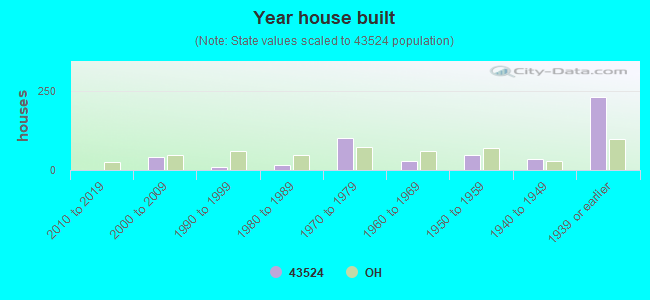


 Based on the data from the years 2002 - 2018 the average number of fire incidents per year is 9. The highest number of reported fire incidents - 22 took place in 2014, and the least - 2 in 2018. The data has a dropping trend.
 When looking into fire subcategories, the most reports belonged to: Structure Fires (49.7%), and Outside Fires (39.7%).