Estimated zip code population in 2022: 2,151 Zip code population in 2010: 2,287 Zip code population in 2000: 2,439
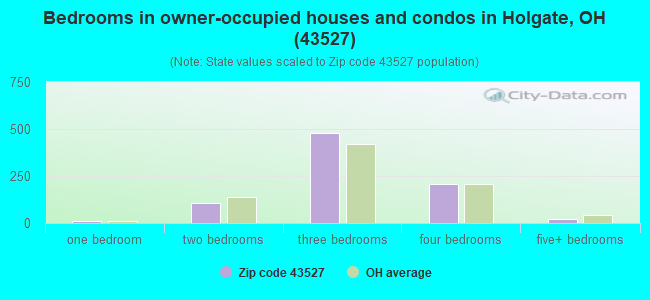
Houses and condos: 976 Renter-occupied apartments: 106
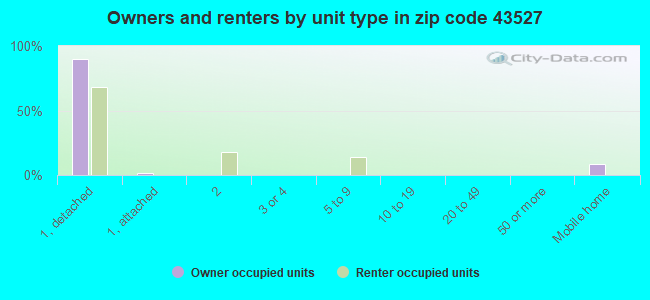
% of renters here:
11%
State:
33%
March 2022 cost of living index in zip code 43527: 82.2 (low, U.S. average is 100)
Land area: 52.6 sq. mi. Water area: 0.0 sq. mi.
Population density: 41 people per square mile
(very low).
OSM Map
General Map
Google Map
MSN Map
OSM Map
General Map
Google Map
MSN Map
OSM Map
General Map
Google Map
MSN Map
OSM Map
General Map
Google Map
MSN Map
Please wait while loading the map...
Real estate property taxes paid for housing units in 2022:
This zip code:
1.2% ($1,655)
Ohio:
1.3% ($2,639)
Median real estate property taxes paid for housing units with mortgages in 2022: $1,840 (1.3%) Median real estate property taxes paid for housing units with no mortgage in 2022: $1,406 (1.1%)
Business Search- 14 Million verified businesses
Males: 1,028
(47.8%)
Females: 1,123
(52.2%)
For population 25 years and over in 43527:
High school or higher: 93.7%
Bachelor's degree or higher: 14.6%
Graduate or professional degree: 3.0%
Unemployed: 5.1%
Mean travel time to work (commute): 24.3 minutes
For population 15 years and over in 43527:
Never married: 17.0%
Now married: 51.7%
Separated: 1.8%
Widowed: 7.8%
Divorced: 21.7%
Zip code 43527 compared to state average:
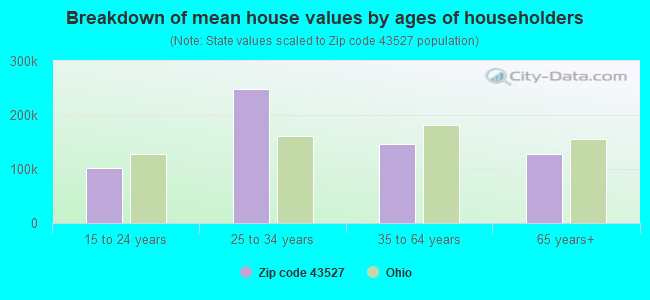
Median house value below state average.
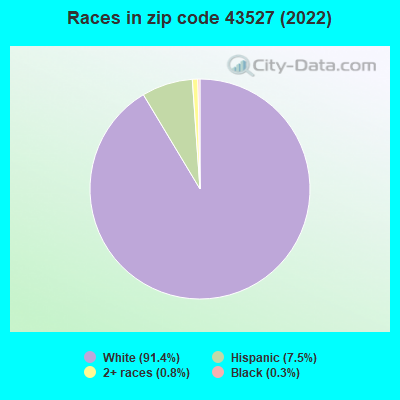
Black race population percentage significantly below state average.
Hispanic race population percentage above state average.
Median age significantly above state average.
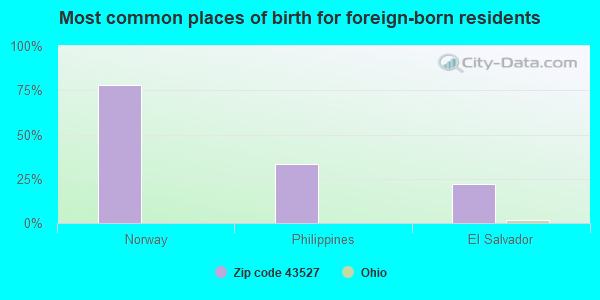
Foreign-born population percentage significantly below state average.
Renting percentage significantly below state average.
Length of stay since moving in significantly above state average.
Percentage of population with a bachelor's degree or higher below state average.
Averages for the 2020 tax year for zip code 43527, filed in 2021:
Average Adjusted Gross Income (AGI) in 2020: $56,859 (Individual Income Tax Returns)
Here:
$56,859
State:
$67,288
Salary/wage: $48,472 (reported on 80.6% of returns)
Here:
$48,472
State:
$55,628
(% of AGI for various income ranges: 1239.5% for AGIs below $25k, 3306.1% for AGIs $25k-50k, 6301.4% for AGIs $50k-75k, 9332.2% for AGIs $75k-100k, 16381.1% for AGIs $100k-200k)
Taxable interest for individuals: $1,231 (reported on 33.3% of returns)
This zip code:
$1,231
Ohio:
$1,518
(% of AGI for various income ranges: 16.2% for AGIs below $25k, 43.0% for AGIs $25k-50k, 100.0% for AGIs $50k-75k, 86.7% for AGIs $75k-100k, 102.2% for AGIs $100k-200k)
Ordinary dividends: $2,055 (reported on 20.4% of returns)
Here:
$2,055
State:
$7,167
(% of AGI for various income ranges: 15.7% for AGIs below $25k, 32.2% for AGIs $25k-50k, 40.0% for AGIs $50k-75k, 76.7% for AGIs $75k-100k, 244.4% for AGIs $100k-200k)
Net capital gain/loss in AGI: +$5,629 (reported on 15.7% of returns)
Here:
+$5,629
State:
+$18,919
(% of AGI for various income ranges: 17.6% for AGIs below $25k, 20.4% for AGIs $25k-50k, 42.9% for AGIs $50k-75k, 63.3% for AGIs $75k-100k, 840.0% for AGIs $100k-200k)
Profit/loss from business: +$7,770 (reported on 9.3% of returns)
Here:
+$7,770
State:
+$13,744
(% of AGI for various income ranges: 77.1% for AGIs below $25k, 16.5% for AGIs $25k-50k, 116.4% for AGIs $50k-75k, 460.0% for AGIs $100k-200k)
Taxable individual retirement arrangement distribution: $13,314 (reported on 13.0% of returns)
43527:
$13,314
Ohio:
$18,876
(% of AGI for various income ranges: 81.9% for AGIs below $25k, 159.1% for AGIs $25k-50k, 403.6% for AGIs $50k-75k, 845.6% for AGIs $100k-200k)
Total itemized deductions: $34,200 (reported on 1.9% of returns)
Here:
$34,200
State:
$33,869
(% of AGI for various income ranges: 325.7% for AGIs below $25k)
Earned income credit: $2,433 (reported on 11.1% of returns)
Here:
$2,433
State:
$2,304
(% of AGI for various income ranges: 82.9% for AGIs below $25k, 51.3% for AGIs $25k-50k)
Percentage of individuals using paid preparers for their 2020 taxes: 90.7%
Here:
91%
State:
94%
(% for various income ranges: 90.3% for AGIs below $25k, 89.7% for AGIs $25k-50k, 90.5% for AGIs $50k-75k, 91.7% for AGIs $75k-100k, 92.3% for AGIs $100k-200k, 100.0% for AGIs over 200k)
Averages for the 2012 tax year for zip code 43527, filed in 2013:
Average Adjusted Gross Income (AGI) in 2012: $46,747 (Individual Income Tax Returns)
Here:
$46,747
State:
$54,926
Salary/wage: $39,081 (reported on 83.3% of returns)
Here:
$39,081
State:
$45,869
(% of AGI for various income ranges: 67.9% for AGIs below $25k, 70.8% for AGIs $25k-50k, 76.5% for AGIs $50k-75k, 72.1% for AGIs $75k-100k, 60.9% for AGIs $100k-200k)
Taxable interest for individuals: $1,374 (reported on 36.1% of returns)
This zip code:
$1,374
Ohio:
$1,297
(% of AGI for various income ranges: 1.6% for AGIs below $25k, 1.1% for AGIs $25k-50k, 0.6% for AGIs $50k-75k, 1.4% for AGIs $75k-100k, 1.1% for AGIs $100k-200k)
Ordinary dividends: $1,613 (reported on 21.3% of returns)
Here:
$1,613
State:
$5,821
(% of AGI for various income ranges: 0.5% for AGIs below $25k, 0.7% for AGIs $25k-50k, 0.5% for AGIs $50k-75k, 1.3% for AGIs $75k-100k, 0.7% for AGIs $100k-200k)
Net capital gain/loss in AGI: +$508 (reported on 11.1% of returns)
Here:
+$508
State:
+$11,232
(% of AGI for various income ranges: 0.9% for AGIs $75k-100k)
Profit/loss from business: +$11,090 (reported on 9.3% of returns)
Here:
+$11,090
State:
+$12,773
(% of AGI for various income ranges: 3.5% for AGIs below $25k, 2.1% for AGIs $25k-50k, 7.2% for AGIs $75k-100k)
Taxable individual retirement arrangement distribution: $6,315 (reported on 12.0% of returns)
43527:
$6,315
Ohio:
$14,511
(% of AGI for various income ranges: 2.6% for AGIs below $25k, 2.0% for AGIs $25k-50k, 1.3% for AGIs $50k-75k, 3.2% for AGIs $75k-100k)
Total itemized deductions: $14,296 (18% of AGI, reported on 23.1% of returns)
Here:
$14,296
State:
$21,278
Here:
18.5% of AGI
State:
18.8% of AGI
(% of AGI for various income ranges: 9.1% for AGIs $25k-50k, 6.8% for AGIs $50k-75k, 6.4% for AGIs $75k-100k, 8.7% for AGIs $100k-200k)
Charity contributions: $3,083 (reported on 16.7% of returns)
Here:
$3,083
State:
$3,943
(% of AGI for various income ranges: 1.0% for AGIs $25k-50k, 1.1% for AGIs $50k-75k, 1.0% for AGIs $75k-100k, 1.7% for AGIs $100k-200k)
Taxes paid: $5,436 (reported on 23.1% of returns)
43527:
$5,436
State:
$9,568
(% of AGI for various income ranges: 2.0% for AGIs $25k-50k, 2.6% for AGIs $50k-75k, 2.6% for AGIs $75k-100k, 4.4% for AGIs $100k-200k)
Earned income credit: $1,944 (reported on 14.8% of returns)
Here:
$1,944
State:
$2,285
(% of AGI for various income ranges: 5.1% for AGIs below $25k, 0.7% for AGIs $25k-50k)
Percentage of individuals using paid preparers for their 2012 taxes: 56.5%
Here:
56%
State:
51%
(% for various income ranges: 44.7% for AGIs below $25k, 62.1% for AGIs $25k-50k, 65.0% for AGIs $50k-75k, 58.3% for AGIs $75k-100k, 66.7% for AGIs $100k-200k)
Averages for the 2004 tax year for zip code 43527, filed in 2005:
Average Adjusted Gross Income (AGI) in 2004: $36,083 (Individual Income Tax Returns)
Here:
$36,083
State:
$44,480
Salary/wage: $33,740 (reported on 87.0% of returns)
Here:
$33,740
State:
$39,198
(% of AGI for various income ranges: 96.2% for AGIs below $10k, 67.8% for AGIs $10k-25k, 83.1% for AGIs $25k-50k, 83.6% for AGIs $50k-75k, 83.4% for AGIs $75k-100k, 80.6% for AGIs over 100k)
Taxable interest for individuals: $1,357 (reported on 48.5% of returns)
This zip code:
$1,357
Ohio:
$1,532
(% of AGI for various income ranges: 5.0% for AGIs below $10k, 3.9% for AGIs $10k-25k, 1.5% for AGIs $25k-50k, 1.5% for AGIs $50k-75k, 1.6% for AGIs $75k-100k, 0.7% for AGIs over 100k)
Taxable dividends: $975 (reported on 23.2% of returns)
Here:
$975
State:
$3,496
(% of AGI for various income ranges: 0.5% for AGIs below $10k, 1.2% for AGIs $10k-25k, 0.5% for AGIs $25k-50k, 0.8% for AGIs $50k-75k, 0.5% for AGIs $75k-100k, 0.1% for AGIs over 100k)
Net capital gain/loss: +$1,207 (reported on 12.3% of returns)
Here:
+$1,207
State:
+$8,582
(% of AGI for various income ranges: -0.7% for AGIs below $10k, 0.1% for AGIs $10k-25k, 0.3% for AGIs $25k-50k, 0.4% for AGIs $50k-75k, 1.1% for AGIs $75k-100k)
Profit/loss from business: +$87 (reported on 7.5% of returns)
Here:
+$87
State:
+$10,813
(% of AGI for various income ranges: 4.8% for AGIs below $10k, 0.0% for AGIs $10k-25k, -1.2% for AGIs $25k-50k, 0.5% for AGIs $50k-75k, 0.7% for AGIs $75k-100k)
Profit/loss from farming: +$3,778 (reported on 5.9% of returns)
Here:
+$3,778
State:
-$3,706
(% of AGI for various income ranges: -0.8% for AGIs $10k-25k, -0.8% for AGIs $25k-50k, -0.7% for AGIs $50k-75k, 5.9% for AGIs $75k-100k)
IRA payment deduction: $2,053 (reported on 1.6% of returns)
43527:
$2,053
Ohio:
$2,794
Total itemized deductions: $12,333 (21% of AGI, reported on 22.6% of returns)
Here:
$12,333
State:
$17,503
Here:
20.7% of AGI
State:
20.8% of AGI
(% of AGI for various income ranges: 7.0% for AGIs $10k-25k, 7.0% for AGIs $25k-50k, 7.5% for AGIs $50k-75k, 8.5% for AGIs $75k-100k, 12.5% for AGIs over 100k)
Charity contributions deductions: $1,991 (3% of AGI, reported on 17.5% of returns)
Here:
$1,991
State:
$3,087
Here:
3.2% of AGI
State:
3.4% of AGI
(% of AGI for various income ranges: 0.6% for AGIs $10k-25k, 0.7% for AGIs $25k-50k, 1.1% for AGIs $50k-75k, 1.1% for AGIs $75k-100k, 1.8% for AGIs over 100k)
Total tax: $4,083 (reported on 77.5% of returns)
43527:
$4,083
State:
$6,781
(% of AGI for various income ranges: 2.1% for AGIs below $10k, 4.1% for AGIs $10k-25k, 7.4% for AGIs $25k-50k, 8.9% for AGIs $50k-75k, 11.9% for AGIs $75k-100k, 15.1% for AGIs over 100k)
Earned income credit: $1,662 (reported on 10.7% of returns)
Here:
$1,662
State:
$1,696
Percentage of individuals using paid preparers for their 2004 taxes: 60.3%
Here:
60%
State:
55%
(% for various income ranges: 46.1% for AGIs below $10k, 64.4% for AGIs $10k-25k, 64.1% for AGIs $25k-50k, 61.5% for AGIs $50k-75k, 59.6% for AGIs $75k-100k, 62.1% for AGIs over 100k)
Household received Food Stamps/SNAP in the past 12 months: 45 Household did not receive Food Stamps/SNAP in the past 12 months: 876
Women who had a birth in the past 12 months: 19 (3 now married, 16 unmarried) Women who did not have a birth in the past 12 months: 425 (201 now married, 224 unmarried)
Housing units in zip code 43527 with a mortgage: 438 (46 second mortgage, 47 both second mortgage and home equity loan) Houses without a mortgage: 48
Median monthly owner costs for units with a mortgage: $995 Median monthly owner costs for units without a mortgage: $395
Residents with income below the poverty level in 2022:
This zip code:
6.9%
Whole state:
13.4%
Residents with income below 50% of the poverty level in 2022:
This zip code:
6.3%
Whole state:
7.0%
Median number of rooms in houses and condos:
Here:
7.0
State:
6.7
Median number of rooms in apartments:
Here:
4.7
State:
4.4
Notable locations in this zip code not listed on our city pages
Notable locations in zip code 43527: Henry County South Joint Ambulance District Holgate Emergency Medical Services (A), Holgate Volunteer Fire Department (B). Display/hide their locations on the map
Cemeteries: Saint Peters Cemetery (1), Saint Marys Cemetery (2), Saint Johns Cemetery (3), Pleasant Township Cemetery (4), Township Cemetery (5), Saint Johns Cemetery (6). Display/hide their locations on the map
In group quarters: 56 (-1 institutionalized population)
Size of family households: 270 2-persons, 93 3-persons, 143 4-persons, 45 5-persons, 7 6-persons, 7 7-or-more-persons
Size of nonfamily households: 301 1-person, 52 2-persons
258 married couples with children.
98 single-parent households (30 men, 68 women).
97.4% of residents of 43527 zip code speak English at home.
2.6% of residents speak Spanish at home (74% very well, 26% well).
0.2% of residents speak other Indo-European language at home (100% very well).
Foreign born population: 9 (0.4%) (56.0% of them are naturalized citizens)
This zip code:
0.4%
Whole state:
5.0%
78%Norway
33%Philippines
22%El Salvador
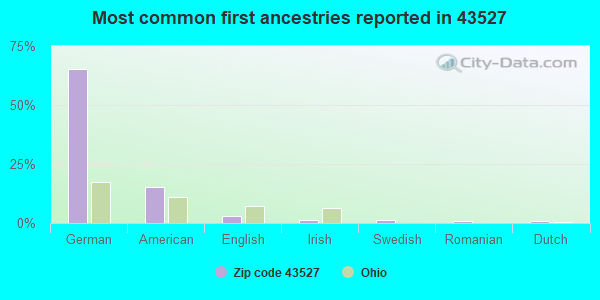
65%German
15%American
3%English
1%Irish
1%Swedish
1%Romanian
1%Dutch
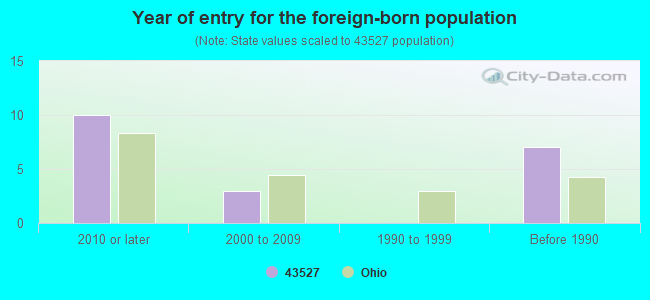
Year of entry for the foreign-born population
102010 or later
32000 to 2009
01990 to 1999
7Before 1990
Housing units lacking complete plumbing facilities: 0.6% Housing units lacking complete kitchen facilities: 2.7%
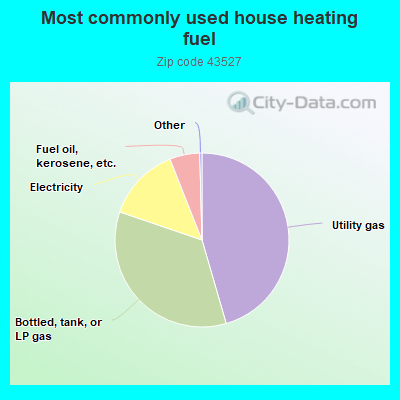
45.6%Utility gas
34.8%Bottled, tank, or LP gas
13.8%Electricity
5.6%Fuel oil, kerosene, etc.
Population in 1990: 2,032. Population change in the 1990s: +407 (+20.0%).
Place of birth for U.S.-born residents:
This state: 1,698
Northeast: 53
Midwest: 240
South: 105
West: 28
70% of the 43527 zip code residents lived in the same house 5 years ago. Out of people who lived in different houses, 65% lived in this county. Out of people who lived in different counties, 50% lived in Ohio.
90% of the 43527 zip code residents lived in the same house 1 year ago. Out of people who lived in different houses, 19% moved from this county. Out of people who lived in different houses, 29% moved from different county within same state. Out of people who lived in different houses, 56% moved from different state.
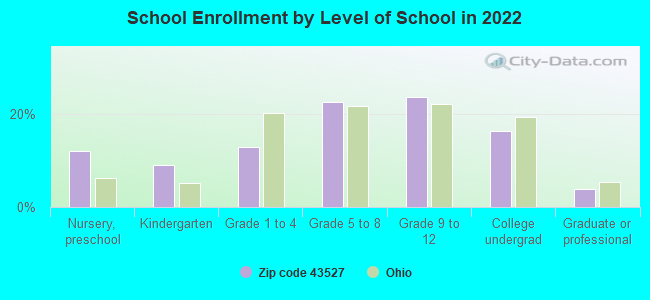
Private vs. public school enrollment:
Students in private schools in grades 1 to 8 (elementary and middle school):
Here:
0.0%
Ohio:
16.0%
Students in private schools in grades 9 to 12 (high school):
Here:
0.0%
Ohio:
13.1%
Students in private undergraduate colleges: 10
Here:
18.1%
Ohio:
22.3%
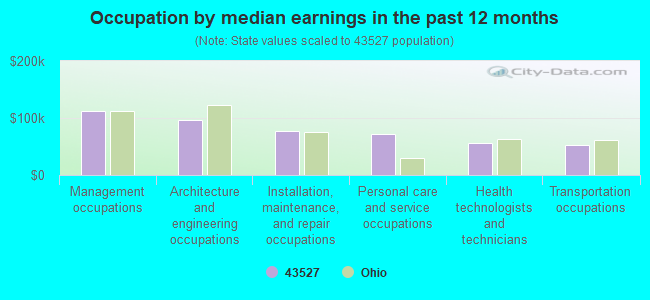
Occupation by median earnings in the past 12 months ($)
112,287Management occupations
96,237Architecture and engineering occupations
76,952Installation, maintenance, and repair occupations
71,324Personal care and service occupations
56,152Health technologists and technicians
52,989Transportation occupations
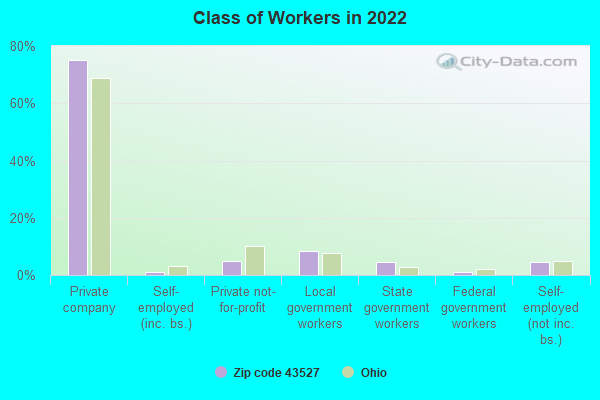
Top industries in this zip code by the number of employees in 2005:
Health Care and Social Assistance: Nursing Care Facilities (50-99 employees: 1 establishment)
Other Services (except Public Administration): Religious Organizations (10-19: 2, 5-9: 3)
Construction: New Single-Family Housing Construction (except Operative Builders) (20-49: 1, 1-4: 1)
Real Estate and Rental and Leasing: Other Commercial and Industrial Machinery and Equipment Rental and Leasing (10-19: 1)
Accommodation and Food Services: Full-Service Restaurants (5-9: 2)
People in group quarters in 2010:
43 people in nursing facilities/skilled-nursing facilities
People in group quarters in 2000:
38 people in nursing homes
2003 - 2018 National Fire Incident Reporting System (NFIRS) incidents
Based on the data from the years 2003 - 2018 the average number of fire incidents per year is 10. The highest number of reported fires - 23 took place in 2014, and the least - 4 in 2003. The data has a growing trend.
When looking into fire subcategories, the most reports belonged to: Structure Fires (44.2%), and Outside Fires (36.2%).
Fire incident types reported to NFIRS in Zip Code 43527


+$3,778
-$3,706
(% of AGI for various income ranges: -0.8% for AGIs $10k-25k, -0.8% for AGIs $25k-50k, -0.7% for AGIs $50k-75k, 5.9% for AGIs $75k-100k) Nearest zip codes: 43548, 43524, 43545, 43535, 45864, 45831.


 Based on the data from the years 2003 - 2018 the average number of fire incidents per year is 10. The highest number of reported fires - 23 took place in 2014, and the least - 4 in 2003. The data has a growing trend.
 When looking into fire subcategories, the most reports belonged to: Structure Fires (44.2%), and Outside Fires (36.2%).