Estimated zip code population in 2022: 2,767 Zip code population in 2010: 3,248 Zip code population in 2000: 3,108
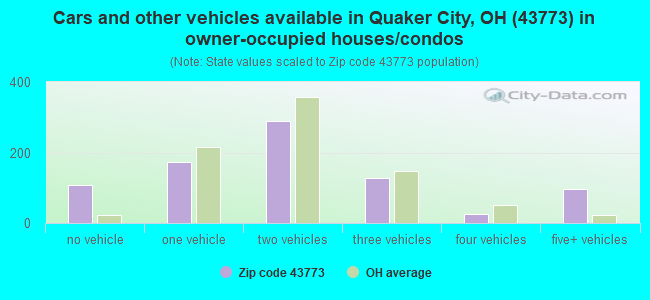
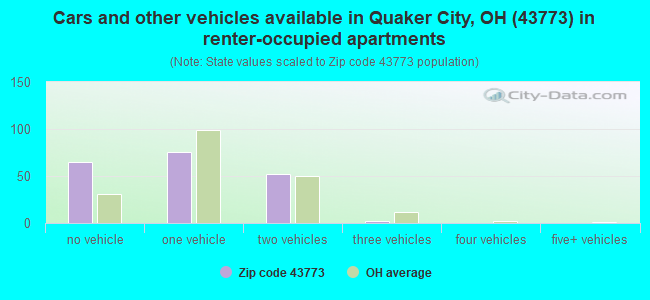
Houses and condos: 1,312 Renter-occupied apartments: 195
% of renters here:
19%
State:
33%
March 2022 cost of living index in zip code 43773: 83.7 (less than average, U.S. average is 100)
Land area: 105.7 sq. mi. Water area: 2.3 sq. mi.
Population density: 26 people per square mile
(very low).
OSM Map
General Map
Google Map
MSN Map
OSM Map
General Map
Google Map
MSN Map
OSM Map
General Map
Google Map
MSN Map
OSM Map
General Map
Google Map
MSN Map
Please wait while loading the map...
Real estate property taxes paid for housing units in 2022:
This zip code:
1.1% ($1,320)
Ohio:
1.3% ($2,639)
Median real estate property taxes paid for housing units with mortgages in 2022: $2,083 (1.1%) Median real estate property taxes paid for housing units with no mortgage in 2022: $1,076 (1.1%)
Estimated median house/condo value in 2022: $123,262
43773:
$123,262
Ohio:
$204,100
According to our research of Ohio and other state lists, there were 7 registered sex offenders living in 43773 zip code as of May 30, 2024. The ratio of all residents to sex offenders in zip code 43773 is 494 to 1. The ratio of registered sex offenders to all residents in this zip code is near the state average.
Median resident age:
This zip code:
41.3 years
Ohio median age:
39.9 years
Average household size:
This zip code:
2.7 people
Ohio:
2.4 people
Averages for the 2020 tax year for zip code 43773, filed in 2021:
Average Adjusted Gross Income (AGI) in 2020: $55,098 (Individual Income Tax Returns)
Here:
$55,098
State:
$67,288
Salary/wage: $42,056 (reported on 68.5% of returns)
Here:
$42,056
State:
$55,628
(% of AGI for various income ranges: 1273.6% for AGIs below $25k, 3561.9% for AGIs $25k-50k, 6431.4% for AGIs $50k-75k, 9658.6% for AGIs $75k-100k, 13273.8% for AGIs $100k-200k)
Taxable interest for individuals: $774 (reported on 26.9% of returns)
This zip code:
$774
Ohio:
$1,518
(% of AGI for various income ranges: 11.4% for AGIs below $25k, 12.4% for AGIs $25k-50k, 41.4% for AGIs $50k-75k, 14.3% for AGIs $75k-100k, 77.5% for AGIs $100k-200k)
Ordinary dividends: $3,931 (reported on 12.3% of returns)
Here:
$3,931
State:
$7,167
(% of AGI for various income ranges: 17.9% for AGIs below $25k, 19.5% for AGIs $25k-50k, 90.0% for AGIs $50k-75k, 515.0% for AGIs $100k-200k)
Net capital gain/loss in AGI: +$7,225 (reported on 12.3% of returns)
Here:
+$7,225
State:
+$18,919
(% of AGI for various income ranges: 20.5% for AGIs $25k-50k, 52.9% for AGIs $50k-75k, 497.1% for AGIs $75k-100k, 863.7% for AGIs $100k-200k)
Profit/loss from business: +$20,576 (reported on 19.2% of returns)
Here:
+$20,576
State:
+$13,744
(% of AGI for various income ranges: 80.7% for AGIs below $25k, 886.2% for AGIs $25k-50k, 1217.9% for AGIs $50k-75k, 1690.0% for AGIs $100k-200k)
Taxable individual retirement arrangement distribution: $11,000 (reported on 9.2% of returns)
43773:
$11,000
Ohio:
$18,876
(% of AGI for various income ranges: 53.2% for AGIs below $25k, 102.9% for AGIs $25k-50k, 285.0% for AGIs $50k-75k, 695.0% for AGIs $100k-200k)
Total itemized deductions: $33,933 (reported on 2.3% of returns)
Here:
$33,933
State:
$33,869
(% of AGI for various income ranges: 1454.3% for AGIs $75k-100k)
Taxes paid: $4,833 (reported on 2.3% of returns)
43773:
$4,833
State:
$7,681
(% of AGI for various income ranges: 207.1% for AGIs $75k-100k)
Earned income credit: $2,294 (reported on 12.3% of returns)
Here:
$2,294
State:
$2,304
(% of AGI for various income ranges: 83.2% for AGIs below $25k, 63.8% for AGIs $25k-50k)
Percentage of individuals using paid preparers for their 2020 taxes: 95.4%
Here:
95%
State:
94%
(% for various income ranges: 95.5% for AGIs below $25k, 97.1% for AGIs $25k-50k, 95.5% for AGIs $50k-75k, 92.3% for AGIs $75k-100k, 92.9% for AGIs $100k-200k, 100.0% for AGIs over 200k)
Averages for the 2012 tax year for zip code 43773, filed in 2013:
Average Adjusted Gross Income (AGI) in 2012: $62,834 (Individual Income Tax Returns)
Here:
$62,834
State:
$54,926
Salary/wage: $36,899 (reported on 73.6% of returns)
Here:
$36,899
State:
$45,869
(% of AGI for various income ranges: 62.1% for AGIs below $25k, 65.9% for AGIs $25k-50k, 70.2% for AGIs $50k-75k, 70.3% for AGIs $75k-100k, 39.5% for AGIs $100k-200k, 12.1% for AGIs over 200k)
Taxable interest for individuals: $583 (reported on 28.8% of returns)
This zip code:
$583
Ohio:
$1,297
(% of AGI for various income ranges: 0.7% for AGIs below $25k, 0.5% for AGIs $25k-50k, 0.2% for AGIs $50k-75k, 0.3% for AGIs $75k-100k, 0.2% for AGIs $100k-200k, 0.1% for AGIs over 200k)
Ordinary dividends: $2,442 (reported on 9.6% of returns)
Here:
$2,442
State:
$5,821
(% of AGI for various income ranges: 0.3% for AGIs below $25k, 1.0% for AGIs $25k-50k, 0.2% for AGIs $75k-100k, 0.5% for AGIs over 200k)
Net capital gain/loss in AGI: +$9,970 (reported on 8.0% of returns)
Here:
+$9,970
State:
+$11,232
(% of AGI for various income ranges: 0.8% for AGIs $25k-50k, 0.4% for AGIs $75k-100k, 3.1% for AGIs over 200k)
Profit/loss from business: +$16,254 (reported on 20.8% of returns)
Here:
+$16,254
State:
+$12,773
(% of AGI for various income ranges: 14.5% for AGIs below $25k, 12.8% for AGIs $25k-50k, 5.6% for AGIs $50k-75k, 2.8% for AGIs $75k-100k, 7.7% for AGIs $100k-200k)
Taxable individual retirement arrangement distribution: $6,840 (reported on 8.0% of returns)
43773:
$6,840
Ohio:
$14,511
(% of AGI for various income ranges: 3.9% for AGIs below $25k, 2.5% for AGIs $50k-75k, 1.5% for AGIs $100k-200k)
Total itemized deductions: $21,989 (13% of AGI, reported on 15.2% of returns)
Here:
$21,989
State:
$21,278
Here:
13.3% of AGI
State:
18.8% of AGI
(% of AGI for various income ranges: 4.6% for AGIs $25k-50k, 5.8% for AGIs $50k-75k, 5.8% for AGIs $75k-100k, 6.3% for AGIs $100k-200k, 5.9% for AGIs over 200k)
Charity contributions: $5,292 (reported on 9.6% of returns)
Here:
$5,292
State:
$3,943
(% of AGI for various income ranges: 0.6% for AGIs below $25k, 1.3% for AGIs $50k-75k, 0.8% for AGIs $100k-200k, 1.3% for AGIs over 200k)
Taxes paid: $9,395 (reported on 15.2% of returns)
43773:
$9,395
State:
$9,568
(% of AGI for various income ranges: 1.1% for AGIs $25k-50k, 1.4% for AGIs $50k-75k, 1.6% for AGIs $75k-100k, 2.2% for AGIs $100k-200k, 3.9% for AGIs over 200k)
Earned income credit: $2,120 (reported on 16.0% of returns)
Here:
$2,120
State:
$2,285
(% of AGI for various income ranges: 5.0% for AGIs below $25k, 1.1% for AGIs $25k-50k)
Percentage of individuals using paid preparers for their 2012 taxes: 63.2%
Here:
63%
State:
51%
(% for various income ranges: 52.1% for AGIs below $25k, 68.8% for AGIs $25k-50k, 62.5% for AGIs $50k-75k, 66.7% for AGIs $75k-100k, 80.0% for AGIs $100k-200k, 85.7% for AGIs over 200k)
Averages for the 2004 tax year for zip code 43773, filed in 2005:
Average Adjusted Gross Income (AGI) in 2004: $29,533 (Individual Income Tax Returns)
Here:
$29,533
State:
$44,480
Salary/wage: $29,098 (reported on 76.6% of returns)
Here:
$29,098
State:
$39,198
(% of AGI for various income ranges: 102.7% for AGIs below $10k, 63.0% for AGIs $10k-25k, 75.7% for AGIs $25k-50k, 81.6% for AGIs $50k-75k, 71.4% for AGIs $75k-100k, 77.9% for AGIs over 100k)
Taxable interest for individuals: $888 (reported on 36.4% of returns)
This zip code:
$888
Ohio:
$1,532
(% of AGI for various income ranges: 7.6% for AGIs below $10k, 2.3% for AGIs $10k-25k, 0.6% for AGIs $25k-50k, 0.6% for AGIs $50k-75k, 0.6% for AGIs $75k-100k, 0.5% for AGIs over 100k)
Taxable dividends: $1,430 (reported on 12.8% of returns)
Here:
$1,430
State:
$3,496
(% of AGI for various income ranges: 2.3% for AGIs below $10k, 1.1% for AGIs $10k-25k, 0.5% for AGIs $25k-50k, 0.3% for AGIs $50k-75k, 1.1% for AGIs $75k-100k)
Net capital gain/loss: +$1,938 (reported on 11.0% of returns)
Here:
+$1,938
State:
+$8,582
(% of AGI for various income ranges: -0.5% for AGIs below $10k, 1.0% for AGIs $10k-25k, 1.0% for AGIs $25k-50k, 0.3% for AGIs $50k-75k, 1.4% for AGIs $75k-100k)
Profit/loss from business: +$11,252 (reported on 19.9% of returns)
Here:
+$11,252
State:
+$10,813
(% of AGI for various income ranges: -4.5% for AGIs below $10k, 17.0% for AGIs $10k-25k, 7.4% for AGIs $25k-50k, 6.9% for AGIs $50k-75k)
IRA payment deduction: $2,833 (reported on 1.5% of returns)
43773:
$2,833
Ohio:
$2,794
Total itemized deductions: $14,753 (26% of AGI, reported on 12.7% of returns)
Here:
$14,753
State:
$17,503
Here:
26.1% of AGI
State:
20.8% of AGI
(% of AGI for various income ranges: 3.6% for AGIs $10k-25k, 6.4% for AGIs $25k-50k, 5.9% for AGIs $50k-75k, 11.8% for AGIs $75k-100k, 11.8% for AGIs over 100k)
Charity contributions deductions: $2,698 (4% of AGI, reported on 8.2% of returns)
Here:
$2,698
State:
$3,087
Here:
4.4% of AGI
State:
3.4% of AGI
(% of AGI for various income ranges: 0.3% for AGIs $10k-25k, 0.5% for AGIs $25k-50k, 0.9% for AGIs $50k-75k, 2.8% for AGIs $75k-100k)
Total tax: $2,834 (reported on 68.1% of returns)
43773:
$2,834
State:
$6,781
(% of AGI for various income ranges: 3.2% for AGIs below $10k, 3.7% for AGIs $10k-25k, 5.0% for AGIs $25k-50k, 8.0% for AGIs $50k-75k, 9.7% for AGIs $75k-100k, 14.3% for AGIs over 100k)
Earned income credit: $1,785 (reported on 16.6% of returns)
Here:
$1,785
State:
$1,696
Percentage of individuals using paid preparers for their 2004 taxes: 64.7%
Here:
65%
State:
55%
(% for various income ranges: 56.7% for AGIs below $10k, 66.8% for AGIs $10k-25k, 66.5% for AGIs $25k-50k, 65.6% for AGIs $50k-75k, 70.3% for AGIs $75k-100k, 76.5% for AGIs over 100k)
Household received Food Stamps/SNAP in the past 12 months: 70 Household did not receive Food Stamps/SNAP in the past 12 months: 944
Women who had a birth in the past 12 months: 4 (5 now married, 0 unmarried) Women who did not have a birth in the past 12 months: 678 (267 now married, 411 unmarried)
Housing units in zip code 43773 with a mortgage: 312 (16 second mortgage, 15 both second mortgage and home equity loan) Houses without a mortgage: 99
Median monthly owner costs for units with a mortgage: $1,257 Median monthly owner costs for units without a mortgage: $378
Residents with income below the poverty level in 2022:
This zip code:
23.2%
Whole state:
13.4%
Residents with income below 50% of the poverty level in 2022:
This zip code:
12.5%
Whole state:
7.0%
Median number of rooms in houses and condos:
Here:
6.2
State:
6.7
Median number of rooms in apartments:
Here:
5.3
State:
4.4
Notable locations in this zip code not listed on our city pages
Churches in zip code 43773 include: Beaver Baptist Church (A), Richland Meetinghouse (B), Mount Zion Church (C), Pisgah Church of Christ (D), Saint Johns Church (E), Salt Fork Baptist Church (F), Wesley Chapel (G), Palestine Church of Christ (H). Display/hide their locations on the map
Cemeteries: Barker Cemetery (1), Fletcher Cemetery (2), Eldon Cemetery (3), Fairview Cemetery (4), Bethesda Cemetery (5), Greenlawn Cemetery (6), House Cemetery (7). Display/hide their locations on the map
Size of family households: 413 2-persons, 111 3-persons, 126 4-persons, 28 5-persons, 22 7-or-more-persons
Size of nonfamily households: 294 1-person, 16 2-persons
541 married couples with children.
70 single-parent households (70 women).
81.9% of residents of 43773 zip code speak English at home.
0.8% of residents speak Spanish at home (100% very well).
18.9% of residents speak other Indo-European language at home (59% very well, 39% well, 2% not well, 1% not at all).
Foreign born population: 21 (0.8%) (0.0% of them are naturalized citizens)
:
0.8%
Whole state:
5.0%
110%Honduras
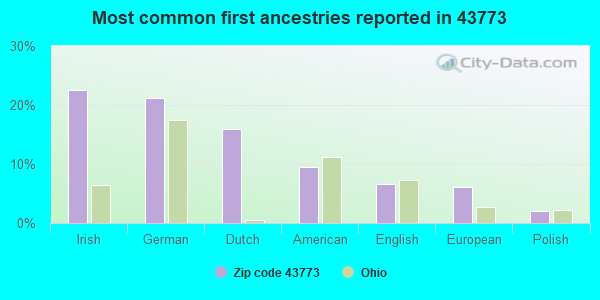
23%Irish
21%German
16%Dutch
10%American
7%English
6%European
2%Polish
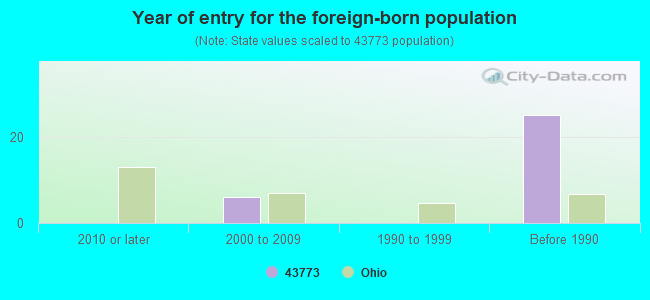
Year of entry for the foreign-born population
02010 or later
62000 to 2009
01990 to 1999
25Before 1990
Housing units lacking complete plumbing facilities: 13.6% Housing units lacking complete kitchen facilities: 15.3%
25.5%Utility gas
23.5%Wood
23.3%Electricity
13.9%Bottled, tank, or LP gas
7.8%Fuel oil, kerosene, etc.
3.2%Coal or coke
3.0%Other fuel
Population in 1990: 2,139. Population change in the 1990s: +969 (+45.3%).
Place of birth for U.S.-born residents:
This state: 2,303
Northeast: 82
Midwest: 89
South: 245
West: 5
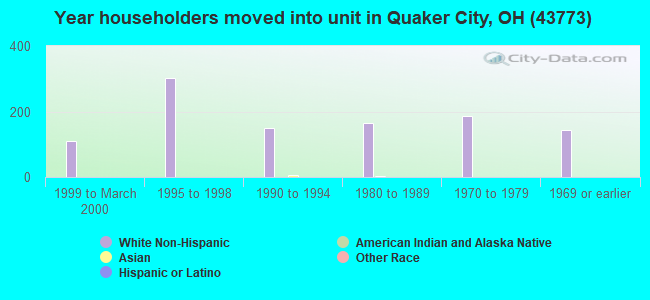
65% of the 43773 zip code residents lived in the same house 5 years ago. Out of people who lived in different houses, 37% lived in this county. Out of people who lived in different counties, 50% lived in Ohio.
95% of the 43773 zip code residents lived in the same house 1 year ago. Out of people who lived in different houses, 28% moved from this county. Out of people who lived in different houses, 38% moved from different county within same state. Out of people who lived in different houses, 44% moved from different state.
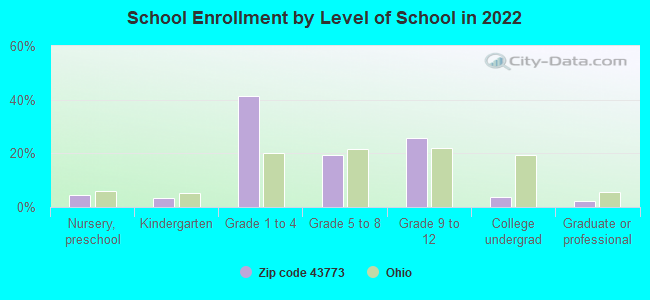
Private vs. public school enrollment:
Students in private schools in grades 1 to 8 (elementary and middle school): 55
Here:
21.0%
Ohio:
16.0%
Students in private schools in grades 9 to 12 (high school):
Here:
0.0%
Ohio:
13.1%
Students in private undergraduate colleges:
Here:
0.0%
Ohio:
22.3%
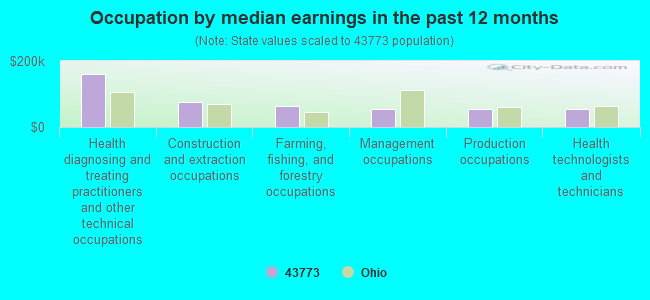
Occupation by median earnings in the past 12 months ($)
161,342Health diagnosing and treating practitioners and other technical occupations
74,455Construction and extraction occupations
62,869Farming, fishing, and forestry occupations
55,091Management occupations
54,486Production occupations
54,009Health technologists and technicians
Top industries in this zip code by the number of employees in 2005:
Other Services (except Public Administration): Religious Organizations (1-4 employees: 4 establishments)
Construction: New Single-Family Housing Construction (except Operative Builders) (1-4: 2)
Other Services (except Public Administration): Labor Unions and Similar Labor Organizations (1-4: 1)
Fatal accident statistics in 2011:
Fatal accident count: 1
Vehicles involved in fatal accidents: 1
Fatal accidents caused by drunken drivers: 0
Fatalities: 1
Persons involved in fatal accidents: 1
Pedestrians involved in fatal accidents: 0
Fatal accident statistics in 2010:
Fatal accident count: 1
Vehicles involved in fatal accidents: 1
Fatal accidents caused by drunken drivers: 1
Fatalities: 2
Persons involved in fatal accidents: 3
Pedestrians involved in fatal accidents: 0
2002 - 2018 National Fire Incident Reporting System (NFIRS) incidents
According to the data from the years 2002 - 2018 the average number of fire incidents per year is 31. The highest number of reported fires - 48 took place in 2008, and the least - 15 in 2017. The data has a decreasing trend.
When looking into fire subcategories, the most reports belonged to: Structure Fires (40.8%), and Outside Fires (34.5%).
Fire incident types reported to NFIRS in Zip Code 43773

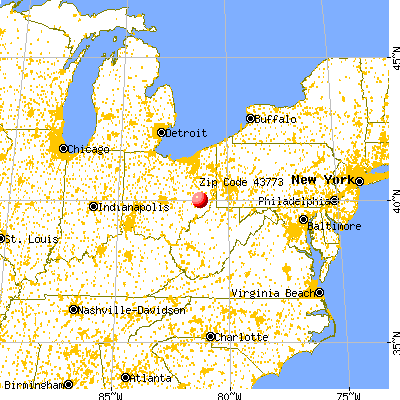


 Nearest zip codes: 43778, 43736, 43713, 43755, 43768, 43780.


 According to the data from the years 2002 - 2018 the average number of fire incidents per year is 31. The highest number of reported fires - 48 took place in 2008, and the least - 15 in 2017. The data has a decreasing trend.
 When looking into fire subcategories, the most reports belonged to: Structure Fires (40.8%), and Outside Fires (34.5%).