Estimated zip code population in 2022: 6,665 Zip code population in 2010: 6,158 Zip code population in 2000: 5,485
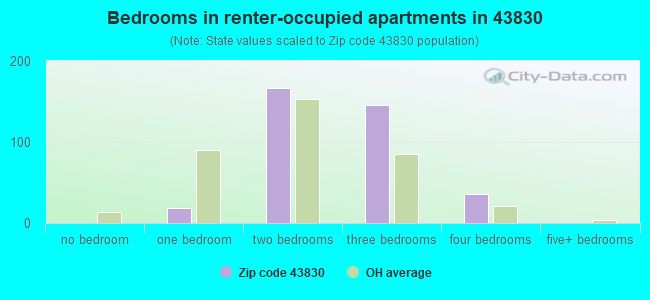
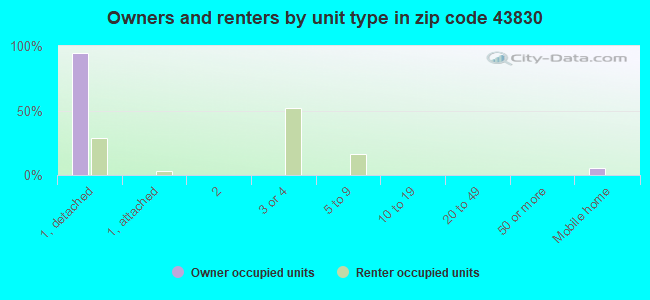
Houses and condos: 2,303 Renter-occupied apartments: 369
% of renters here:
16%
State:
33%
March 2022 cost of living index in zip code 43830: 83.4 (less than average, U.S. average is 100)
Land area: 50.9 sq. mi. Water area: 1.2 sq. mi.
Population density: 131 people per square mile
(very low).
OSM Map
General Map
Google Map
MSN Map
OSM Map
General Map
Google Map
MSN Map
OSM Map
General Map
Google Map
MSN Map
OSM Map
General Map
Google Map
MSN Map
Please wait while loading the map...
Real estate property taxes paid for housing units in 2022:
This zip code:
0.9% ($2,035)
Ohio:
1.3% ($2,639)
Median real estate property taxes paid for housing units with mortgages in 2022: $2,036 (0.9%) Median real estate property taxes paid for housing units with no mortgage in 2022: $2,045 (1.1%)
Estimated median house/condo value in 2022: $221,693
43830:
$221,693
Ohio:
$204,100
According to our research of Ohio and other state lists, there were 7 registered sex offenders living in 43830 zip code as of April 26, 2024. The ratio of all residents to sex offenders in zip code 43830 is 913 to 1. The ratio of registered sex offenders to all residents in this zip code is lower than the state average.
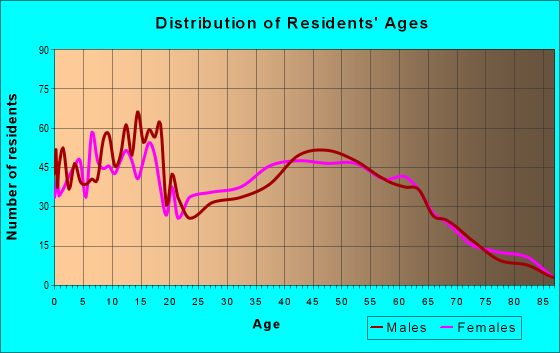
Median resident age:
This zip code:
37.6 years
Ohio median age:
39.9 years
Average household size:
This zip code:
3.0 people
Ohio:
2.4 people
Averages for the 2020 tax year for zip code 43830, filed in 2021:
Average Adjusted Gross Income (AGI) in 2020: $66,562 (Individual Income Tax Returns)
Here:
$66,562
State:
$67,288
Salary/wage: $57,387 (reported on 83.9% of returns)
Here:
$57,387
State:
$55,628
(% of AGI for various income ranges: 1116.9% for AGIs below $25k, 3425.9% for AGIs $25k-50k, 6098.3% for AGIs $50k-75k, 8947.7% for AGIs $75k-100k, 15901.4% for AGIs $100k-200k, 56253.3% for AGIs over 200k)
Taxable interest for individuals: $951 (reported on 24.8% of returns)
This zip code:
$951
Ohio:
$1,518
(% of AGI for various income ranges: 8.1% for AGIs below $25k, 18.9% for AGIs $25k-50k, 18.8% for AGIs $50k-75k, 25.8% for AGIs $75k-100k, 45.0% for AGIs $100k-200k, 910.0% for AGIs over 200k)
Ordinary dividends: $3,276 (reported on 15.8% of returns)
Here:
$3,276
State:
$7,167
(% of AGI for various income ranges: 16.2% for AGIs below $25k, 29.2% for AGIs $25k-50k, 42.4% for AGIs $50k-75k, 65.5% for AGIs $75k-100k, 144.7% for AGIs $100k-200k, 1623.3% for AGIs over 200k)
Net capital gain/loss in AGI: +$9,637 (reported on 14.2% of returns)
Here:
+$9,637
State:
+$18,919
(% of AGI for various income ranges: 13.9% for AGIs below $25k, 22.0% for AGIs $25k-50k, 48.8% for AGIs $50k-75k, 118.7% for AGIs $75k-100k, 265.0% for AGIs $100k-200k, 8943.3% for AGIs over 200k)
Profit/loss from business: +$15,656 (reported on 13.3% of returns)
Here:
+$15,656
State:
+$13,744
(% of AGI for various income ranges: 89.4% for AGIs below $25k, 119.5% for AGIs $25k-50k, 229.3% for AGIs $50k-75k, 295.5% for AGIs $75k-100k, 360.8% for AGIs $100k-200k, 7510.0% for AGIs over 200k)
Taxable individual retirement arrangement distribution: $20,966 (reported on 9.0% of returns)
43830:
$20,966
Ohio:
$18,876
(% of AGI for various income ranges: 46.4% for AGIs below $25k, 127.5% for AGIs $25k-50k, 223.8% for AGIs $50k-75k, 246.1% for AGIs $75k-100k, 917.2% for AGIs $100k-200k)
Total itemized deductions: $30,400 (reported on 4.0% of returns)
Here:
$30,400
State:
$33,869
(% of AGI for various income ranges: 263.3% for AGIs $50k-75k, 360.3% for AGIs $100k-200k, 5163.3% for AGIs over 200k)
Charity contributions: $13,220 (reported on 3.1% of returns)
Here:
$13,220
State:
$14,577
(% of AGI for various income ranges: 25.0% for AGIs $50k-75k, 106.4% for AGIs $100k-200k, 2780.0% for AGIs over 200k)
Taxes paid: $6,954 (reported on 4.0% of returns)
43830:
$6,954
State:
$7,681
(% of AGI for various income ranges: 52.1% for AGIs $50k-75k, 97.5% for AGIs $100k-200k, 1113.3% for AGIs over 200k)
Earned income credit: $2,282 (reported on 11.8% of returns)
Here:
$2,282
State:
$2,304
(% of AGI for various income ranges: 76.7% for AGIs below $25k, 61.6% for AGIs $25k-50k)
Percentage of individuals using paid preparers for their 2020 taxes: 94.7%
Here:
95%
State:
94%
(% for various income ranges: 96.5% for AGIs below $25k, 93.5% for AGIs $25k-50k, 94.5% for AGIs $50k-75k, 95.1% for AGIs $75k-100k, 94.5% for AGIs $100k-200k, 90.0% for AGIs over 200k)
Averages for the 2012 tax year for zip code 43830, filed in 2013:
Average Adjusted Gross Income (AGI) in 2012: $51,612 (Individual Income Tax Returns)
Here:
$51,612
State:
$54,926
Salary/wage: $45,975 (reported on 87.2% of returns)
Here:
$45,975
State:
$45,869
(% of AGI for various income ranges: 76.2% for AGIs below $25k, 78.8% for AGIs $25k-50k, 81.8% for AGIs $50k-75k, 81.7% for AGIs $75k-100k, 80.9% for AGIs $100k-200k, 58.0% for AGIs over 200k)
Taxable interest for individuals: $610 (reported on 27.1% of returns)
This zip code:
$610
Ohio:
$1,297
(% of AGI for various income ranges: 1.2% for AGIs below $25k, 0.4% for AGIs $25k-50k, 0.2% for AGIs $50k-75k, 0.2% for AGIs $75k-100k, 0.2% for AGIs $100k-200k, 0.4% for AGIs over 200k)
Ordinary dividends: $2,753 (reported on 16.3% of returns)
Here:
$2,753
State:
$5,821
(% of AGI for various income ranges: 1.0% for AGIs below $25k, 0.5% for AGIs $25k-50k, 0.7% for AGIs $50k-75k, 0.6% for AGIs $75k-100k, 0.9% for AGIs $100k-200k, 2.0% for AGIs over 200k)
Net capital gain/loss in AGI: +$7,274 (reported on 12.2% of returns)
Here:
+$7,274
State:
+$11,232
(% of AGI for various income ranges: 0.6% for AGIs below $25k, 0.4% for AGIs $50k-75k, 1.5% for AGIs $75k-100k, 1.7% for AGIs $100k-200k, 7.5% for AGIs over 200k)
Profit/loss from business: +$9,868 (reported on 13.9% of returns)
Here:
+$9,868
State:
+$12,773
(% of AGI for various income ranges: 6.1% for AGIs below $25k, 2.0% for AGIs $25k-50k, 1.7% for AGIs $50k-75k, 2.8% for AGIs $75k-100k, 4.0% for AGIs $100k-200k)
Taxable individual retirement arrangement distribution: $10,975 (reported on 8.3% of returns)
43830:
$10,975
Ohio:
$14,511
(% of AGI for various income ranges: 2.5% for AGIs below $25k, 2.1% for AGIs $25k-50k, 1.9% for AGIs $50k-75k, 2.0% for AGIs $75k-100k, 2.0% for AGIs $100k-200k)
Total itemized deductions: $17,601 (18% of AGI, reported on 29.9% of returns)
Here:
$17,601
State:
$21,278
Here:
18.3% of AGI
State:
18.8% of AGI
(% of AGI for various income ranges: 5.0% for AGIs below $25k, 7.1% for AGIs $25k-50k, 10.7% for AGIs $50k-75k, 11.3% for AGIs $75k-100k, 12.6% for AGIs $100k-200k, 10.6% for AGIs over 200k)
Charity contributions: $3,030 (reported on 22.2% of returns)
Here:
$3,030
State:
$3,943
(% of AGI for various income ranges: 0.4% for AGIs below $25k, 0.7% for AGIs $25k-50k, 1.3% for AGIs $50k-75k, 1.2% for AGIs $75k-100k, 1.7% for AGIs $100k-200k, 2.0% for AGIs over 200k)
Taxes paid: $6,999 (reported on 29.5% of returns)
43830:
$6,999
State:
$9,568
(% of AGI for various income ranges: 0.8% for AGIs below $25k, 1.8% for AGIs $25k-50k, 3.5% for AGIs $50k-75k, 4.3% for AGIs $75k-100k, 5.6% for AGIs $100k-200k, 6.4% for AGIs over 200k)
Earned income credit: $2,372 (reported on 17.4% of returns)
Here:
$2,372
State:
$2,285
(% of AGI for various income ranges: 7.3% for AGIs below $25k, 1.1% for AGIs $25k-50k)
Percentage of individuals using paid preparers for their 2012 taxes: 58.3%
Here:
58%
State:
51%
(% for various income ranges: 50.5% for AGIs below $25k, 61.2% for AGIs $25k-50k, 63.5% for AGIs $50k-75k, 60.0% for AGIs $75k-100k, 64.3% for AGIs $100k-200k, 100.0% for AGIs over 200k)
Averages for the 2004 tax year for zip code 43830, filed in 2005:
Average Adjusted Gross Income (AGI) in 2004: $42,207 (Individual Income Tax Returns)
Here:
$42,207
State:
$44,480
Salary/wage: $39,333 (reported on 88.9% of returns)
Here:
$39,333
State:
$39,198
(% of AGI for various income ranges: 86.4% for AGIs below $10k, 77.8% for AGIs $10k-25k, 83.6% for AGIs $25k-50k, 85.6% for AGIs $50k-75k, 89.8% for AGIs $75k-100k, 75.7% for AGIs over 100k)
Taxable interest for individuals: $822 (reported on 40.3% of returns)
This zip code:
$822
Ohio:
$1,532
(% of AGI for various income ranges: 2.8% for AGIs below $10k, 1.6% for AGIs $10k-25k, 0.9% for AGIs $25k-50k, 0.6% for AGIs $50k-75k, 0.4% for AGIs $75k-100k, 0.7% for AGIs over 100k)
Taxable dividends: $2,089 (reported on 19.3% of returns)
Here:
$2,089
State:
$3,496
(% of AGI for various income ranges: 2.7% for AGIs below $10k, 0.6% for AGIs $10k-25k, 0.5% for AGIs $25k-50k, 0.9% for AGIs $50k-75k, 0.4% for AGIs $75k-100k, 1.9% for AGIs over 100k)
Net capital gain/loss: +$3,269 (reported on 15.2% of returns)
Here:
+$3,269
State:
+$8,582
(% of AGI for various income ranges: -1.2% for AGIs below $10k, -0.0% for AGIs $10k-25k, 0.4% for AGIs $25k-50k, 1.2% for AGIs $50k-75k, 0.2% for AGIs $75k-100k, 3.3% for AGIs over 100k)
Profit/loss from business: +$10,171 (reported on 15.4% of returns)
Here:
+$10,171
State:
+$10,813
(% of AGI for various income ranges: 6.9% for AGIs below $10k, 4.5% for AGIs $10k-25k, 2.4% for AGIs $25k-50k, 3.3% for AGIs $50k-75k, 3.6% for AGIs $75k-100k, 5.0% for AGIs over 100k)
IRA payment deduction: $3,000 (reported on 1.9% of returns)
43830:
$3,000
Ohio:
$2,794
Self-employed pension: $9,600 (reported on 0.4% of returns)
Here:
$9,600
Ohio:
$13,981
Total itemized deductions: $15,052 (21% of AGI, reported on 34.7% of returns)
Here:
$15,052
State:
$17,503
Here:
20.6% of AGI
State:
20.8% of AGI
(% of AGI for various income ranges: 9.2% for AGIs below $10k, 6.6% for AGIs $10k-25k, 11.2% for AGIs $25k-50k, 14.0% for AGIs $50k-75k, 13.7% for AGIs $75k-100k, 13.6% for AGIs over 100k)
Charity contributions deductions: $2,418 (3% of AGI, reported on 27.5% of returns)
Here:
$2,418
State:
$3,087
Here:
3.0% of AGI
State:
3.4% of AGI
(% of AGI for various income ranges: 0.6% for AGIs $10k-25k, 1.1% for AGIs $25k-50k, 1.5% for AGIs $50k-75k, 1.6% for AGIs $75k-100k, 2.7% for AGIs over 100k)
Total tax: $5,616 (reported on 77.1% of returns)
43830:
$5,616
State:
$6,781
(% of AGI for various income ranges: 2.4% for AGIs below $10k, 4.4% for AGIs $10k-25k, 7.1% for AGIs $25k-50k, 8.7% for AGIs $50k-75k, 9.8% for AGIs $75k-100k, 18.4% for AGIs over 100k)
Earned income credit: $1,679 (reported on 12.9% of returns)
Here:
$1,679
State:
$1,696
Percentage of individuals using paid preparers for their 2004 taxes: 62.5%
Here:
62%
State:
55%
(% for various income ranges: 49.1% for AGIs below $10k, 65.5% for AGIs $10k-25k, 70.3% for AGIs $25k-50k, 60.7% for AGIs $50k-75k, 56.0% for AGIs $75k-100k, 71.4% for AGIs over 100k)
Likely homosexual households (counted as self-reported same-sex unmarried-partner households)
Lesbian couples: 0.7% of all households
Gay men: 0.0% of all households
Household received Food Stamps/SNAP in the past 12 months: 269 Household did not receive Food Stamps/SNAP in the past 12 months: 1,979
Women who had a birth in the past 12 months: 108 (10 now married, 94 unmarried) Women who did not have a birth in the past 12 months: 1,383 (776 now married, 606 unmarried)
Housing units in zip code 43830 with a mortgage: 1,472 (201 second mortgage, 175 both second mortgage and home equity loan) Houses without a mortgage: 24
Median monthly owner costs for units with a mortgage: $1,405 Median monthly owner costs for units without a mortgage: $497
Residents with income below the poverty level in 2022:
This zip code:
14.8%
Whole state:
13.4%
Residents with income below 50% of the poverty level in 2022:
This zip code:
6.4%
Whole state:
7.0%
Median number of rooms in houses and condos:
Here:
6.5
State:
6.7
Median number of rooms in apartments:
Here:
4.7
State:
4.4
Notable locations in this zip code not listed on our city pages
Notable locations in zip code 43830: Muskingum Township Volunteer Fire Department (A), Licking Township Volunteer Fire Department (B). Display/hide their locations on the map
Churches in zip code 43830 include: Nashport Community Church (A), Muskingum Presbyterian Church (B), Saint Marys Catholic Church (C). Display/hide their locations on the map
Cemeteries: Bethlehem Cemetery (1), Baxter Cemetery (2), Beulah Baptist Cemetery (3), Mattingly Settlement Cemetery (4), Muskingum Presbyterian Cemetery (5), Perry Cemetery (6), Sidle Cemetery (7). Display/hide their locations on the map
Size of family households: 825 2-persons, 332 3-persons, 475 4-persons, 169 5-persons, 27 6-persons, 46 7-or-more-persons
Size of nonfamily households: 260 1-person, 68 2-persons, 22 3-persons
1,484 married couples with children.
389 single-parent households (78 men, 311 women).
97.7% of residents of 43830 zip code speak English at home.
1.6% of residents speak other Indo-European language at home (34% very well, 66% not at all).
Foreign born population: 4 (0.1%) (100.0% of them are naturalized citizens)
This zip code:
0.1%
Whole state:
5.0%
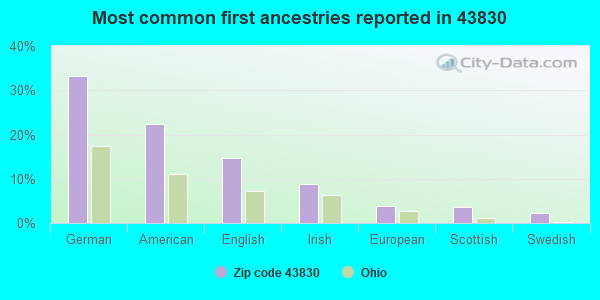
33%German
22%American
15%English
9%Irish
4%European
4%Scottish
2%Swedish
Year of entry for the foreign-born population
02010 or later
32000 to 2009
01990 to 1999
0Before 1990
Public elementary/middle school in in zip code 43830 not listed on the city page:
Facilities with environmental interests located in this zip code:
BLACK RUN TRANSMISSION (10211 NEWARK RD in NASHPORT, OH)
STATE MASTER (Ohio general info) - RCRA-OHR000027565, HAZARDOUS WASTE PROGRAM Small Quantity Generators, between 100 kg and 1000 kg of hazardous waste/month (Resource Conservation and Recovery Act (tracking hazardous waste)) - notification USED OIL PROGRAM (Resource Conservation and Recovery Act (tracking hazardous waste)) Organizations: STEVE GASWINT (CONTACT/OWNER)
BLACK RUN TRANSMISSION (8916 NEWARK RD in NASHPORT, OH)
(Resource Conservation and Recovery Act (tracking hazardous waste)) Organizations: STEVE GASWINT (CONTACT/OWNER)
Housing units lacking complete plumbing facilities: 3.6% Housing units lacking complete kitchen facilities: 3.7%
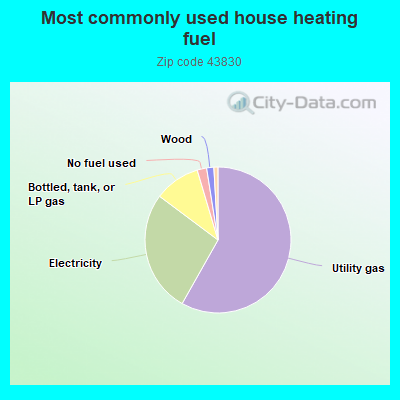
58.3%Utility gas
27.1%Electricity
10.2%Bottled, tank, or LP gas
2.1%No fuel used
1.6%Wood
0.9%Fuel oil, kerosene, etc.
Population in 1990: 3,579. Population change in the 1990s: +1,906 (+53.3%).
Place of birth for U.S.-born residents:
This state: 5,978
Northeast: 166
Midwest: 137
South: 294
West: 74
60% of the 43830 zip code residents lived in the same house 5 years ago. Out of people who lived in different houses, 65% lived in this county. Out of people who lived in different counties, 50% lived in Ohio.
94% of the 43830 zip code residents lived in the same house 1 year ago. Out of people who lived in different houses, 58% moved from this county. Out of people who lived in different houses, 15% moved from different county within same state. Out of people who lived in different houses, 29% moved from different state.
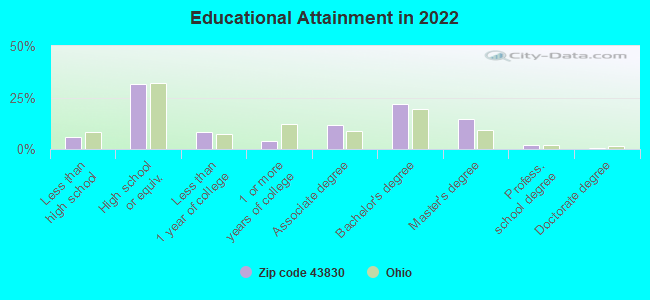
Private vs. public school enrollment:
Students in private schools in grades 1 to 8 (elementary and middle school):
Here:
0.0%
Ohio:
16.0%
Students in private schools in grades 9 to 12 (high school): 40
Here:
7.9%
Ohio:
13.1%
Students in private undergraduate colleges: 67
Here:
24.6%
Ohio:
22.3%
Occupation by median earnings in the past 12 months ($)
91,647Construction and extraction occupations
79,927Management occupations
73,778Education, training, and library occupations
72,703Health technologists and technicians
68,232Computer and mathematical occupations
65,952Health diagnosing and treating practitioners and other technical occupations
Companies with federal contracts located in this zip code:
HAHN SERVICES, INC (5765 LEEHIGH CIRCLE in NASHPORT, OH; small business) : $29,900 in 2 contractsin 2005
$14,950 with Army for Construction of Structures and Facilities -- Office Buildings. Signed on 2005-08-16. Completion date: 2005-09-20.
$14,950 with U.S. Army Corps of Engineers - civil program financing only for Construction of Structures and Facilities -- Office Buildings. Signed on 2005-08-16. Completion date: 2005-09-20.
Top industries in this zip code by the number of employees in 2005:
Arts, Entertainment, and Recreation: Golf Courses and Country Clubs (100-249 employees: 1 establishment, 5-9 employees: 1 establishment)
Mining: Support Activities for Oil and Gas Operations (50-99: 1)
Health Care and Social Assistance: Home Health Care Services (20-49: 1)
Construction: New Single-Family Housing Construction (except Operative Builders) (10-19: 1, 1-4: 2)
Construction: Drywall and Insulation Contractors (10-19: 1, 1-4: 1)
Accommodation and Food Services: Full-Service Restaurants (10-19: 1)
Administrative and Support and Waste Management and Remediation Services: Carpet and Upholstery Cleaning Services (10-19: 1)
Construction: Framing Contractors (5-9: 2)
People in group quarters in 2000:
10 people in homes or halfway houses for drug/alcohol abuse
Fatal accident statistics in 2014:
Fatal accident count: 1
Vehicles involved in fatal accidents: 2
Fatal accidents caused by drunken drivers: 0
Fatalities: 3
Persons involved in fatal accidents: 4
Pedestrians involved in fatal accidents: 0
Fatal accident statistics in 2012:
Fatal accident count: 1
Vehicles involved in fatal accidents: 1
Fatal accidents caused by drunken drivers: 1
Fatalities: 1
Persons involved in fatal accidents: 1
Pedestrians involved in fatal accidents: 0
Home Mortgage Disclosure Act Aggregated Statistics For Year 2009 (Based on 2 partial tracts)
A) FHA, FSA/RHS & VA Home Purchase Loans
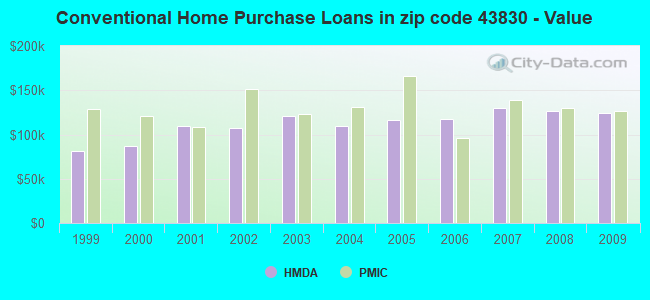
B) Conventional Home Purchase Loans
C) Refinancings
D) Home Improvement Loans
F) Non-occupant Loans on < 5 Family Dwellings (A B C & D)
G) Loans On Manufactured Home Dwelling (A B C & D)
Number
Average Value
Number
Average Value
Number
Average Value
Number
Average Value
Number
Average Value
Number
Average Value
LOANS ORIGINATED
7
$132,499
6
$124,543
33
$135,671
2
$102,145
1
$134,400
1
$90,220
APPLICATIONS APPROVED, NOT ACCEPTED
0
$0
1
$139,580
3
$133,773
1
$24,270
0
$0
0
$0
APPLICATIONS DENIED
0
$0
2
$52,990
14
$142,276
1
$18,670
0
$0
2
$120,705
APPLICATIONS WITHDRAWN
0
$0
1
$51,020
2
$167,060
0
$0
0
$0
0
$0
FILES CLOSED FOR INCOMPLETENESS
0
$0
0
$0
1
$169,240
0
$0
0
$0
0
$0
Aggregated Statistics For Year 2008 (Based on 2 partial tracts)
A) FHA, FSA/RHS & VA Home Purchase Loans
B) Conventional Home Purchase Loans
C) Refinancings
D) Home Improvement Loans
F) Non-occupant Loans on < 5 Family Dwellings (A B C & D)
G) Loans On Manufactured Home Dwelling (A B C & D)
Number
Average Value
Number
Average Value
Number
Average Value
Number
Average Value
Number
Average Value
Number
Average Value
LOANS ORIGINATED
3
$116,213
5
$126,596
16
$136,119
2
$56,515
1
$246,390
2
$107,535
APPLICATIONS APPROVED, NOT ACCEPTED
0
$0
1
$113,660
4
$131,492
1
$13,070
0
$0
0
$0
APPLICATIONS DENIED
0
$0
2
$110,750
16
$129,871
2
$65,540
1
$58,900
2
$68,025
APPLICATIONS WITHDRAWN
0
$0
0
$0
6
$125,547
1
$79,850
0
$0
1
$101,830
FILES CLOSED FOR INCOMPLETENESS
0
$0
0
$0
1
$66,780
0
$0
0
$0
0
$0
Aggregated Statistics For Year 2007 (Based on 2 partial tracts)
A) FHA, FSA/RHS & VA Home Purchase Loans
B) Conventional Home Purchase Loans
C) Refinancings
D) Home Improvement Loans
F) Non-occupant Loans on < 5 Family Dwellings (A B C & D)
G) Loans On Manufactured Home Dwelling (A B C & D)
Number
Average Value
Number
Average Value
Number
Average Value
Number
Average Value
Number
Average Value
Number
Average Value
LOANS ORIGINATED
2
$105,360
10
$130,268
20
$114,018
5
$31,068
2
$150,470
3
$102,800
APPLICATIONS APPROVED, NOT ACCEPTED
0
$0
1
$182,300
6
$140,063
0
$0
0
$0
1
$42,310
APPLICATIONS DENIED
1
$86,690
2
$98,825
25
$120,491
3
$62,150
1
$103,080
2
$101,315
APPLICATIONS WITHDRAWN
0
$0
1
$92,290
8
$110,155
1
$115,520
0
$0
1
$35,260
FILES CLOSED FOR INCOMPLETENESS
0
$0
0
$0
2
$141,345
0
$0
0
$0
0
$0
Aggregated Statistics For Year 2006 (Based on 2 partial tracts)
A) FHA, FSA/RHS & VA Home Purchase Loans
B) Conventional Home Purchase Loans
C) Refinancings
D) Home Improvement Loans
F) Non-occupant Loans on < 5 Family Dwellings (A B C & D)
G) Loans On Manufactured Home Dwelling (A B C & D)
Number
Average Value
Number
Average Value
Number
Average Value
Number
Average Value
Number
Average Value
Number
Average Value
LOANS ORIGINATED
2
$106,915
15
$117,886
27
$115,821
4
$29,918
4
$77,930
4
$70,308
APPLICATIONS APPROVED, NOT ACCEPTED
0
$0
2
$74,455
6
$125,062
0
$0
0
$0
1
$57,660
APPLICATIONS DENIED
1
$85,240
4
$117,648
31
$111,615
5
$70,350
0
$0
2
$80,575
APPLICATIONS WITHDRAWN
0
$0
1
$235,190
12
$130,904
1
$92,920
0
$0
0
$0
FILES CLOSED FOR INCOMPLETENESS
0
$0
4
$109,560
2
$96,960
0
$0
0
$0
0
$0
Aggregated Statistics For Year 2005 (Based on 2 partial tracts)
A) FHA, FSA/RHS & VA Home Purchase Loans
B) Conventional Home Purchase Loans
C) Refinancings
D) Home Improvement Loans
F) Non-occupant Loans on < 5 Family Dwellings (A B C & D)
G) Loans On Manufactured Home Dwelling (A B C & D)
Number
Average Value
Number
Average Value
Number
Average Value
Number
Average Value
Number
Average Value
Number
Average Value
LOANS ORIGINATED
1
$107,230
15
$116,061
23
$119,517
6
$73,592
2
$121,225
2
$64,915
APPLICATIONS APPROVED, NOT ACCEPTED
0
$0
1
$185,620
9
$100,589
1
$15,550
0
$0
0
$0
APPLICATIONS DENIED
1
$64,920
4
$90,168
35
$116,446
5
$46,830
1
$42,100
2
$88,040
APPLICATIONS WITHDRAWN
0
$0
3
$105,083
15
$127,786
2
$82,855
0
$0
1
$146,840
FILES CLOSED FOR INCOMPLETENESS
0
$0
1
$89,180
1
$104,320
0
$0
0
$0
0
$0
Aggregated Statistics For Year 2004 (Based on 2 partial tracts)
A) FHA, FSA/RHS & VA Home Purchase Loans
B) Conventional Home Purchase Loans
C) Refinancings
D) Home Improvement Loans
F) Non-occupant Loans on < 5 Family Dwellings (A B C & D)
G) Loans On Manufactured Home Dwelling (A B C & D)
Number
Average Value
Number
Average Value
Number
Average Value
Number
Average Value
Number
Average Value
Number
Average Value
LOANS ORIGINATED
1
$163,020
16
$109,896
39
$111,618
4
$41,740
2
$84,410
4
$79,590
APPLICATIONS APPROVED, NOT ACCEPTED
0
$0
2
$81,820
8
$109,274
0
$0
0
$0
1
$82,130
APPLICATIONS DENIED
1
$94,570
6
$105,602
35
$106,977
4
$42,672
1
$59,320
2
$89,805
APPLICATIONS WITHDRAWN
0
$0
1
$105,770
17
$117,620
1
$26,960
1
$47,290
1
$115,110
FILES CLOSED FOR INCOMPLETENESS
0
$0
1
$110,960
3
$189,217
0
$0
0
$0
0
$0
Aggregated Statistics For Year 2003 (Based on 2 partial tracts)
A) FHA, FSA/RHS & VA Home Purchase Loans
B) Conventional Home Purchase Loans
C) Refinancings
D) Home Improvement Loans
F) Non-occupant Loans on < 5 Family Dwellings (A B C & D)
Number
Average Value
Number
Average Value
Number
Average Value
Number
Average Value
Number
Average Value
LOANS ORIGINATED
3
$104,183
15
$121,371
79
$108,344
2
$45,940
2
$96,750
APPLICATIONS APPROVED, NOT ACCEPTED
0
$0
1
$54,960
9
$110,360
0
$0
0
$0
APPLICATIONS DENIED
0
$0
3
$74,043
35
$113,501
2
$15,035
1
$88,350
APPLICATIONS WITHDRAWN
0
$0
2
$112,930
16
$110,972
0
$0
0
$0
FILES CLOSED FOR INCOMPLETENESS
0
$0
0
$0
4
$113,138
0
$0
0
$0
Aggregated Statistics For Year 2002 (Based on 2 partial tracts)
A) FHA, FSA/RHS & VA Home Purchase Loans
B) Conventional Home Purchase Loans
C) Refinancings
D) Home Improvement Loans
F) Non-occupant Loans on < 5 Family Dwellings (A B C & D)
Number
Average Value
Number
Average Value
Number
Average Value
Number
Average Value
Number
Average Value
LOANS ORIGINATED
4
$113,085
11
$107,792
58
$104,855
2
$13,480
2
$46,560
APPLICATIONS APPROVED, NOT ACCEPTED
0
$0
1
$151,190
11
$78,868
0
$0
0
$0
APPLICATIONS DENIED
0
$0
2
$77,570
27
$102,747
2
$20,945
1
$30,280
APPLICATIONS WITHDRAWN
0
$0
1
$63,460
15
$110,917
1
$3,730
0
$0
FILES CLOSED FOR INCOMPLETENESS
0
$0
0
$0
5
$129,750
0
$0
0
$0
Aggregated Statistics For Year 2001 (Based on 2 partial tracts)
A) FHA, FSA/RHS & VA Home Purchase Loans
B) Conventional Home Purchase Loans
C) Refinancings
D) Home Improvement Loans
F) Non-occupant Loans on < 5 Family Dwellings (A B C & D)
Number
Average Value
Number
Average Value
Number
Average Value
Number
Average Value
Number
Average Value
LOANS ORIGINATED
3
$122,643
14
$110,070
50
$93,857
6
$22,227
1
$79,430
APPLICATIONS APPROVED, NOT ACCEPTED
0
$0
1
$62,010
15
$83,942
1
$38,160
0
$0
APPLICATIONS DENIED
0
$0
2
$59,730
33
$97,051
4
$14,518
0
$0
APPLICATIONS WITHDRAWN
0
$0
0
$0
17
$111,996
1
$53,720
0
$0
FILES CLOSED FOR INCOMPLETENESS
0
$0
0
$0
3
$105,980
0
$0
0
$0
Aggregated Statistics For Year 2000 (Based on 2 partial tracts)
A) FHA, FSA/RHS & VA Home Purchase Loans
B) Conventional Home Purchase Loans
C) Refinancings
D) Home Improvement Loans
F) Non-occupant Loans on < 5 Family Dwellings (A B C & D)
Number
Average Value
Number
Average Value
Number
Average Value
Number
Average Value
Number
Average Value
LOANS ORIGINATED
4
$113,862
13
$86,486
21
$72,155
5
$15,182
2
$40,545
APPLICATIONS APPROVED, NOT ACCEPTED
0
$0
2
$36,710
7
$66,457
1
$19,910
0
$0
APPLICATIONS DENIED
0
$0
5
$57,118
18
$71,092
4
$14,985
0
$0
APPLICATIONS WITHDRAWN
1
$62,630
1
$71,140
6
$83,617
0
$0
0
$0
FILES CLOSED FOR INCOMPLETENESS
0
$0
1
$40,440
1
$82,340
0
$0
0
$0
Aggregated Statistics For Year 1999 (Based on 1 partial tract)
A) FHA, FSA/RHS & VA Home Purchase Loans
B) Conventional Home Purchase Loans
C) Refinancings
D) Home Improvement Loans
F) Non-occupant Loans on < 5 Family Dwellings (A B C & D)
Detailed PMIC statistics for the following Tracts:7589.00
2002 - 2018 National Fire Incident Reporting System (NFIRS) incidents
Based on the data from the years 2002 - 2018 the average number of fires per year is 23. The highest number of fire incidents - 35 took place in 2009, and the least - 4 in 2013. The data has a dropping trend.
When looking into fire subcategories, the most reports belonged to: Structure Fires (42.1%), and Outside Fires (41.3%).
Fire incident types reported to NFIRS in Zip Code 43830


 Nearest zip codes: 43746, 43822, 43740, 43842, 43821, 43721.


 (Students: 511, Location: 3775 CREAMERY RD, Grades: KG-6)


 Based on the data from the years 2002 - 2018 the average number of fires per year is 23. The highest number of fire incidents - 35 took place in 2009, and the least - 4 in 2013. The data has a dropping trend.
 When looking into fire subcategories, the most reports belonged to: Structure Fires (42.1%), and Outside Fires (41.3%).