Estimated zip code population in 2022: 1,036 Zip code population in 2010: 1,574 Zip code population in 2000: 1,645
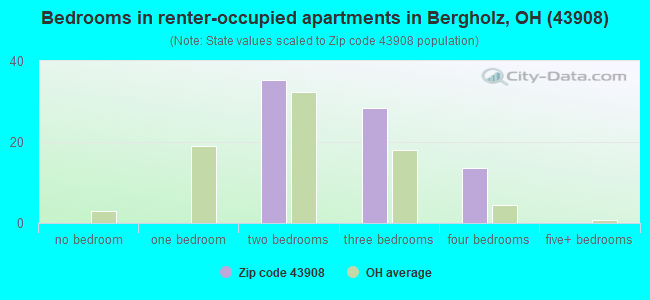
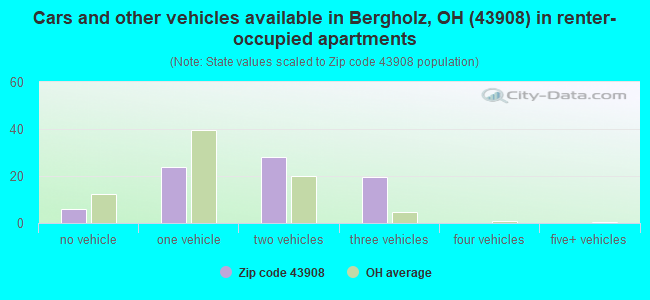
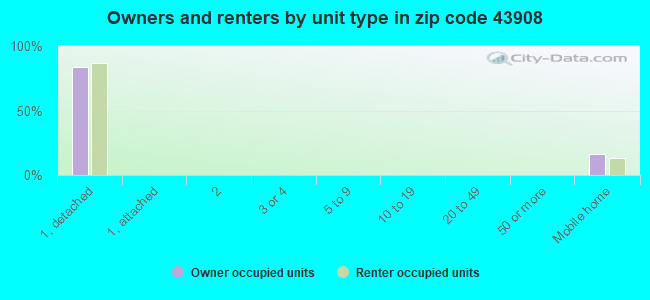
Houses and condos: 569 Renter-occupied apartments: 78
% of renters here:
20%
State:
33%
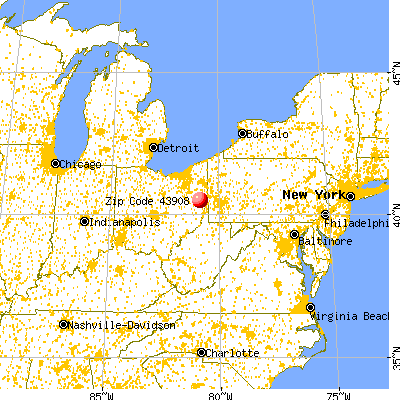
March 2022 cost of living index in zip code 43908: 81.7 (low, U.S. average is 100)
Land area: 31.1 sq. mi. Water area: 0.0 sq. mi.
Population density: 33 people per square mile
(very low).
OSM Map
General Map
Google Map
MSN Map
OSM Map
General Map
Google Map
MSN Map
OSM Map
General Map
Google Map
MSN Map
OSM Map
General Map
Google Map
MSN Map
Please wait while loading the map...
Real estate property taxes paid for housing units in 2022:
This zip code:
1.1% ($967)
Ohio:
1.3% ($2,639)
Median real estate property taxes paid for housing units with mortgages in 2022: $992 (0.6%) Median real estate property taxes paid for housing units with no mortgage in 2022: $928 (1.5%)
Business Search- 14 Million verified businesses
Males: 581
(56.1%)
Females: 454
(43.9%)
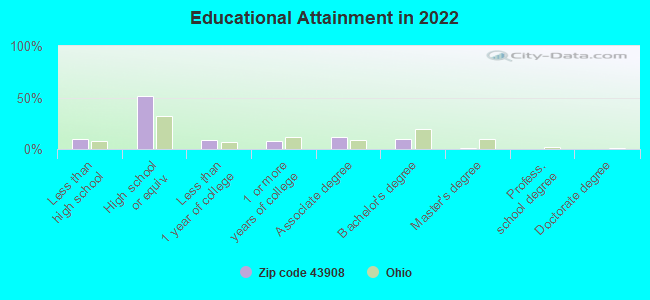
For population 25 years and over in 43908:
High school or higher: 88.6%
Bachelor's degree or higher: 10.6%
Graduate or professional degree: 1.1%
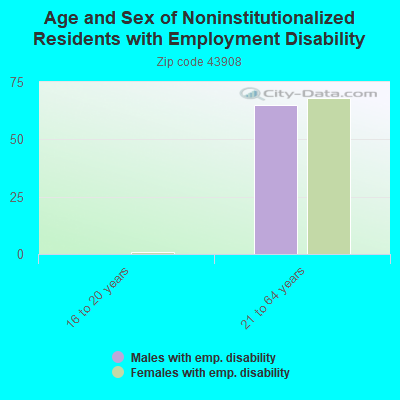
Unemployed: 2.8%
Mean travel time to work (commute): 28.7 minutes
For population 15 years and over in 43908:
Never married: 24.5%
Now married: 60.2%
Separated: 1.9%
Widowed: 3.8%
Divorced: 9.5%
Zip code 43908 compared to state average:
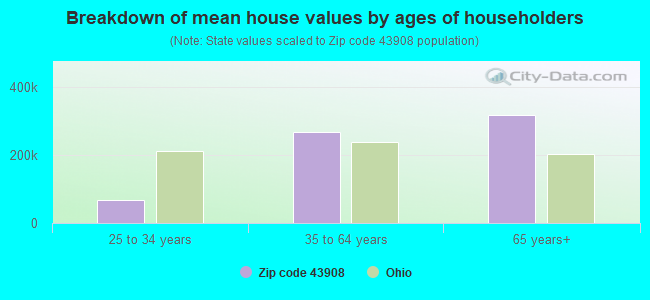
Median house value significantly below state average.
Black race population percentage significantly below state average.
Hispanic race population percentage significantly below state average.
Median age significantly above state average.
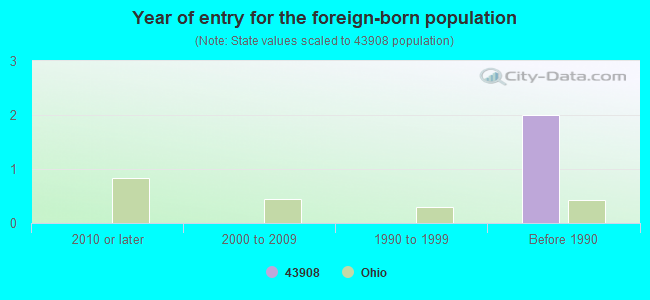
Foreign-born population percentage significantly below state average.
Renting percentage below state average.
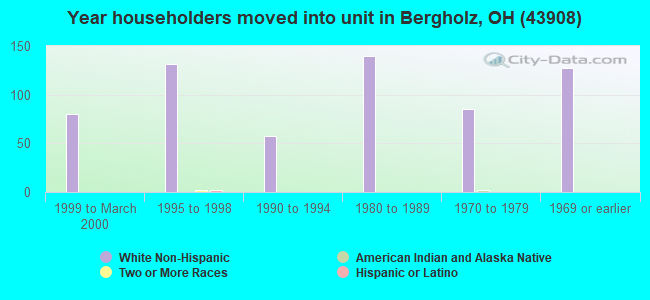
Length of stay since moving in significantly above state average.
Percentage of population with a bachelor's degree or higher significantly below state average.
Estimated median house/condo value in 2022: $90,637
43908:
$90,637
Ohio:
$204,100
According to our research of Ohio and other state lists, there was 1 registered sex offender living in 43908 zip code as of May 17, 2024. The ratio of all residents to sex offenders in zip code 43908 is 1,657 to 1. The ratio of registered sex offenders to all residents in this zip code is much lower than the state average.
Median resident age:
This zip code:
49.4 years
Ohio median age:
39.9 years
Average household size:
This zip code:
2.6 people
Ohio:
2.4 people
Averages for the 2020 tax year for zip code 43908, filed in 2021:
Average Adjusted Gross Income (AGI) in 2020: $55,791 (Individual Income Tax Returns)
Here:
$55,791
State:
$67,288
Salary/wage: $45,605 (reported on 78.2% of returns)
Here:
$45,605
State:
$55,628
(% of AGI for various income ranges: 1053.1% for AGIs below $25k, 3249.1% for AGIs $25k-50k, 5920.0% for AGIs $50k-75k, 9136.7% for AGIs $75k-100k, 14380.0% for AGIs $100k-200k)
Taxable interest for individuals: $492 (reported on 23.6% of returns)
This zip code:
$492
Ohio:
$1,518
(% of AGI for various income ranges: 3.1% for AGIs below $25k, 3.6% for AGIs $25k-50k, 5.0% for AGIs $50k-75k, 104.0% for AGIs $100k-200k)
Ordinary dividends: $3,900 (reported on 10.9% of returns)
Here:
$3,900
State:
$7,167
(% of AGI for various income ranges: 33.6% for AGIs $25k-50k, 394.0% for AGIs $100k-200k)
Net capital gain/loss in AGI: +$6,229 (reported on 12.7% of returns)
Here:
+$6,229
State:
+$18,919
(% of AGI for various income ranges: 59.1% for AGIs $25k-50k, 742.0% for AGIs $100k-200k)
Profit/loss from business: +$8,200 (reported on 10.9% of returns)
Here:
+$8,200
State:
+$13,744
(% of AGI for various income ranges: 313.1% for AGIs below $25k, 106.2% for AGIs $50k-75k)
Taxable individual retirement arrangement distribution: $10,540 (reported on 9.1% of returns)
43908:
$10,540
Ohio:
$18,876
(% of AGI for various income ranges: 125.4% for AGIs below $25k, 455.0% for AGIs $50k-75k)
Earned income credit: $2,288 (reported on 14.5% of returns)
Here:
$2,288
State:
$2,304
(% of AGI for various income ranges: 84.6% for AGIs below $25k, 66.4% for AGIs $25k-50k)
Percentage of individuals using paid preparers for their 2020 taxes: 90.9%
Here:
91%
State:
94%
(% for various income ranges: 88.9% for AGIs below $25k, 92.3% for AGIs $25k-50k, 90.9% for AGIs $50k-75k, 80.0% for AGIs $75k-100k, 100.0% for AGIs $100k-200k)
Averages for the 2012 tax year for zip code 43908, filed in 2013:
Average Adjusted Gross Income (AGI) in 2012: $59,168 (Individual Income Tax Returns)
Here:
$59,168
State:
$54,926
Salary/wage: $38,686 (reported on 82.3% of returns)
Here:
$38,686
State:
$45,869
(% of AGI for various income ranges: 68.0% for AGIs below $25k, 81.8% for AGIs $25k-50k, 82.0% for AGIs $50k-75k, 87.2% for AGIs $75k-100k, 25.7% for AGIs $100k-200k)
Taxable interest for individuals: $1,080 (reported on 24.2% of returns)
This zip code:
$1,080
Ohio:
$1,297
(% of AGI for various income ranges: 0.1% for AGIs below $25k, 0.5% for AGIs $25k-50k, 0.2% for AGIs $50k-75k, 0.6% for AGIs $100k-200k)
Ordinary dividends: $1,538 (reported on 12.9% of returns)
Here:
$1,538
State:
$5,821
(% of AGI for various income ranges: 0.2% for AGIs $25k-50k, 0.1% for AGIs $50k-75k, 0.6% for AGIs $100k-200k)
Net capital gain/loss in AGI: +$5,640 (reported on 8.1% of returns)
Here:
+$5,640
State:
+$11,232
(% of AGI for various income ranges: 0.2% for AGIs $25k-50k, 1.5% for AGIs $100k-200k)
Profit/loss from business: +$6,614 (reported on 11.3% of returns)
Here:
+$6,614
State:
+$12,773
(% of AGI for various income ranges: 12.4% for AGIs below $25k, 1.9% for AGIs $50k-75k)
Taxable individual retirement arrangement distribution: $6,133 (reported on 4.8% of returns)
43908:
$6,133
Ohio:
$14,511
(% of AGI for various income ranges: 2.8% for AGIs $25k-50k)
Total itemized deductions: $25,438 (13% of AGI, reported on 12.9% of returns)
Here:
$25,438
State:
$21,278
Here:
12.5% of AGI
State:
18.8% of AGI
(% of AGI for various income ranges: 9.2% for AGIs below $25k, 10.6% for AGIs $50k-75k, 6.7% for AGIs $100k-200k)
Charity contributions: $7,000 (reported on 11.3% of returns)
Here:
$7,000
State:
$3,943
(% of AGI for various income ranges: 1.3% for AGIs $50k-75k, 2.4% for AGIs $100k-200k)
Taxes paid: $9,050 (reported on 12.9% of returns)
43908:
$9,050
State:
$9,568
(% of AGI for various income ranges: 1.6% for AGIs below $25k, 3.2% for AGIs $50k-75k, 2.8% for AGIs $100k-200k)
Earned income credit: $1,860 (reported on 16.1% of returns)
Here:
$1,860
State:
$2,285
(% of AGI for various income ranges: 4.6% for AGIs below $25k, 0.8% for AGIs $25k-50k)
Percentage of individuals using paid preparers for their 2012 taxes: 51.6%
Here:
52%
State:
51%
(% for various income ranges: 37.5% for AGIs below $25k, 58.8% for AGIs $25k-50k, 55.6% for AGIs $50k-75k, 60.0% for AGIs $75k-100k, 71.4% for AGIs $100k-200k)
Averages for the 2004 tax year for zip code 43908, filed in 2005:
Average Adjusted Gross Income (AGI) in 2004: $35,904 (Individual Income Tax Returns)
Here:
$35,904
State:
$44,480
Salary/wage: $32,109 (reported on 85.4% of returns)
Here:
$32,109
State:
$39,198
(% of AGI for various income ranges: 74.6% for AGIs below $10k, 78.4% for AGIs $10k-25k, 83.4% for AGIs $25k-50k, 86.3% for AGIs $50k-75k, 92.9% for AGIs $75k-100k, 47.6% for AGIs over 100k)
Taxable interest for individuals: $1,648 (reported on 31.5% of returns)
This zip code:
$1,648
Ohio:
$1,532
(% of AGI for various income ranges: 3.7% for AGIs below $10k, 1.7% for AGIs $10k-25k, 0.7% for AGIs $25k-50k, 0.5% for AGIs $50k-75k, 0.1% for AGIs $75k-100k, 3.6% for AGIs over 100k)
Taxable dividends: $9,670 (reported on 15.1% of returns)
Here:
$9,670
State:
$3,496
(% of AGI for various income ranges: 0.5% for AGIs below $10k, 0.5% for AGIs $10k-25k, 0.4% for AGIs $25k-50k, 0.8% for AGIs $50k-75k, 0.4% for AGIs $75k-100k, 17.0% for AGIs over 100k)
Net capital gain/loss: +$3,061 (reported on 10.6% of returns)
Here:
+$3,061
State:
+$8,582
(% of AGI for various income ranges: 0.7% for AGIs $10k-25k, 0.0% for AGIs $25k-50k, -0.2% for AGIs $50k-75k, 3.9% for AGIs over 100k)
Profit/loss from business: +$7,356 (reported on 14.0% of returns)
Here:
+$7,356
State:
+$10,813
(% of AGI for various income ranges: 9.7% for AGIs below $10k, 7.1% for AGIs $10k-25k, 3.7% for AGIs $25k-50k, 2.2% for AGIs $50k-75k)
IRA payment deduction: $1,462 (reported on 2.1% of returns)
43908:
$1,462
Ohio:
$2,794
Total itemized deductions: $18,188 (21% of AGI, reported on 13.6% of returns)
Here:
$18,188
State:
$17,503
Here:
20.5% of AGI
State:
20.8% of AGI
(% of AGI for various income ranges: 15.8% for AGIs below $10k, 4.3% for AGIs $25k-50k, 9.1% for AGIs $50k-75k, 14.4% for AGIs over 100k)
Charity contributions deductions: $5,119 (5% of AGI, reported on 9.5% of returns)
Here:
$5,119
State:
$3,087
Here:
4.9% of AGI
State:
3.4% of AGI
Total tax: $5,036 (reported on 71.3% of returns)
43908:
$5,036
State:
$6,781
(% of AGI for various income ranges: 2.1% for AGIs below $10k, 4.0% for AGIs $10k-25k, 7.1% for AGIs $25k-50k, 10.0% for AGIs $50k-75k, 11.1% for AGIs $75k-100k, 18.6% for AGIs over 100k)
Earned income credit: $1,664 (reported on 19.6% of returns)
Here:
$1,664
State:
$1,696
Percentage of individuals using paid preparers for their 2004 taxes: 60.7%
Here:
61%
State:
55%
(% for various income ranges: 54.8% for AGIs below $10k, 57.3% for AGIs $10k-25k, 64.4% for AGIs $25k-50k, 64.0% for AGIs $50k-75k, 54.2% for AGIs $75k-100k, 82.6% for AGIs over 100k)
Streams, rivers, and creeks: Mathews Run (A), Hump Run (B), Elkhorn Creek (C), Burgett Run (D), Wolf Run (E), Upper North Fork (F). Display/hide their locations on the map
Size of family households: 151 2-persons, 98 3-persons, 40 4-persons, 18 5-persons
Size of nonfamily households: 65 1-person, 12 2-persons, 3 3-persons
126 married couples with children.
63 single-parent households (18 men, 45 women).
99.5% of residents of 43908 zip code speak English at home.
0.3% of residents speak Spanish at home (100% very well).
0.3% of residents speak other Indo-European language at home (100% very well).
Foreign born population: 0 (0.0%)
:
0.0%
Whole state:
5.0%
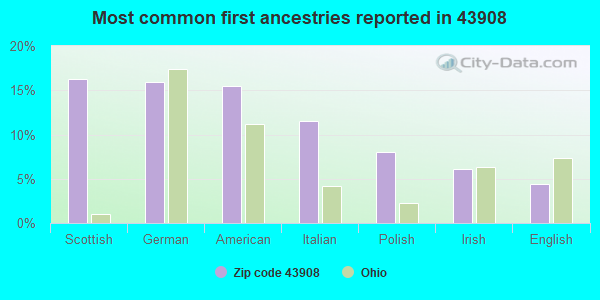
16%Scottish
16%German
15%American
12%Italian
8%Polish
6%Irish
4%English
Year of entry for the foreign-born population
02010 or later
02000 to 2009
01990 to 1999
2Before 1990
Facilities with environmental interests located in this zip code:
BILL DENOON LUMBER CO/OFFICE AND MILL (571 COUNTY HWY 52 in BERGHOLZ, OH)
AIR MINOR (AIRS/AFS) STATE MASTER (Ohio general info) - SDWIS-4137912, DRINKING WATER PROGRAM Business SIC classification: SAWMILLS AND PLANING MILLS, GENERAL
Housing units lacking complete plumbing facilities: 3.6% Housing units lacking complete kitchen facilities: 8.7%
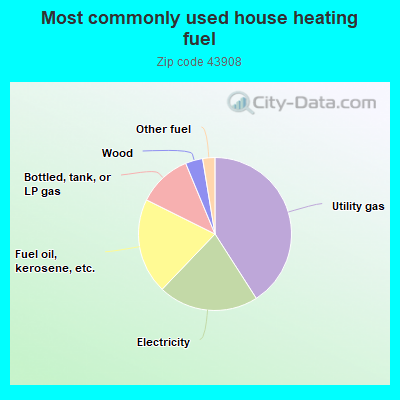
41.3%Utility gas
21.4%Electricity
20.4%Fuel oil, kerosene, etc.
11.5%Bottled, tank, or LP gas
3.7%Wood
2.6%Other fuel
Population in 1990: 3,392.
Place of birth for U.S.-born residents:
This state: 826
Northeast: 80
Midwest: 23
South: 98
West: 3
66% of the 43908 zip code residents lived in the same house 5 years ago. Out of people who lived in different houses, 52% lived in this county. Out of people who lived in different counties, 50% lived in Ohio.
94% of the 43908 zip code residents lived in the same house 1 year ago. Out of people who lived in different houses, 59% moved from different county within same state. Out of people who lived in different houses, 34% moved from different state. Out of people who lived in different houses, 25% moved from abroad.
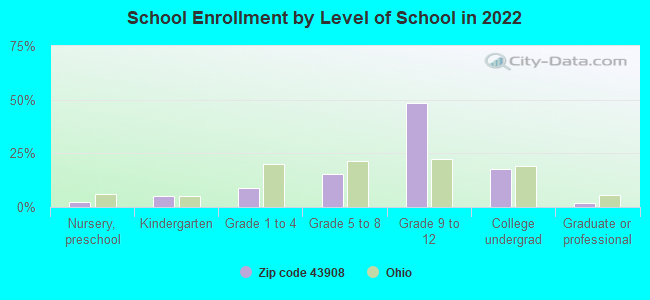
Private vs. public school enrollment:
Students in private schools in grades 1 to 8 (elementary and middle school): 5
Here:
11.5%
Ohio:
16.0%
Students in private schools in grades 9 to 12 (high school): 22
Here:
22.1%
Ohio:
13.1%
Students in private undergraduate colleges: 21
Here:
59.3%
Ohio:
22.3%
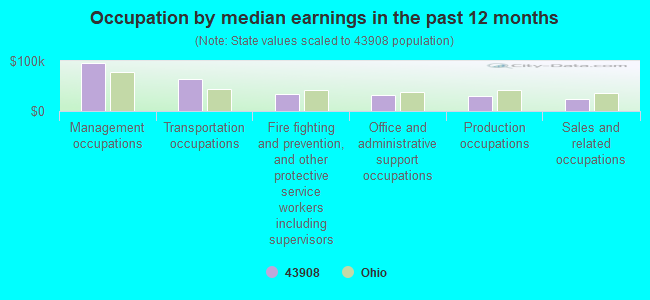
Occupation by median earnings in the past 12 months ($)
95,012Management occupations
64,217Transportation occupations
33,158Fire fighting and prevention, and other protective service workers including supervisors
31,008Office and administrative support occupations
30,659Production occupations
24,111Sales and related occupations
Top industries in this zip code by the number of employees in 2005:
Finance and Insurance: Insurance Agencies and Brokerages (10-19 employees: 1 establishment, 5-9 employees: 1 establishment)
Accommodation and Food Services: Full-Service Restaurants (10-19: 1)
Management of Companies and Enterprises: Corporate, Subsidiary, and Regional Managing Offices (10-19: 1)
Accommodation and Food Services: Recreational and Vacation Camps (except Campgrounds) (10-19: 1)
Health Care and Social Assistance: Offices of Physicians (except Mental Health Specialists) (5-9: 1)
Wholesale Trade: Wholesale Trade Agents and Brokers (5-9: 1)
Finance and Insurance: Commercial Banking (5-9: 1)
Wholesale Trade: Other Grocery and Related Products Merchant Wholesalers (5-9: 1)
People in group quarters in 2000:
14 people in homes for the mentally ill
9 people in nursing homes
Home Mortgage Disclosure Act Aggregated Statistics For Year 2009 (Based on 2 partial tracts)
A) FHA, FSA/RHS & VA Home Purchase Loans
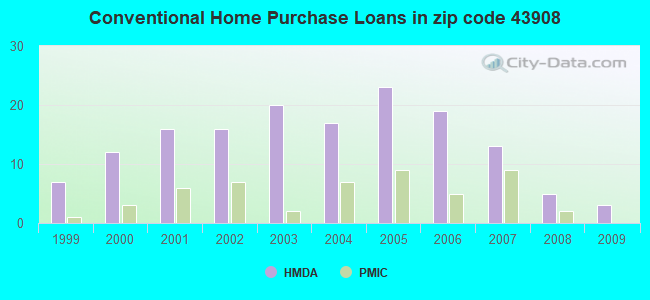
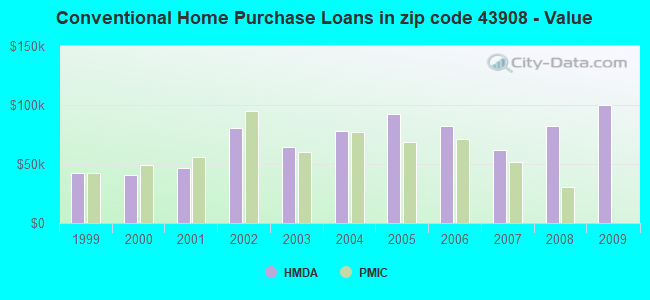
B) Conventional Home Purchase Loans
C) Refinancings
D) Home Improvement Loans
F) Non-occupant Loans on < 5 Family Dwellings (A B C & D)
G) Loans On Manufactured Home Dwelling (A B C & D)
Number
Average Value
Number
Average Value
Number
Average Value
Number
Average Value
Number
Average Value
Number
Average Value
LOANS ORIGINATED
5
$100,724
3
$100,153
25
$108,914
7
$33,583
0
$0
0
$0
APPLICATIONS APPROVED, NOT ACCEPTED
0
$0
1
$129,990
2
$88,350
2
$7,395
0
$0
0
$0
APPLICATIONS DENIED
2
$70,835
1
$202,380
19
$82,387
2
$41,645
2
$26,465
1
$54,490
APPLICATIONS WITHDRAWN
0
$0
0
$0
4
$106,835
2
$62,660
0
$0
1
$73,170
FILES CLOSED FOR INCOMPLETENESS
0
$0
0
$0
2
$80,955
0
$0
0
$0
1
$104,310
Aggregated Statistics For Year 2008 (Based on 2 partial tracts)
A) FHA, FSA/RHS & VA Home Purchase Loans
B) Conventional Home Purchase Loans
C) Refinancings
D) Home Improvement Loans
F) Non-occupant Loans on < 5 Family Dwellings (A B C & D)
G) Loans On Manufactured Home Dwelling (A B C & D)
Number
Average Value
Number
Average Value
Number
Average Value
Number
Average Value
Number
Average Value
Number
Average Value
LOANS ORIGINATED
6
$76,283
5
$82,510
26
$74,188
8
$50,304
2
$31,915
1
$6,230
APPLICATIONS APPROVED, NOT ACCEPTED
0
$0
1
$112,870
3
$80,177
2
$26,465
0
$0
1
$112,870
APPLICATIONS DENIED
2
$77,840
6
$70,963
13
$95,983
9
$53,537
0
$0
3
$71,613
APPLICATIONS WITHDRAWN
0
$0
1
$105,080
10
$64,529
1
$41,260
0
$0
0
$0
FILES CLOSED FOR INCOMPLETENESS
0
$0
2
$30,360
2
$28,800
1
$120,650
0
$0
0
$0
Aggregated Statistics For Year 2007 (Based on 2 partial tracts)
A) FHA, FSA/RHS & VA Home Purchase Loans
B) Conventional Home Purchase Loans
C) Refinancings
D) Home Improvement Loans
F) Non-occupant Loans on < 5 Family Dwellings (A B C & D)
G) Loans On Manufactured Home Dwelling (A B C & D)
Number
Average Value
Number
Average Value
Number
Average Value
Number
Average Value
Number
Average Value
Number
Average Value
LOANS ORIGINATED
5
$94,810
13
$61,913
30
$61,987
13
$39,698
2
$47,480
2
$72,390
APPLICATIONS APPROVED, NOT ACCEPTED
1
$93,410
1
$24,130
7
$83,623
1
$50,600
0
$0
2
$122,985
APPLICATIONS DENIED
2
$64,995
3
$31,913
24
$80,694
8
$30,260
0
$0
2
$82,900
APPLICATIONS WITHDRAWN
0
$0
2
$26,465
6
$54,488
1
$71,610
0
$0
1
$79,400
FILES CLOSED FOR INCOMPLETENESS
0
$0
0
$0
4
$113,258
0
$0
0
$0
0
$0
Aggregated Statistics For Year 2006 (Based on 2 partial tracts)
A) FHA, FSA/RHS & VA Home Purchase Loans
B) Conventional Home Purchase Loans
C) Refinancings
D) Home Improvement Loans
F) Non-occupant Loans on < 5 Family Dwellings (A B C & D)
G) Loans On Manufactured Home Dwelling (A B C & D)
Number
Average Value
Number
Average Value
Number
Average Value
Number
Average Value
Number
Average Value
Number
Average Value
LOANS ORIGINATED
2
$63,830
19
$82,265
58
$72,257
17
$29,534
2
$85,235
5
$54,644
APPLICATIONS APPROVED, NOT ACCEPTED
0
$0
0
$0
5
$73,948
3
$17,903
1
$36,580
0
$0
APPLICATIONS DENIED
0
$0
5
$39,698
38
$64,177
5
$28,334
2
$66,165
4
$66,942
APPLICATIONS WITHDRAWN
1
$25,690
1
$110,530
9
$72,564
2
$40,865
0
$0
0
$0
FILES CLOSED FOR INCOMPLETENESS
0
$0
1
$70,830
0
$0
0
$0
0
$0
0
$0
Aggregated Statistics For Year 2005 (Based on 2 partial tracts)
A) FHA, FSA/RHS & VA Home Purchase Loans
B) Conventional Home Purchase Loans
C) Refinancings
D) Home Improvement Loans
F) Non-occupant Loans on < 5 Family Dwellings (A B C & D)
G) Loans On Manufactured Home Dwelling (A B C & D)
Number
Average Value
Number
Average Value
Number
Average Value
Number
Average Value
Number
Average Value
Number
Average Value
LOANS ORIGINATED
2
$53,710
23
$92,359
61
$53,952
16
$27,341
2
$43,980
4
$50,985
APPLICATIONS APPROVED, NOT ACCEPTED
0
$0
2
$110,145
10
$87,181
2
$40,090
0
$0
1
$75,500
APPLICATIONS DENIED
3
$58,640
9
$45,061
38
$68,602
10
$20,861
0
$0
5
$66,164
APPLICATIONS WITHDRAWN
0
$0
5
$57,758
19
$86,525
1
$71,610
1
$69,280
0
$0
FILES CLOSED FOR INCOMPLETENESS
0
$0
0
$0
2
$125,320
0
$0
0
$0
0
$0
Aggregated Statistics For Year 2004 (Based on 2 partial tracts)
A) FHA, FSA/RHS & VA Home Purchase Loans
B) Conventional Home Purchase Loans
C) Refinancings
D) Home Improvement Loans
F) Non-occupant Loans on < 5 Family Dwellings (A B C & D)
G) Loans On Manufactured Home Dwelling (A B C & D)
Number
Average Value
Number
Average Value
Number
Average Value
Number
Average Value
Number
Average Value
Number
Average Value
LOANS ORIGINATED
1
$43,590
17
$77,565
47
$57,353
13
$26,226
2
$17,905
4
$41,645
APPLICATIONS APPROVED, NOT ACCEPTED
0
$0
2
$63,830
9
$78,446
3
$5,967
1
$59,940
1
$58,380
APPLICATIONS DENIED
1
$66,940
2
$20,240
32
$74,070
2
$19,850
0
$0
5
$65,386
APPLICATIONS WITHDRAWN
0
$0
1
$65,390
17
$89,654
2
$35,415
0
$0
0
$0
FILES CLOSED FOR INCOMPLETENESS
1
$52,930
0
$0
5
$65,074
2
$58,770
0
$0
0
$0
Aggregated Statistics For Year 2003 (Based on 2 partial tracts)
A) FHA, FSA/RHS & VA Home Purchase Loans
B) Conventional Home Purchase Loans
C) Refinancings
D) Home Improvement Loans
F) Non-occupant Loans on < 5 Family Dwellings (A B C & D)
Number
Average Value
Number
Average Value
Number
Average Value
Number
Average Value
Number
Average Value
LOANS ORIGINATED
2
$59,550
20
$64,140
73
$61,046
12
$31,914
2
$81,345
APPLICATIONS APPROVED, NOT ACCEPTED
0
$0
0
$0
9
$74,813
2
$42,810
0
$0
APPLICATIONS DENIED
1
$38,920
8
$41,060
32
$60,861
5
$8,562
0
$0
APPLICATIONS WITHDRAWN
0
$0
2
$48,650
18
$74,121
1
$33,470
0
$0
FILES CLOSED FOR INCOMPLETENESS
2
$51,375
1
$38,140
4
$77,645
0
$0
0
$0
Aggregated Statistics For Year 2002 (Based on 2 partial tracts)
A) FHA, FSA/RHS & VA Home Purchase Loans
B) Conventional Home Purchase Loans
C) Refinancings
D) Home Improvement Loans
F) Non-occupant Loans on < 5 Family Dwellings (A B C & D)
Number
Average Value
Number
Average Value
Number
Average Value
Number
Average Value
Number
Average Value
LOANS ORIGINATED
2
$63,440
16
$80,856
50
$60,295
18
$15,784
2
$32,695
APPLICATIONS APPROVED, NOT ACCEPTED
0
$0
1
$40,480
4
$42,812
2
$4,670
1
$35,030
APPLICATIONS DENIED
1
$104,310
5
$32,692
29
$60,312
5
$30,980
0
$0
APPLICATIONS WITHDRAWN
0
$0
2
$71,225
16
$73,608
3
$9,080
0
$0
FILES CLOSED FOR INCOMPLETENESS
1
$49,040
0
$0
8
$58,282
0
$0
0
$0
Aggregated Statistics For Year 2001 (Based on 2 partial tracts)
A) FHA, FSA/RHS & VA Home Purchase Loans
B) Conventional Home Purchase Loans
C) Refinancings
D) Home Improvement Loans
F) Non-occupant Loans on < 5 Family Dwellings (A B C & D)
Number
Average Value
Number
Average Value
Number
Average Value
Number
Average Value
Number
Average Value
LOANS ORIGINATED
2
$70,835
16
$46,948
58
$54,206
19
$11,594
3
$29,840
APPLICATIONS APPROVED, NOT ACCEPTED
0
$0
4
$49,818
7
$57,601
1
$3,890
0
$0
APPLICATIONS DENIED
0
$0
15
$38,816
33
$64,442
5
$12,610
2
$20,630
APPLICATIONS WITHDRAWN
0
$0
2
$46,705
23
$56,214
2
$39,310
0
$0
FILES CLOSED FOR INCOMPLETENESS
0
$0
0
$0
5
$56,512
0
$0
0
$0
Aggregated Statistics For Year 2000 (Based on 2 partial tracts)
A) FHA, FSA/RHS & VA Home Purchase Loans
B) Conventional Home Purchase Loans
C) Refinancings
D) Home Improvement Loans
F) Non-occupant Loans on < 5 Family Dwellings (A B C & D)
Number
Average Value
Number
Average Value
Number
Average Value
Number
Average Value
Number
Average Value
LOANS ORIGINATED
3
$55,007
12
$40,477
26
$69,577
9
$16,952
1
$7,780
APPLICATIONS APPROVED, NOT ACCEPTED
1
$37,360
4
$52,152
6
$47,093
1
$3,110
0
$0
APPLICATIONS DENIED
3
$50,597
14
$41,811
27
$54,719
12
$14,336
1
$31,140
APPLICATIONS WITHDRAWN
0
$0
3
$38,400
11
$75,929
0
$0
0
$0
FILES CLOSED FOR INCOMPLETENESS
0
$0
0
$0
1
$38,920
0
$0
0
$0
Aggregated Statistics For Year 1999 (Based on 1 partial tract)
A) FHA, FSA/RHS & VA Home Purchase Loans
B) Conventional Home Purchase Loans
C) Refinancings
D) Home Improvement Loans
F) Non-occupant Loans on < 5 Family Dwellings (A B C & D)
Detailed PMIC statistics for the following Tracts:0111.00
2002 - 2018 National Fire Incident Reporting System (NFIRS) incidents
According to the data from the years 2002 - 2018 the average number of fire incidents per year is 15. The highest number of reported fires - 27 took place in 2013, and the least - 1 in 2004. The data has a rising trend.
When looking into fire subcategories, the most incidents belonged to: Structure Fires (54.0%), and Outside Fires (36.7%).
Fire incident types reported to NFIRS in Zip Code 43908


 Nearest zip codes: 43970, 43925, 43903, 43932, 43930, 43944.


 According to the data from the years 2002 - 2018 the average number of fire incidents per year is 15. The highest number of reported fires - 27 took place in 2013, and the least - 1 in 2004. The data has a rising trend.
 When looking into fire subcategories, the most incidents belonged to: Structure Fires (54.0%), and Outside Fires (36.7%).