Estimated zip code population in 2022: 918 Zip code population in 2010: 931 Zip code population in 2000: 1,110
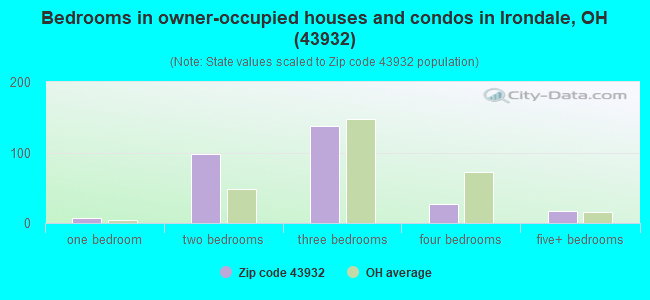
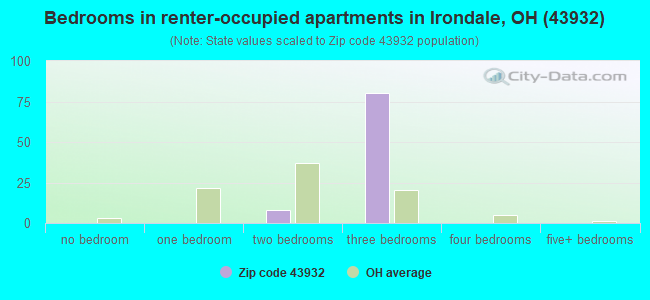
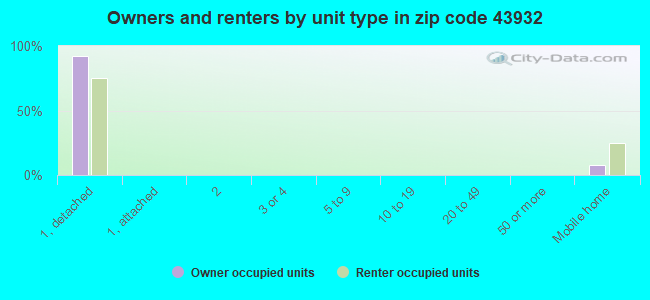
Houses and condos: 401 Renter-occupied apartments: 90
% of renters here:
24%
State:
33%
March 2022 cost of living index in zip code 43932: 83.1 (low, U.S. average is 100)
Land area: 18.3 sq. mi. Water area: 0.0 sq. mi.
Population density: 50 people per square mile
(very low).
OSM Map
General Map
Google Map
MSN Map
OSM Map
General Map
Google Map
MSN Map
OSM Map
General Map
Google Map
MSN Map
OSM Map
General Map
Google Map
MSN Map
Please wait while loading the map...
Real estate property taxes paid for housing units in 2022:
This zip code:
0.7% ($1,082)
Ohio:
1.3% ($2,639)
Median real estate property taxes paid for housing units with mortgages in 2022: $1,572 (0.7%) Median real estate property taxes paid for housing units with no mortgage in 2022: $923 (0.9%)
Business Search- 14 Million verified businesses
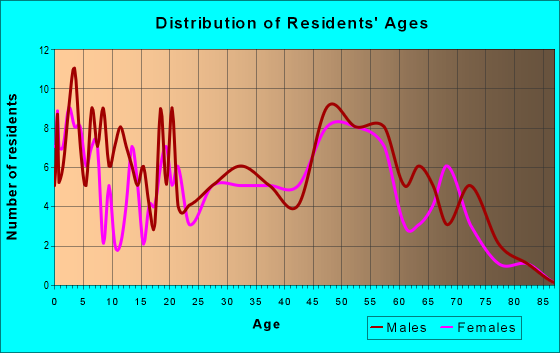
Males: 453
(49.4%)
Females: 464
(50.6%)
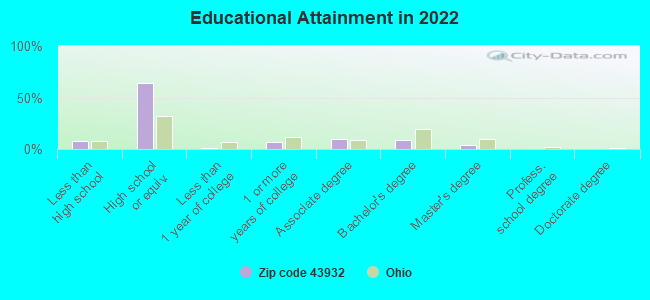
For population 25 years and over in 43932:
High school or higher: 90.6%
Bachelor's degree or higher: 11.9%
Graduate or professional degree: 3.7%
Unemployed: 4.9%
Mean travel time to work (commute): 28.0 minutes
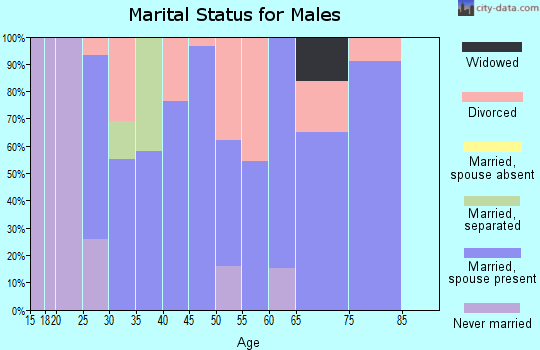
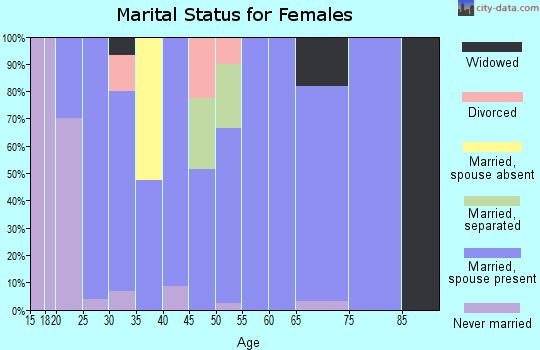
For population 15 years and over in 43932:
Never married: 36.7%
Now married: 45.8%
Separated: 0.9%
Widowed: 4.7%
Divorced: 11.9%
Zip code 43932 compared to state average:
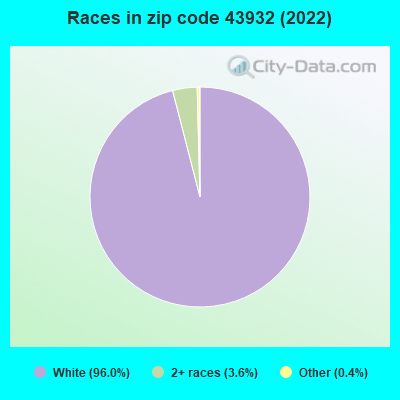
Black race population percentage significantly below state average.
Hispanic race population percentage significantly below state average.
Median age below state average.
Foreign-born population percentage significantly below state average.
Length of stay since moving in above state average.
Percentage of population with a bachelor's degree or higher significantly below state average.
Averages for the 2020 tax year for zip code 43932, filed in 2021:
Average Adjusted Gross Income (AGI) in 2020: $50,892 (Individual Income Tax Returns)
Here:
$50,892
State:
$67,288
Salary/wage: $43,580 (reported on 76.9% of returns)
Here:
$43,580
State:
$55,628
(% of AGI for various income ranges: 1027.8% for AGIs below $25k, 3638.8% for AGIs $25k-50k, 5173.3% for AGIs $50k-75k, 8560.0% for AGIs $75k-100k, 11886.7% for AGIs $100k-200k)
Taxable interest for individuals: $367 (reported on 15.4% of returns)
This zip code:
$367
Ohio:
$1,518
(% of AGI for various income ranges: 15.0% for AGIs $25k-50k, 33.3% for AGIs $75k-100k)
Ordinary dividends: $2,633 (reported on 7.7% of returns)
Here:
$2,633
State:
$7,167
(% of AGI for various income ranges: 131.7% for AGIs $50k-75k)
Net capital gain/loss in AGI: +$767 (reported on 7.7% of returns)
Here:
+$767
State:
+$18,919
(% of AGI for various income ranges: 28.7% for AGIs $25k-50k)
Profit/loss from business: +$8,225 (reported on 10.3% of returns)
Here:
+$8,225
State:
+$13,744
(% of AGI for various income ranges: 411.2% for AGIs $25k-50k)
Taxable individual retirement arrangement distribution: $11,467 (reported on 7.7% of returns)
43932:
$11,467
Ohio:
$18,876
(% of AGI for various income ranges: 382.2% for AGIs below $25k)
Earned income credit: $2,617 (reported on 15.4% of returns)
Here:
$2,617
State:
$2,304
(% of AGI for various income ranges: 102.2% for AGIs below $25k, 81.2% for AGIs $25k-50k)
Percentage of individuals using paid preparers for their 2020 taxes: 97.4%
Here:
97%
State:
94%
(% for various income ranges: 100.0% for AGIs below $25k, 90.9% for AGIs $25k-50k, 100.0% for AGIs $50k-75k, 100.0% for AGIs $75k-100k, 100.0% for AGIs $100k-200k)
Averages for the 2012 tax year for zip code 43932, filed in 2013:
Average Adjusted Gross Income (AGI) in 2012: $54,185 (Individual Income Tax Returns)
Here:
$54,185
State:
$54,926
Salary/wage: $38,435 (reported on 82.9% of returns)
Here:
$38,435
State:
$45,869
(% of AGI for various income ranges: 81.4% for AGIs below $25k, 82.3% for AGIs $25k-50k, 77.1% for AGIs $50k-75k, 71.6% for AGIs $75k-100k, 30.0% for AGIs $100k-200k)
Taxable interest for individuals: $800 (reported on 24.4% of returns)
This zip code:
$800
Ohio:
$1,297
(% of AGI for various income ranges: 0.6% for AGIs below $25k, 0.3% for AGIs $50k-75k, 0.7% for AGIs $100k-200k)
Ordinary dividends: $1,020 (reported on 12.2% of returns)
Here:
$1,020
State:
$5,821
(% of AGI for various income ranges: 0.3% for AGIs $25k-50k, 1.2% for AGIs $75k-100k)
Net capital gain/loss in AGI: +$2,150 (reported on 4.9% of returns)
Here:
+$2,150
State:
+$11,232
(% of AGI for various income ranges: 1.0% for AGIs $25k-50k)
Profit/loss from business: +$1,500 (reported on 9.8% of returns)
Here:
+$1,500
State:
+$12,773
(% of AGI for various income ranges: 1.3% for AGIs $25k-50k)
Total itemized deductions: $20,343 (16% of AGI, reported on 17.1% of returns)
Here:
$20,343
State:
$21,278
Here:
16.4% of AGI
State:
18.8% of AGI
(% of AGI for various income ranges: 14.7% for AGIs $25k-50k, 8.6% for AGIs $100k-200k)
Charity contributions: $2,233 (reported on 7.3% of returns)
Here:
$2,233
State:
$3,943
(% of AGI for various income ranges: 2.1% for AGIs $75k-100k)
Taxes paid: $9,117 (reported on 14.6% of returns)
43932:
$9,117
State:
$9,568
(% of AGI for various income ranges: 3.1% for AGIs $25k-50k, 4.6% for AGIs $100k-200k)
Earned income credit: $2,175 (reported on 19.5% of returns)
Here:
$2,175
State:
$2,285
(% of AGI for various income ranges: 5.9% for AGIs below $25k, 1.4% for AGIs $25k-50k)
Percentage of individuals using paid preparers for their 2012 taxes: 58.5%
Here:
59%
State:
51%
(% for various income ranges: 46.7% for AGIs below $25k, 58.3% for AGIs $25k-50k, 66.7% for AGIs $50k-75k, 75.0% for AGIs $75k-100k, 75.0% for AGIs $100k-200k)
Averages for the 2004 tax year for zip code 43932, filed in 2005:
Average Adjusted Gross Income (AGI) in 2004: $30,259 (Individual Income Tax Returns)
Here:
$30,259
State:
$44,480
Salary/wage: $27,218 (reported on 88.1% of returns)
Here:
$27,218
State:
$39,198
(% of AGI for various income ranges: 82.1% for AGIs below $10k, 79.4% for AGIs $10k-25k, 84.3% for AGIs $25k-50k, 80.2% for AGIs $50k-75k, 70.6% for AGIs $75k-100k)
Taxable interest for individuals: $800 (reported on 28.6% of returns)
This zip code:
$800
Ohio:
$1,532
(% of AGI for various income ranges: 0.7% for AGIs below $10k, 2.1% for AGIs $10k-25k, 0.7% for AGIs $25k-50k, 0.3% for AGIs $50k-75k, 0.2% for AGIs $75k-100k)
Taxable dividends: $439 (reported on 13.0% of returns)
Here:
$439
State:
$3,496
Net capital gain/loss: +$1,206 (reported on 7.8% of returns)
Here:
+$1,206
State:
+$8,582
Profit/loss from business: +$2,804 (reported on 11.7% of returns)
Here:
+$2,804
State:
+$10,813
(% of AGI for various income ranges: 5.1% for AGIs below $10k, 4.4% for AGIs $10k-25k, 0.0% for AGIs $25k-50k, 0.2% for AGIs $50k-75k)
Total itemized deductions: $13,774 (23% of AGI, reported on 12.1% of returns)
Here:
$13,774
State:
$17,503
Here:
22.8% of AGI
State:
20.8% of AGI
Charity contributions deductions: $969 (1% of AGI, reported on 7.3% of returns)
Here:
$969
State:
$3,087
Here:
1.5% of AGI
State:
3.4% of AGI
Total tax: $3,192 (reported on 70.5% of returns)
43932:
$3,192
State:
$6,781
(% of AGI for various income ranges: 2.0% for AGIs below $10k, 3.7% for AGIs $10k-25k, 5.9% for AGIs $25k-50k, 9.3% for AGIs $50k-75k, 11.4% for AGIs $75k-100k)
Earned income credit: $1,755 (reported on 22.4% of returns)
Here:
$1,755
State:
$1,696
Percentage of individuals using paid preparers for their 2004 taxes: 54.7%
Here:
55%
State:
55%
(% for various income ranges: 46.2% for AGIs below $10k, 58.5% for AGIs $10k-25k, 56.4% for AGIs $25k-50k, 61.0% for AGIs $50k-75k, 43.3% for AGIs $75k-100k)
Household received Food Stamps/SNAP in the past 12 months: 39 Household did not receive Food Stamps/SNAP in the past 12 months: 335
Women who had a birth in the past 12 months: 7 (8 now married, 0 unmarried) Women who did not have a birth in the past 12 months: 211 (74 now married, 137 unmarried)
Housing units in zip code 43932 with a mortgage: 146 (12 second mortgage, 12 both second mortgage and home equity loan) Houses without a mortgage: 51
Median monthly owner costs for units with a mortgage: $858 Median monthly owner costs for units without a mortgage: $413
Residents with income below the poverty level in 2022:
This zip code:
21.4%
Whole state:
13.4%
Residents with income below 50% of the poverty level in 2022:
This zip code:
8.5%
Whole state:
7.0%
Median number of rooms in houses and condos:
Here:
6.0
State:
6.7
Median number of rooms in apartments:
Here:
6.2
State:
4.4
Notable locations in this zip code not listed on our city pages
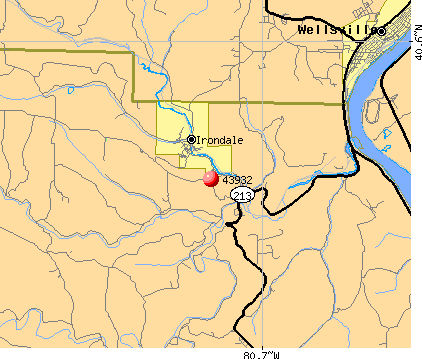
Streams, rivers, and creeks: Long Run (A), Ralston Run (B), Town Fork (C), Hildebrand Run (D), Keyhole Run (E), North Fork Yellow Creek (F). Display/hide their locations on the map
Size of family households: 121 2-persons, 87 3-persons, 30 4-persons, 13 5-persons
Size of nonfamily households: 82 1-person, 19 2-persons, 22 4-persons
97 married couples with children.
110 single-parent households (16 men, 94 women).
97.0% of residents of 43932 zip code speak English at home.
0.2% of residents speak Spanish at home (100% well).
2.5% of residents speak other Indo-European language at home (100% well).
Foreign born population: 0 (0.0%)
:
0.0%
Whole state:
5.0%
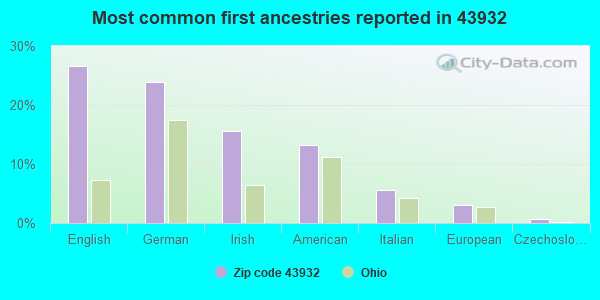
27%English
24%German
16%Irish
13%American
6%Italian
3%European
1%Czechoslovakian
Housing units lacking complete plumbing facilities: 3.6% Housing units lacking complete kitchen facilities: 4.2%
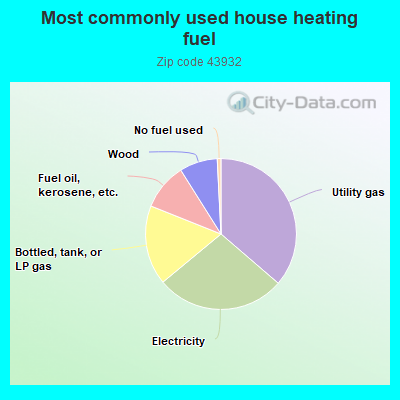
36.6%Utility gas
27.9%Electricity
17.2%Bottled, tank, or LP gas
10.1%Fuel oil, kerosene, etc.
8.2%Wood
0.8%No fuel used
Population in 1990: 496. Population change in the 1990s: +614 (+123.8%).
Place of birth for U.S.-born residents:
This state: 810
Northeast: 38
South: 64
West: 3
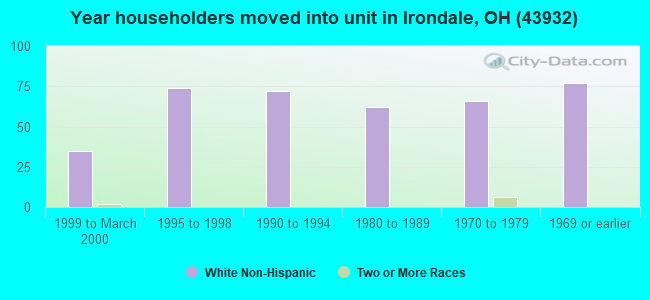
73% of the 43932 zip code residents lived in the same house 5 years ago. Out of people who lived in different houses, 58% lived in this county. Out of people who lived in different counties, 50% lived in Ohio.
96% of the 43932 zip code residents lived in the same house 1 year ago. Out of people who lived in different houses, 55% moved from this county. Out of people who lived in different houses, 55% moved from different county within same state.
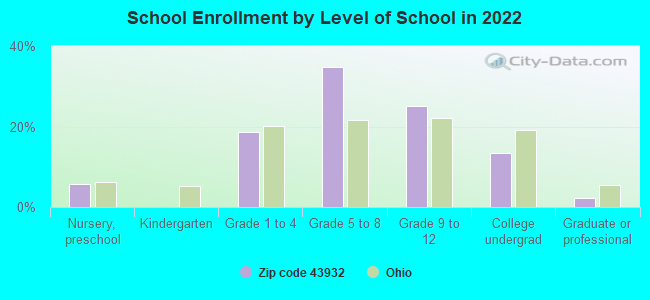
Private vs. public school enrollment:
Students in private schools in grades 1 to 8 (elementary and middle school): 4
Here:
4.6%
Ohio:
16.0%
Students in private schools in grades 9 to 12 (high school): 2
Here:
4.7%
Ohio:
13.1%
Students in private undergraduate colleges: 2
Here:
11.7%
Ohio:
22.3%
Occupation by median earnings in the past 12 months ($)
69,123Production occupations
60,427Construction and extraction occupations
57,025Management occupations
49,231Education, training, and library occupations
41,391Office and administrative support occupations
33,549Material moving occupations
Top industries in this zip code by the number of employees in 2005:
Wholesale Trade: Recyclable Material Merchant Wholesalers (5-9 employees: 1 establishment)
Construction: Site Preparation Contractors (1-4: 1)
Other Services (except Public Administration): Other Personal Care Services (1-4: 1)
Health Care and Social Assistance: Homes for the Elderly (1-4: 1)
Administrative and Support and Waste Management and Remediation Services: Other Waste Collection (1-4: 1)
Home Mortgage Disclosure Act Aggregated Statistics For Year 2009 (Based on 4 partial tracts)
A) FHA, FSA/RHS & VA Home Purchase Loans
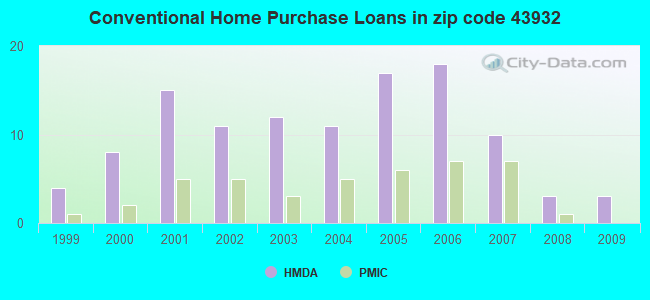
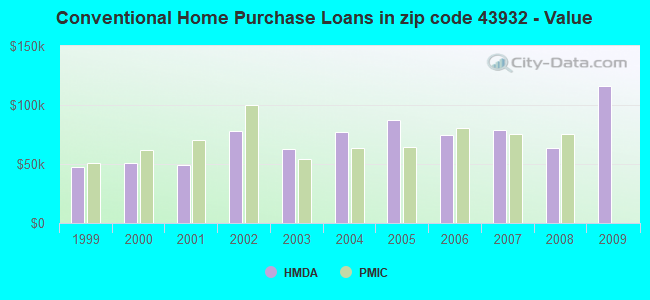
B) Conventional Home Purchase Loans
C) Refinancings
D) Home Improvement Loans
F) Non-occupant Loans on < 5 Family Dwellings (A B C & D)
G) Loans On Manufactured Home Dwelling (A B C & D)
Number
Average Value
Number
Average Value
Number
Average Value
Number
Average Value
Number
Average Value
Number
Average Value
LOANS ORIGINATED
4
$79,422
3
$115,893
21
$97,982
4
$33,978
1
$30,060
1
$73,430
APPLICATIONS APPROVED, NOT ACCEPTED
0
$0
0
$0
2
$67,200
1
$6,040
0
$0
0
$0
APPLICATIONS DENIED
1
$178,070
2
$117,105
16
$82,911
3
$33,807
1
$51,670
1
$64,760
APPLICATIONS WITHDRAWN
0
$0
0
$0
4
$111,035
1
$51,170
0
$0
0
$0
FILES CLOSED FOR INCOMPLETENESS
0
$0
0
$0
1
$131,800
0
$0
0
$0
1
$108,280
Aggregated Statistics For Year 2008 (Based on 4 partial tracts)
A) FHA, FSA/RHS & VA Home Purchase Loans
B) Conventional Home Purchase Loans
C) Refinancings
D) Home Improvement Loans
F) Non-occupant Loans on < 5 Family Dwellings (A B C & D)
G) Loans On Manufactured Home Dwelling (A B C & D)
Number
Average Value
Number
Average Value
Number
Average Value
Number
Average Value
Number
Average Value
Number
Average Value
LOANS ORIGINATED
6
$68,217
3
$63,587
20
$75,574
6
$47,352
1
$56,550
2
$52,800
APPLICATIONS APPROVED, NOT ACCEPTED
0
$0
2
$157,015
4
$74,790
1
$25,900
0
$0
2
$72,205
APPLICATIONS DENIED
1
$63,560
5
$56,752
17
$86,066
5
$47,330
1
$18,460
5
$62,974
APPLICATIONS WITHDRAWN
0
$0
0
$0
6
$64,735
0
$0
0
$0
0
$0
FILES CLOSED FOR INCOMPLETENESS
0
$0
1
$24,790
2
$80,890
0
$0
0
$0
0
$0
Aggregated Statistics For Year 2007 (Based on 4 partial tracts)
A) FHA, FSA/RHS & VA Home Purchase Loans
B) Conventional Home Purchase Loans
C) Refinancings
D) Home Improvement Loans
F) Non-occupant Loans on < 5 Family Dwellings (A B C & D)
G) Loans On Manufactured Home Dwelling (A B C & D)
Number
Average Value
Number
Average Value
Number
Average Value
Number
Average Value
Number
Average Value
Number
Average Value
LOANS ORIGINATED
4
$78,980
10
$78,635
20
$69,157
13
$46,926
1
$38,770
3
$86,690
APPLICATIONS APPROVED, NOT ACCEPTED
0
$0
1
$90,580
8
$65,781
2
$27,935
0
$0
1
$165,690
APPLICATIONS DENIED
1
$77,120
3
$74,003
21
$75,930
14
$41,933
0
$0
3
$94,703
APPLICATIONS WITHDRAWN
0
$0
1
$50,380
7
$77,344
2
$23,205
0
$0
1
$52,600
FILES CLOSED FOR INCOMPLETENESS
0
$0
0
$0
2
$125,975
0
$0
0
$0
0
$0
Aggregated Statistics For Year 2006 (Based on 4 partial tracts)
A) FHA, FSA/RHS & VA Home Purchase Loans
B) Conventional Home Purchase Loans
C) Refinancings
D) Home Improvement Loans
F) Non-occupant Loans on < 5 Family Dwellings (A B C & D)
G) Loans On Manufactured Home Dwelling (A B C & D)
Number
Average Value
Number
Average Value
Number
Average Value
Number
Average Value
Number
Average Value
Number
Average Value
LOANS ORIGINATED
2
$51,825
18
$74,862
32
$69,801
13
$29,212
1
$69,600
3
$48,060
APPLICATIONS APPROVED, NOT ACCEPTED
0
$0
4
$100,480
4
$67,798
2
$23,845
0
$0
1
$78,580
APPLICATIONS DENIED
0
$0
4
$43,878
30
$65,480
6
$35,833
1
$54,030
4
$64,152
APPLICATIONS WITHDRAWN
0
$0
1
$64,450
11
$66,360
1
$62,570
0
$0
0
$0
FILES CLOSED FOR INCOMPLETENESS
0
$0
0
$0
3
$71,423
0
$0
0
$0
0
$0
Aggregated Statistics For Year 2005 (Based on 4 partial tracts)
A) FHA, FSA/RHS & VA Home Purchase Loans
B) Conventional Home Purchase Loans
C) Refinancings
D) Home Improvement Loans
F) Non-occupant Loans on < 5 Family Dwellings (A B C & D)
G) Loans On Manufactured Home Dwelling (A B C & D)
Number
Average Value
Number
Average Value
Number
Average Value
Number
Average Value
Number
Average Value
Number
Average Value
LOANS ORIGINATED
1
$43,860
17
$87,187
43
$57,511
12
$26,763
2
$36,635
4
$53,342
APPLICATIONS APPROVED, NOT ACCEPTED
0
$0
2
$64,935
6
$81,078
1
$52,920
0
$0
0
$0
APPLICATIONS DENIED
2
$49,440
8
$46,675
31
$63,740
8
$22,509
0
$0
6
$48,705
APPLICATIONS WITHDRAWN
0
$0
3
$72,080
15
$86,341
0
$0
0
$0
0
$0
FILES CLOSED FOR INCOMPLETENESS
0
$0
1
$91,030
2
$154,435
0
$0
0
$0
0
$0
Aggregated Statistics For Year 2004 (Based on 4 partial tracts)
A) FHA, FSA/RHS & VA Home Purchase Loans
B) Conventional Home Purchase Loans
C) Refinancings
D) Home Improvement Loans
F) Non-occupant Loans on < 5 Family Dwellings (A B C & D)
G) Loans On Manufactured Home Dwelling (A B C & D)
Number
Average Value
Number
Average Value
Number
Average Value
Number
Average Value
Number
Average Value
Number
Average Value
LOANS ORIGINATED
2
$56,990
11
$76,852
37
$66,858
8
$31,570
1
$22,350
3
$48,290
APPLICATIONS APPROVED, NOT ACCEPTED
0
$0
2
$69,430
13
$63,461
1
$7,310
1
$37,780
2
$59,580
APPLICATIONS DENIED
1
$61,250
5
$49,422
31
$74,142
3
$35,317
1
$18,890
5
$54,262
APPLICATIONS WITHDRAWN
0
$0
2
$89,135
19
$80,187
1
$28,920
0
$0
1
$82,870
FILES CLOSED FOR INCOMPLETENESS
0
$0
0
$0
2
$66,420
1
$47,990
0
$0
0
$0
Aggregated Statistics For Year 2003 (Based on 4 partial tracts)
A) FHA, FSA/RHS & VA Home Purchase Loans
B) Conventional Home Purchase Loans
C) Refinancings
D) Home Improvement Loans
F) Non-occupant Loans on < 5 Family Dwellings (A B C & D)
Number
Average Value
Number
Average Value
Number
Average Value
Number
Average Value
Number
Average Value
LOANS ORIGINATED
1
$86,840
12
$62,752
56
$61,152
9
$23,957
2
$72,500
APPLICATIONS APPROVED, NOT ACCEPTED
0
$0
0
$0
7
$62,643
1
$34,960
0
$0
APPLICATIONS DENIED
1
$63,120
4
$46,302
28
$70,126
3
$6,543
1
$46,800
APPLICATIONS WITHDRAWN
0
$0
1
$65,490
15
$86,668
0
$0
0
$0
FILES CLOSED FOR INCOMPLETENESS
1
$41,950
0
$0
3
$96,373
0
$0
0
$0
Aggregated Statistics For Year 2002 (Based on 4 partial tracts)
A) FHA, FSA/RHS & VA Home Purchase Loans
B) Conventional Home Purchase Loans
C) Refinancings
D) Home Improvement Loans
F) Non-occupant Loans on < 5 Family Dwellings (A B C & D)
Number
Average Value
Number
Average Value
Number
Average Value
Number
Average Value
Number
Average Value
LOANS ORIGINATED
2
$67,340
11
$77,763
40
$63,320
11
$14,800
2
$36,965
APPLICATIONS APPROVED, NOT ACCEPTED
0
$0
2
$39,825
5
$58,470
1
$3,810
1
$20,310
APPLICATIONS DENIED
0
$0
5
$36,278
23
$68,107
7
$13,329
1
$44,660
APPLICATIONS WITHDRAWN
0
$0
1
$58,160
11
$72,053
2
$9,210
0
$0
FILES CLOSED FOR INCOMPLETENESS
0
$0
0
$0
4
$146,138
0
$0
0
$0
Aggregated Statistics For Year 2001 (Based on 4 partial tracts)
A) FHA, FSA/RHS & VA Home Purchase Loans
B) Conventional Home Purchase Loans
C) Refinancings
D) Home Improvement Loans
F) Non-occupant Loans on < 5 Family Dwellings (A B C & D)
Number
Average Value
Number
Average Value
Number
Average Value
Number
Average Value
Number
Average Value
LOANS ORIGINATED
2
$61,340
15
$49,101
43
$60,648
10
$12,515
2
$43,395
APPLICATIONS APPROVED, NOT ACCEPTED
1
$35,210
3
$67,340
5
$62,124
0
$0
0
$0
APPLICATIONS DENIED
0
$0
12
$34,409
24
$64,123
3
$12,873
1
$16,840
APPLICATIONS WITHDRAWN
0
$0
1
$57,890
17
$63,104
1
$32,100
0
$0
FILES CLOSED FOR INCOMPLETENESS
0
$0
0
$0
4
$63,945
0
$0
0
$0
Aggregated Statistics For Year 2000 (Based on 4 partial tracts)
A) FHA, FSA/RHS & VA Home Purchase Loans
B) Conventional Home Purchase Loans
C) Refinancings
D) Home Improvement Loans
F) Non-occupant Loans on < 5 Family Dwellings (A B C & D)
Number
Average Value
Number
Average Value
Number
Average Value
Number
Average Value
Number
Average Value
LOANS ORIGINATED
1
$67,370
8
$50,445
16
$64,356
8
$24,532
2
$17,905
APPLICATIONS APPROVED, NOT ACCEPTED
0
$0
3
$35,977
5
$39,648
0
$0
0
$0
APPLICATIONS DENIED
1
$61,970
10
$40,302
15
$59,936
8
$14,361
1
$16,150
APPLICATIONS WITHDRAWN
0
$0
1
$47,030
7
$66,013
0
$0
0
$0
FILES CLOSED FOR INCOMPLETENESS
0
$0
0
$0
1
$22,330
0
$0
0
$0
Aggregated Statistics For Year 1999 (Based on 2 partial tracts)
Detailed PMIC statistics for the following Tracts:0110.00
, 0111.00
2002 - 2018 National Fire Incident Reporting System (NFIRS) incidents
According to the data from the years 2002 - 2018 the average number of fire incidents per year is 10. The highest number of reported fires - 18 took place in 2016, and the least - 1 in 2004. The data has a rising trend.
When looking into fire subcategories, the most incidents belonged to: Outside Fires (41.4%), and Structure Fires (30.8%).
Fire incident types reported to NFIRS in Zip Code 43932
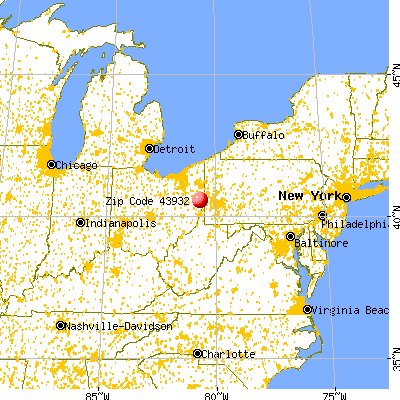


 Nearest zip codes: 43930, 43944, 43964, 43908, 43925, 43961.


 According to the data from the years 2002 - 2018 the average number of fire incidents per year is 10. The highest number of reported fires - 18 took place in 2016, and the least - 1 in 2004. The data has a rising trend.
 When looking into fire subcategories, the most incidents belonged to: Outside Fires (41.4%), and Structure Fires (30.8%).