Estimated zip code population in 2022: 2,845 Zip code population in 2010: 3,136 Zip code population in 2000: 3,219
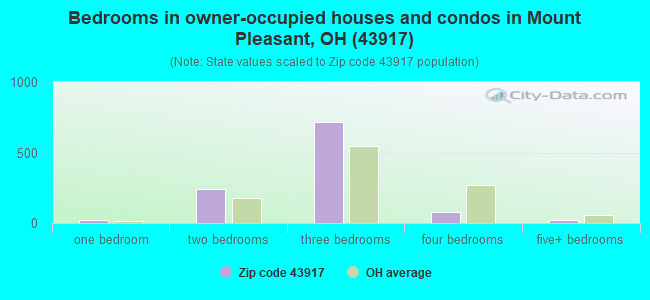
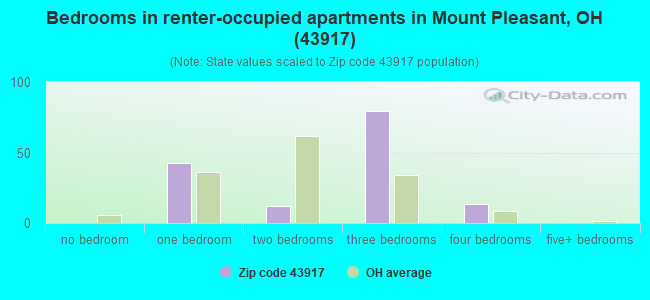
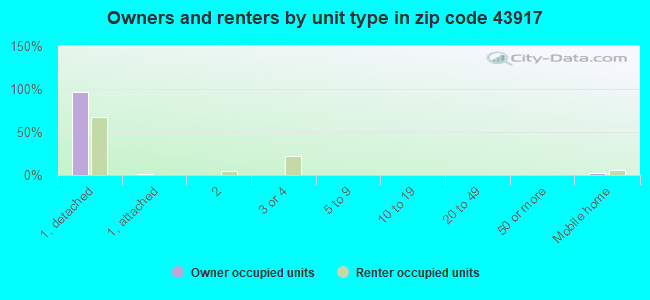
Houses and condos: 1,342 Renter-occupied apartments: 148
% of renters here:
12%
State:
33%
March 2022 cost of living index in zip code 43917: 82.3 (low, U.S. average is 100)
Land area: 35.5 sq. mi. Water area: 0.1 sq. mi.
Population density: 80 people per square mile
(very low).
OSM Map
General Map
Google Map
MSN Map
OSM Map
General Map
Google Map
MSN Map
OSM Map
General Map
Google Map
MSN Map
OSM Map
General Map
Google Map
MSN Map
Please wait while loading the map...
Real estate property taxes paid for housing units in 2022:
This zip code:
0.9% ($1,102)
Ohio:
1.3% ($2,639)
Median real estate property taxes paid for housing units with mortgages in 2022: $1,336 (1.0%) Median real estate property taxes paid for housing units with no mortgage in 2022: $990 (0.9%)
Business Search- 14 Million verified businesses
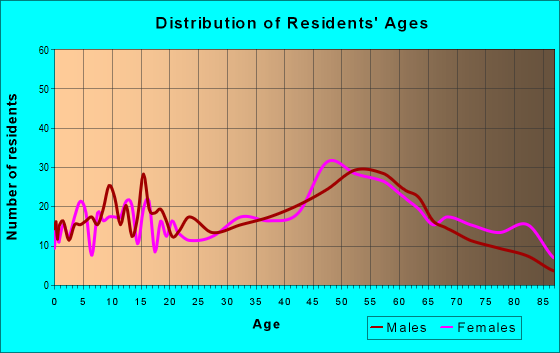
Males: 1,351
(47.5%)
Females: 1,493
(52.5%)
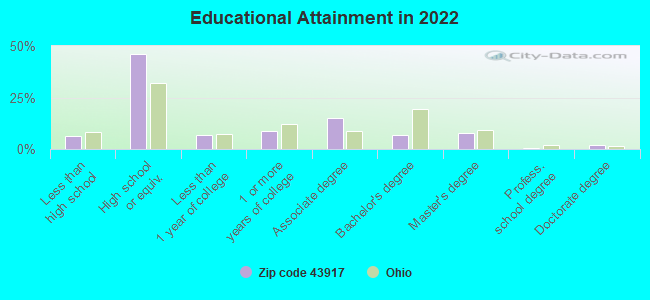
For population 25 years and over in 43917:
High school or higher: 93.0%
Bachelor's degree or higher: 17.0%
Graduate or professional degree: 10.4%
Unemployed: 2.9%
Mean travel time to work (commute): 29.4 minutes
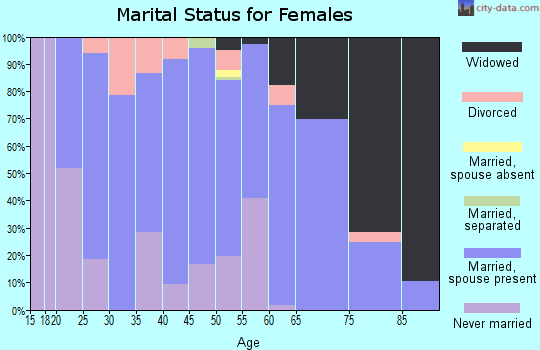
For population 15 years and over in 43917:
Never married: 24.8%
Now married: 47.9%
Separated: 1.2%
Widowed: 10.8%
Divorced: 15.4%
Zip code 43917 compared to state average:
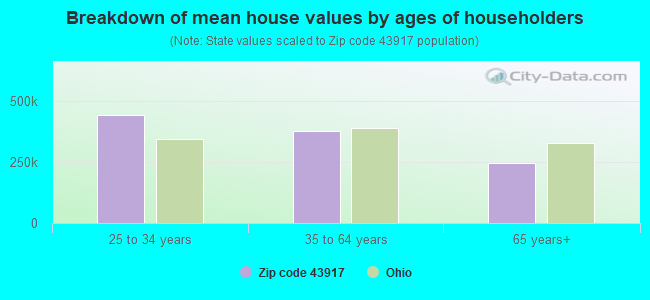
Median house value below state average.
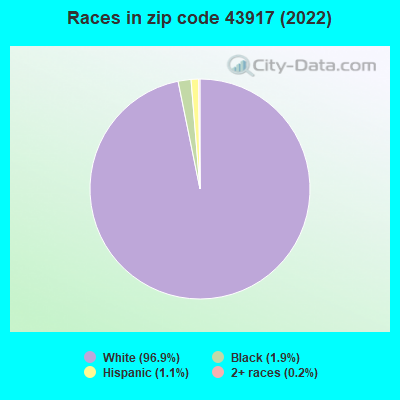
Black race population percentage significantly below state average.
Hispanic race population percentage significantly below state average.
Median age significantly above state average.
Foreign-born population percentage significantly below state average.
Renting percentage significantly below state average.
Length of stay since moving in significantly above state average.
Number of college students significantly below state average.
Percentage of population with a bachelor's degree or higher below state average.
Averages for the 2020 tax year for zip code 43917, filed in 2021:
Average Adjusted Gross Income (AGI) in 2020: $54,291 (Individual Income Tax Returns)
Here:
$54,291
State:
$67,288
Salary/wage: $44,511 (reported on 77.5% of returns)
Here:
$44,511
State:
$55,628
(% of AGI for various income ranges: 1060.3% for AGIs below $25k, 3112.2% for AGIs $25k-50k, 6185.0% for AGIs $50k-75k, 8666.0% for AGIs $75k-100k, 11815.0% for AGIs $100k-200k)
Taxable interest for individuals: $1,219 (reported on 27.9% of returns)
This zip code:
$1,219
Ohio:
$1,518
(% of AGI for various income ranges: 12.4% for AGIs below $25k, 19.3% for AGIs $25k-50k, 19.3% for AGIs $50k-75k, 31.0% for AGIs $75k-100k, 230.0% for AGIs $100k-200k)
Ordinary dividends: $2,911 (reported on 14.7% of returns)
Here:
$2,911
State:
$7,167
(% of AGI for various income ranges: 8.8% for AGIs below $25k, 33.7% for AGIs $25k-50k, 10.7% for AGIs $50k-75k, 63.0% for AGIs $75k-100k, 161.0% for AGIs $100k-200k)
Net capital gain/loss in AGI: +$7,350 (reported on 10.9% of returns)
Here:
+$7,350
State:
+$18,919
(% of AGI for various income ranges: 30.4% for AGIs $25k-50k, 459.0% for AGIs $100k-200k)
Profit/loss from business: +$3,369 (reported on 10.1% of returns)
Here:
+$3,369
State:
+$13,744
(% of AGI for various income ranges: 68.2% for AGIs below $25k, 28.5% for AGIs $25k-50k, 12.9% for AGIs $50k-75k, 118.0% for AGIs $100k-200k)
Taxable individual retirement arrangement distribution: $11,846 (reported on 10.1% of returns)
43917:
$11,846
Ohio:
$18,876
(% of AGI for various income ranges: 42.4% for AGIs below $25k, 77.4% for AGIs $25k-50k, 405.7% for AGIs $50k-75k, 623.0% for AGIs $100k-200k)
Earned income credit: $2,095 (reported on 15.5% of returns)
Here:
$2,095
State:
$2,304
(% of AGI for various income ranges: 81.2% for AGIs below $25k, 55.9% for AGIs $25k-50k)
Percentage of individuals using paid preparers for their 2020 taxes: 95.3%
Here:
95%
State:
94%
(% for various income ranges: 93.3% for AGIs below $25k, 94.1% for AGIs $25k-50k, 94.7% for AGIs $50k-75k, 100.0% for AGIs $75k-100k, 100.0% for AGIs $100k-200k, 100.0% for AGIs over 200k)
Averages for the 2012 tax year for zip code 43917, filed in 2013:
Average Adjusted Gross Income (AGI) in 2012: $48,315 (Individual Income Tax Returns)
Here:
$48,315
State:
$54,926
Salary/wage: $37,806 (reported on 80.9% of returns)
Here:
$37,806
State:
$45,869
(% of AGI for various income ranges: 72.1% for AGIs below $25k, 71.8% for AGIs $25k-50k, 72.0% for AGIs $50k-75k, 74.3% for AGIs $75k-100k, 46.1% for AGIs $100k-200k)
Taxable interest for individuals: $951 (reported on 31.3% of returns)
This zip code:
$951
Ohio:
$1,297
(% of AGI for various income ranges: 1.9% for AGIs below $25k, 0.9% for AGIs $25k-50k, 0.5% for AGIs $50k-75k, 0.3% for AGIs $75k-100k, 0.3% for AGIs $100k-200k)
Ordinary dividends: $1,536 (reported on 16.8% of returns)
Here:
$1,536
State:
$5,821
(% of AGI for various income ranges: 1.2% for AGIs below $25k, 0.6% for AGIs $25k-50k, 0.3% for AGIs $50k-75k, 0.3% for AGIs $75k-100k, 0.6% for AGIs $100k-200k)
Net capital gain/loss in AGI: +$608 (reported on 9.2% of returns)
Here:
+$608
State:
+$11,232
(% of AGI for various income ranges: 0.6% for AGIs $25k-50k)
Profit/loss from business: +$5,415 (reported on 9.9% of returns)
Here:
+$5,415
State:
+$12,773
(% of AGI for various income ranges: 2.3% for AGIs below $25k, 1.4% for AGIs $50k-75k, 1.7% for AGIs $100k-200k)
Taxable individual retirement arrangement distribution: $9,677 (reported on 9.9% of returns)
43917:
$9,677
Ohio:
$14,511
(% of AGI for various income ranges: 2.1% for AGIs below $25k, 1.9% for AGIs $25k-50k, 2.6% for AGIs $50k-75k, 5.6% for AGIs $75k-100k)
Total itemized deductions: $16,153 (16% of AGI, reported on 13.0% of returns)
Here:
$16,153
State:
$21,278
Here:
16.0% of AGI
State:
18.8% of AGI
(% of AGI for various income ranges: 5.1% for AGIs $25k-50k, 5.0% for AGIs $50k-75k, 3.6% for AGIs $75k-100k, 5.3% for AGIs $100k-200k)
Charity contributions: $2,550 (reported on 7.6% of returns)
Here:
$2,550
State:
$3,943
(% of AGI for various income ranges: 0.4% for AGIs $25k-50k, 0.4% for AGIs $50k-75k, 0.7% for AGIs $100k-200k)
Taxes paid: $5,847 (reported on 13.0% of returns)
43917:
$5,847
State:
$9,568
(% of AGI for various income ranges: 0.8% for AGIs $25k-50k, 1.1% for AGIs $50k-75k, 1.3% for AGIs $75k-100k, 2.8% for AGIs $100k-200k)
Earned income credit: $2,196 (reported on 19.1% of returns)
Here:
$2,196
State:
$2,285
(% of AGI for various income ranges: 6.0% for AGIs below $25k, 1.3% for AGIs $25k-50k)
Percentage of individuals using paid preparers for their 2012 taxes: 52.7%
Here:
53%
State:
51%
(% for various income ranges: 46.3% for AGIs below $25k, 53.1% for AGIs $25k-50k, 52.4% for AGIs $50k-75k, 66.7% for AGIs $75k-100k, 66.7% for AGIs $100k-200k)
Averages for the 2004 tax year for zip code 43917, filed in 2005:
Average Adjusted Gross Income (AGI) in 2004: $32,376 (Individual Income Tax Returns)
Here:
$32,376
State:
$44,480
Salary/wage: $30,930 (reported on 82.7% of returns)
Here:
$30,930
State:
$39,198
(% of AGI for various income ranges: 79.0% for AGIs below $10k, 68.5% for AGIs $10k-25k, 79.4% for AGIs $25k-50k, 84.1% for AGIs $50k-75k, 86.3% for AGIs $75k-100k, 69.3% for AGIs over 100k)
Taxable interest for individuals: $1,082 (reported on 44.0% of returns)
This zip code:
$1,082
Ohio:
$1,532
(% of AGI for various income ranges: 5.3% for AGIs below $10k, 3.5% for AGIs $10k-25k, 1.1% for AGIs $25k-50k, 1.1% for AGIs $50k-75k, 0.6% for AGIs $75k-100k, 0.2% for AGIs over 100k)
Taxable dividends: $940 (reported on 20.1% of returns)
Here:
$940
State:
$3,496
(% of AGI for various income ranges: 2.8% for AGIs below $10k, 0.9% for AGIs $10k-25k, 0.7% for AGIs $25k-50k, 0.3% for AGIs $50k-75k, 0.2% for AGIs $75k-100k, 0.4% for AGIs over 100k)
Net capital gain/loss: +$171 (reported on 13.6% of returns)
Here:
+$171
State:
+$8,582
(% of AGI for various income ranges: -0.8% for AGIs below $10k, -0.1% for AGIs $10k-25k, -0.0% for AGIs $25k-50k, 0.1% for AGIs $50k-75k, 0.7% for AGIs $75k-100k)
Profit/loss from business: +$5,957 (reported on 9.4% of returns)
Here:
+$5,957
State:
+$10,813
(% of AGI for various income ranges: 2.1% for AGIs below $10k, 3.0% for AGIs $10k-25k, 2.2% for AGIs $25k-50k, 1.9% for AGIs $50k-75k, -0.2% for AGIs $75k-100k)
IRA payment deduction: $1,526 (reported on 1.5% of returns)
43917:
$1,526
Ohio:
$2,794
Total itemized deductions: $15,490 (28% of AGI, reported on 11.6% of returns)
Here:
$15,490
State:
$17,503
Here:
28.4% of AGI
State:
20.8% of AGI
(% of AGI for various income ranges: 7.9% for AGIs $10k-25k, 6.1% for AGIs $25k-50k, 3.6% for AGIs $50k-75k, 3.8% for AGIs $75k-100k, 10.4% for AGIs over 100k)
Charity contributions deductions: $1,302 (2% of AGI, reported on 8.5% of returns)
Here:
$1,302
State:
$3,087
Here:
2.1% of AGI
State:
3.4% of AGI
(% of AGI for various income ranges: 0.2% for AGIs $10k-25k, 0.2% for AGIs $25k-50k, 0.4% for AGIs $50k-75k, 0.3% for AGIs $75k-100k, 1.1% for AGIs over 100k)
Total tax: $3,721 (reported on 72.8% of returns)
43917:
$3,721
State:
$6,781
(% of AGI for various income ranges: 1.4% for AGIs below $10k, 3.6% for AGIs $10k-25k, 7.0% for AGIs $25k-50k, 9.1% for AGIs $50k-75k, 11.4% for AGIs $75k-100k, 17.2% for AGIs over 100k)
Earned income credit: $1,678 (reported on 16.4% of returns)
Here:
$1,678
State:
$1,696
Percentage of individuals using paid preparers for their 2004 taxes: 59.8%
Here:
60%
State:
55%
(% for various income ranges: 54.9% for AGIs below $10k, 55.9% for AGIs $10k-25k, 67.8% for AGIs $25k-50k, 58.4% for AGIs $50k-75k, 56.9% for AGIs $75k-100k, 78.3% for AGIs over 100k)
Notable locations in zip code 43917: Dillonvale Emergency Medical Services (A), Dillonvale Volunteer Fire Department (B). Display/hide their locations on the map
Streams, rivers, and creeks: Long Run (A), Jug Run (B), Perrin Run (C), Cabbage Run (D), Dry Fork (E), Henderson Run (F). Display/hide their locations on the map
Size of family households: 395 2-persons, 267 3-persons, 126 4-persons, 16 6-persons
Size of nonfamily households: 364 1-person, 32 2-persons, 16 3-persons
196 married couples with children.
198 single-parent households (131 men, 67 women).
99.9% of residents of 43917 zip code speak English at home.
0.1% of residents speak Spanish at home (100% very well).
0.1% of residents speak other Indo-European language at home (100% very well).
Foreign born population: 2 (0.1%) (0.0% of them are naturalized citizens)
:
0.1%
Whole state:
5.0%
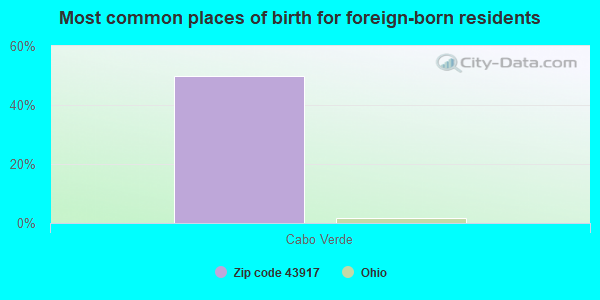
50%Cabo Verde
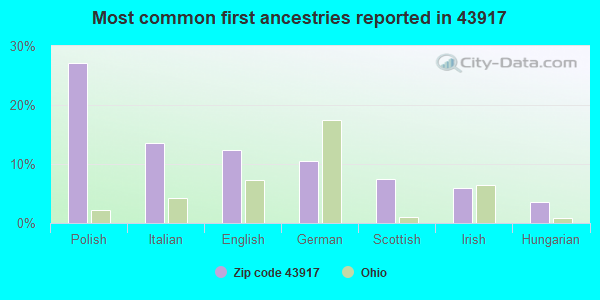
27%Polish
14%Italian
12%English
10%German
7%Scottish
6%Irish
4%Hungarian
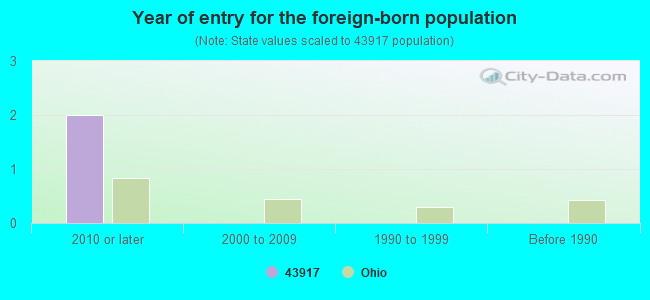
Year of entry for the foreign-born population
22010 or later
02000 to 2009
01990 to 1999
0Before 1990
Facilities with environmental interests located in this zip code:
BARNEY SNYDER OF OHIO INC (PO BOX 668, FAIR AND WATSON in DILLONVALE, OH)
COMPLIANCE ACTIVITY (Tracking inspections of insecticide, fungicide, and rodenticide, and toxic substances)
Housing units lacking complete plumbing facilities: 2.8% Housing units lacking complete kitchen facilities: 2.8%
42.9%Fuel oil, kerosene, etc.
35.8%Electricity
14.0%Bottled, tank, or LP gas
4.5%Wood
2.8%Utility gas
Population in 1990: 5,972.
Place of birth for U.S.-born residents:
This state: 1,771
Northeast: 64
Midwest: 4
South: 963
West: 14
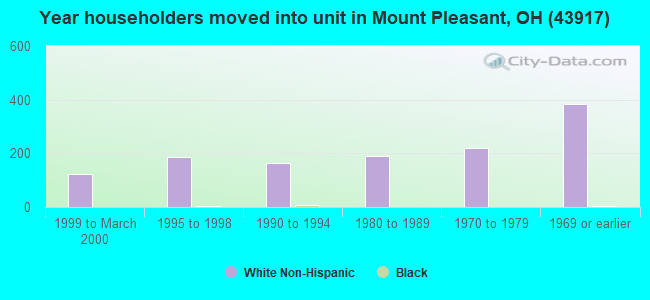
75% of the 43917 zip code residents lived in the same house 5 years ago. Out of people who lived in different houses, 66% lived in this county. Out of people who lived in different counties, 50% lived in Ohio.
98% of the 43917 zip code residents lived in the same house 1 year ago. Out of people who lived in different houses, 81% moved from this county. Out of people who lived in different houses, 35% moved from different county within same state. Out of people who lived in different houses, 9% moved from different state.
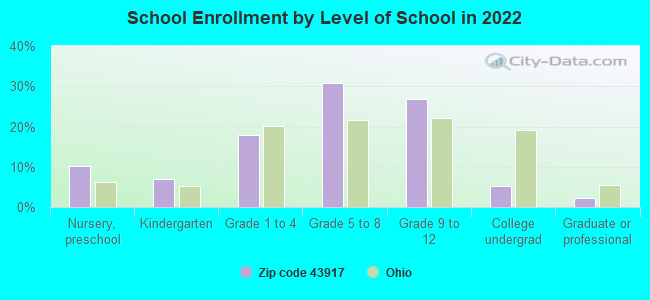
Private vs. public school enrollment:
Students in private schools in grades 1 to 8 (elementary and middle school): 42
Here:
18.2%
Ohio:
16.0%
Students in private schools in grades 9 to 12 (high school):
Here:
0.0%
Ohio:
13.1%
Students in private undergraduate colleges: 1
Here:
7.5%
Ohio:
22.3%
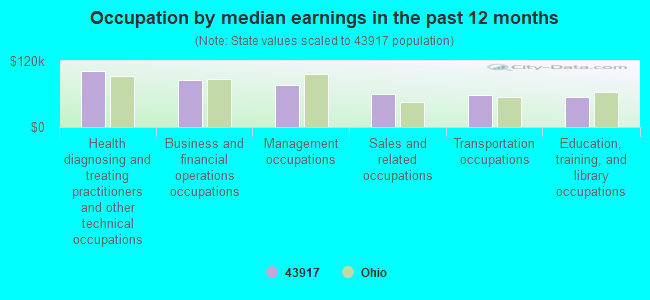
Occupation by median earnings in the past 12 months ($)
101,756Health diagnosing and treating practitioners and other technical occupations
85,924Business and financial operations occupations
76,298Management occupations
60,459Sales and related occupations
58,481Transportation occupations
54,758Education, training, and library occupations
Top industries in this zip code by the number of employees in 2005:
Construction: Commercial and Institutional Building Construction (50-99 employees: 1 establishment)
Health Care and Social Assistance: Residential Mental Retardation Facilities (10-19: 1)
Wholesale Trade: Other Grocery and Related Products Merchant Wholesalers (10-19: 1)
Other Services (except Public Administration): Religious Organizations (5-9: 1, 1-4: 2)
Accommodation and Food Services: Full-Service Restaurants (5-9: 1)
Finance and Insurance: Commercial Banking (5-9: 1)
Other Services (except Public Administration): Labor Unions and Similar Labor Organizations (5-9: 1)
Health Care and Social Assistance: Offices of Dentists (5-9: 1)
People in group quarters in 2010:
9 people in group homes intended for adults
Fatal accident statistics in 2012:
Fatal accident count: 1
Vehicles involved in fatal accidents: 3
Fatal accidents caused by drunken drivers: 0
Fatalities: 1
Persons involved in fatal accidents: 7
Pedestrians involved in fatal accidents: 0
Fatal accident statistics in 2011:
Fatal accident count: 1
Vehicles involved in fatal accidents: 1
Fatal accidents caused by drunken drivers: 0
Fatalities: 1
Persons involved in fatal accidents: 4
Pedestrians involved in fatal accidents: 0
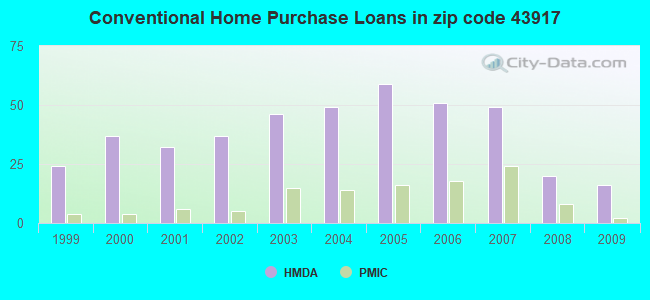
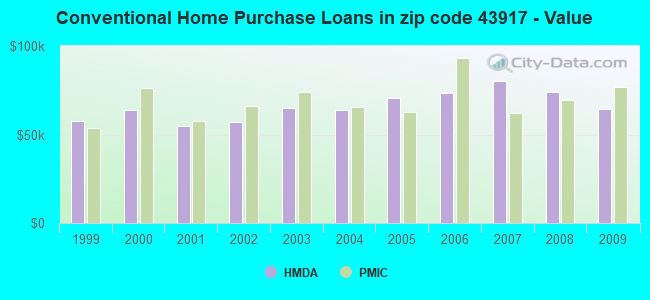
Home Mortgage Disclosure Act Aggregated Statistics For Year 2009 (Based on 6 partial tracts)
A) FHA, FSA/RHS & VA Home Purchase Loans
B) Conventional Home Purchase Loans
C) Refinancings
D) Home Improvement Loans
F) Non-occupant Loans on < 5 Family Dwellings (A B C & D)
G) Loans On Manufactured Home Dwelling (A B C & D)
Number
Average Value
Number
Average Value
Number
Average Value
Number
Average Value
Number
Average Value
Number
Average Value
LOANS ORIGINATED
13
$64,487
16
$64,151
61
$91,291
13
$39,945
3
$59,320
5
$49,772
APPLICATIONS APPROVED, NOT ACCEPTED
0
$0
0
$0
1
$130,010
3
$37,587
0
$0
0
$0
APPLICATIONS DENIED
0
$0
3
$49,773
41
$82,324
10
$17,201
3
$47,233
3
$53,900
APPLICATIONS WITHDRAWN
0
$0
3
$93,207
10
$131,768
0
$0
1
$22,650
0
$0
FILES CLOSED FOR INCOMPLETENESS
0
$0
0
$0
3
$108,240
0
$0
0
$0
0
$0
Aggregated Statistics For Year 2008 (Based on 6 partial tracts)
A) FHA, FSA/RHS & VA Home Purchase Loans
B) Conventional Home Purchase Loans
C) Refinancings
D) Home Improvement Loans
F) Non-occupant Loans on < 5 Family Dwellings (A B C & D)
G) Loans On Manufactured Home Dwelling (A B C & D)
Number
Average Value
Number
Average Value
Number
Average Value
Number
Average Value
Number
Average Value
Number
Average Value
LOANS ORIGINATED
20
$65,001
20
$73,806
47
$72,053
13
$34,881
3
$47,050
3
$72,673
APPLICATIONS APPROVED, NOT ACCEPTED
0
$0
4
$59,750
13
$60,102
2
$50,480
1
$28,970
0
$0
APPLICATIONS DENIED
3
$44,520
8
$94,925
70
$84,753
19
$26,074
2
$26,460
2
$50,095
APPLICATIONS WITHDRAWN
4
$76,148
2
$108,060
13
$77,984
5
$44,792
0
$0
0
$0
FILES CLOSED FOR INCOMPLETENESS
2
$61,765
2
$67,110
5
$68,466
0
$0
0
$0
0
$0
Aggregated Statistics For Year 2007 (Based on 6 partial tracts)
A) FHA, FSA/RHS & VA Home Purchase Loans
B) Conventional Home Purchase Loans
C) Refinancings
D) Home Improvement Loans
F) Non-occupant Loans on < 5 Family Dwellings (A B C & D)
G) Loans On Manufactured Home Dwelling (A B C & D)
Number
Average Value
Number
Average Value
Number
Average Value
Number
Average Value
Number
Average Value
Number
Average Value
LOANS ORIGINATED
15
$58,856
49
$80,094
66
$80,320
35
$23,748
8
$37,354
10
$64,728
APPLICATIONS APPROVED, NOT ACCEPTED
0
$0
5
$45,838
14
$93,898
2
$33,150
0
$0
3
$45,243
APPLICATIONS DENIED
9
$61,076
18
$63,786
71
$75,759
30
$33,031
7
$39,153
11
$65,020
APPLICATIONS WITHDRAWN
1
$81,860
6
$52,172
22
$104,201
6
$77,062
1
$61,030
0
$0
FILES CLOSED FOR INCOMPLETENESS
1
$27,290
6
$60,562
7
$138,603
0
$0
1
$46,600
0
$0
Aggregated Statistics For Year 2006 (Based on 6 partial tracts)
A) FHA, FSA/RHS & VA Home Purchase Loans
B) Conventional Home Purchase Loans
C) Refinancings
D) Home Improvement Loans
F) Non-occupant Loans on < 5 Family Dwellings (A B C & D)
G) Loans On Manufactured Home Dwelling (A B C & D)
Number
Average Value
Number
Average Value
Number
Average Value
Number
Average Value
Number
Average Value
Number
Average Value
LOANS ORIGINATED
11
$74,836
51
$73,319
75
$68,633
41
$22,180
9
$44,644
6
$76,095
APPLICATIONS APPROVED, NOT ACCEPTED
0
$0
4
$94,870
21
$59,637
4
$31,172
0
$0
1
$39,950
APPLICATIONS DENIED
5
$61,818
19
$76,975
68
$69,321
33
$34,547
2
$59,000
8
$70,670
APPLICATIONS WITHDRAWN
0
$0
6
$127,777
29
$71,683
4
$30,782
0
$0
1
$69,090
FILES CLOSED FOR INCOMPLETENESS
0
$0
2
$41,945
6
$98,717
1
$24,460
0
$0
0
$0
Aggregated Statistics For Year 2005 (Based on 6 partial tracts)
A) FHA, FSA/RHS & VA Home Purchase Loans
B) Conventional Home Purchase Loans
C) Refinancings
D) Home Improvement Loans
E) Loans on Dwellings For 5+ Families
F) Non-occupant Loans on < 5 Family Dwellings (A B C & D)
G) Loans On Manufactured Home Dwelling (A B C & D)
Number
Average Value
Number
Average Value
Number
Average Value
Number
Average Value
Number
Average Value
Number
Average Value
Number
Average Value
LOANS ORIGINATED
15
$62,671
59
$70,753
77
$71,554
34
$30,812
1
$94,320
12
$60,907
4
$53,898
APPLICATIONS APPROVED, NOT ACCEPTED
2
$69,350
7
$68,429
15
$60,963
3
$36,340
0
$0
0
$0
0
$0
APPLICATIONS DENIED
4
$67,815
16
$44,971
85
$71,578
32
$29,399
0
$0
3
$25,670
8
$40,688
APPLICATIONS WITHDRAWN
0
$0
7
$85,944
30
$76,662
8
$69,674
0
$0
1
$35,300
0
$0
FILES CLOSED FOR INCOMPLETENESS
2
$53,260
1
$59,920
5
$80,108
1
$22,190
0
$0
0
$0
0
$0
Aggregated Statistics For Year 2004 (Based on 6 partial tracts)
A) FHA, FSA/RHS & VA Home Purchase Loans
B) Conventional Home Purchase Loans
C) Refinancings
D) Home Improvement Loans
F) Non-occupant Loans on < 5 Family Dwellings (A B C & D)
G) Loans On Manufactured Home Dwelling (A B C & D)
Number
Average Value
Number
Average Value
Number
Average Value
Number
Average Value
Number
Average Value
Number
Average Value
LOANS ORIGINATED
15
$60,516
49
$63,898
99
$65,459
33
$21,240
9
$29,258
4
$50,725
APPLICATIONS APPROVED, NOT ACCEPTED
1
$65,490
5
$36,890
26
$82,068
4
$28,632
2
$16,390
1
$35,880
APPLICATIONS DENIED
4
$54,608
27
$54,176
118
$83,575
29
$28,673
3
$23,243
11
$57,856
APPLICATIONS WITHDRAWN
2
$32,180
6
$73,933
49
$80,441
3
$37,743
0
$0
1
$77,900
FILES CLOSED FOR INCOMPLETENESS
3
$52,150
4
$47,902
11
$69,520
0
$0
0
$0
0
$0
Aggregated Statistics For Year 2003 (Based on 6 partial tracts)
A) FHA, FSA/RHS & VA Home Purchase Loans
B) Conventional Home Purchase Loans
C) Refinancings
D) Home Improvement Loans
F) Non-occupant Loans on < 5 Family Dwellings (A B C & D)
Number
Average Value
Number
Average Value
Number
Average Value
Number
Average Value
Number
Average Value
LOANS ORIGINATED
18
$62,897
46
$65,226
156
$64,831
25
$25,908
6
$20,383
APPLICATIONS APPROVED, NOT ACCEPTED
0
$0
5
$49,556
17
$59,964
2
$17,005
0
$0
APPLICATIONS DENIED
2
$46,020
19
$52,338
89
$58,146
19
$14,640
6
$33,437
APPLICATIONS WITHDRAWN
0
$0
5
$125,366
41
$80,539
0
$0
1
$21,330
FILES CLOSED FOR INCOMPLETENESS
4
$52,225
0
$0
8
$82,598
2
$48,105
0
$0
Aggregated Statistics For Year 2002 (Based on 6 partial tracts)
A) FHA, FSA/RHS & VA Home Purchase Loans
B) Conventional Home Purchase Loans
C) Refinancings
D) Home Improvement Loans
F) Non-occupant Loans on < 5 Family Dwellings (A B C & D)
Number
Average Value
Number
Average Value
Number
Average Value
Number
Average Value
Number
Average Value
LOANS ORIGINATED
8
$52,692
37
$57,239
103
$63,300
31
$14,371
6
$36,370
APPLICATIONS APPROVED, NOT ACCEPTED
0
$0
8
$52,091
19
$51,734
5
$8,390
0
$0
APPLICATIONS DENIED
0
$0
16
$33,471
53
$54,445
20
$21,564
3
$9,013
APPLICATIONS WITHDRAWN
0
$0
3
$40,223
29
$62,698
4
$11,670
1
$31,070
FILES CLOSED FOR INCOMPLETENESS
2
$55,715
2
$12,895
13
$66,690
0
$0
0
$0
Aggregated Statistics For Year 2001 (Based on 6 partial tracts)
A) FHA, FSA/RHS & VA Home Purchase Loans
B) Conventional Home Purchase Loans
C) Refinancings
D) Home Improvement Loans
F) Non-occupant Loans on < 5 Family Dwellings (A B C & D)
Number
Average Value
Number
Average Value
Number
Average Value
Number
Average Value
Number
Average Value
LOANS ORIGINATED
4
$54,815
32
$54,520
110
$61,580
20
$17,656
5
$17,898
APPLICATIONS APPROVED, NOT ACCEPTED
0
$0
4
$52,960
15
$49,800
6
$15,195
0
$0
APPLICATIONS DENIED
0
$0
15
$31,403
57
$54,310
17
$12,995
3
$36,240
APPLICATIONS WITHDRAWN
0
$0
3
$86,720
37
$58,014
6
$16,765
1
$27,290
FILES CLOSED FOR INCOMPLETENESS
0
$0
0
$0
6
$54,757
1
$13,320
0
$0
Aggregated Statistics For Year 2000 (Based on 6 partial tracts)
A) FHA, FSA/RHS & VA Home Purchase Loans
B) Conventional Home Purchase Loans
C) Refinancings
D) Home Improvement Loans
F) Non-occupant Loans on < 5 Family Dwellings (A B C & D)
Number
Average Value
Number
Average Value
Number
Average Value
Number
Average Value
Number
Average Value
LOANS ORIGINATED
4
$78,045
37
$63,827
64
$50,914
20
$12,564
6
$41,437
APPLICATIONS APPROVED, NOT ACCEPTED
2
$45,990
12
$38,417
12
$47,663
6
$16,177
1
$20,990
APPLICATIONS DENIED
0
$0
27
$46,999
42
$51,467
19
$14,898
2
$28,660
APPLICATIONS WITHDRAWN
0
$0
5
$56,400
31
$40,935
4
$25,680
0
$0
FILES CLOSED FOR INCOMPLETENESS
0
$0
0
$0
4
$45,530
0
$0
0
$0
Aggregated Statistics For Year 1999 (Based on 3 partial tracts)
A) FHA, FSA/RHS & VA Home Purchase Loans
B) Conventional Home Purchase Loans
C) Refinancings
D) Home Improvement Loans
F) Non-occupant Loans on < 5 Family Dwellings (A B C & D)
2002 - 2018 National Fire Incident Reporting System (NFIRS) incidents
According to the data from the years 2002 - 2018 the average number of fires per year is 23. The highest number of fire incidents - 33 took place in 2010, and the least - 7 in 2005. The data has a declining trend.
When looking into fire subcategories, the most incidents belonged to: Structure Fires (61.9%), and Outside Fires (28.1%).
Fire incident types reported to NFIRS in Zip Code 43917


 Nearest zip codes: 43948, 43901, 43939, 43943, 43974, 43971.


 According to the data from the years 2002 - 2018 the average number of fires per year is 23. The highest number of fire incidents - 33 took place in 2010, and the least - 7 in 2005. The data has a declining trend.
 When looking into fire subcategories, the most incidents belonged to: Structure Fires (61.9%), and Outside Fires (28.1%).