Estimated zip code population in 2022: 3,174 Zip code population in 2010: 3,472 Zip code population in 2000: 4,171
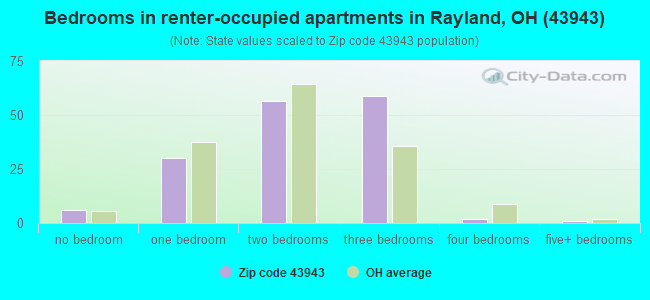
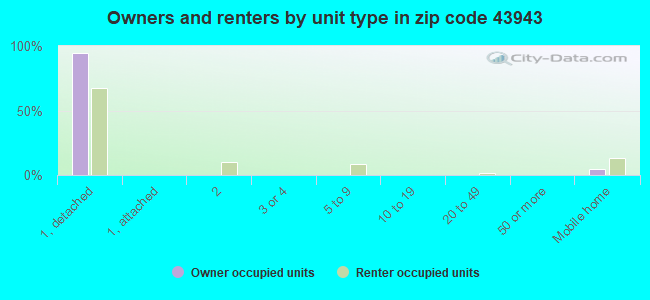
Houses and condos: 1,634 Renter-occupied apartments: 154
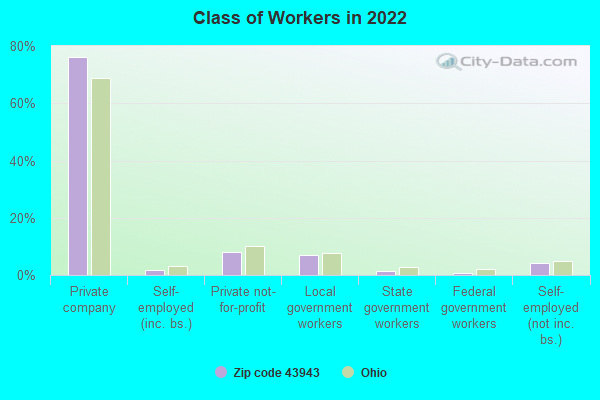
% of renters here:
11%
State:
33%
March 2022 cost of living index in zip code 43943: 82.4 (low, U.S. average is 100)
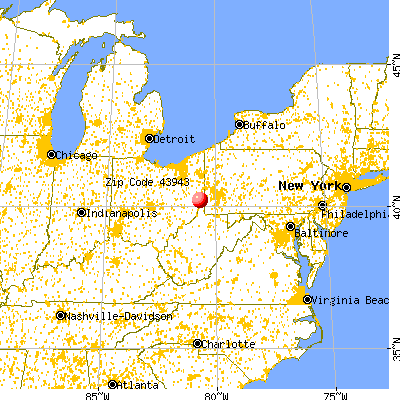
Land area: 41.7 sq. mi. Water area: 0.3 sq. mi.
Population density: 76 people per square mile
(very low).
OSM Map
General Map
Google Map
MSN Map
OSM Map
General Map
Google Map
MSN Map
OSM Map
General Map
Google Map
MSN Map
OSM Map
General Map
Google Map
MSN Map
Please wait while loading the map...
Real estate property taxes paid for housing units in 2022:
This zip code:
0.8% ($930)
Ohio:
1.3% ($2,639)
Median real estate property taxes paid for housing units with mortgages in 2022: $950 (0.7%) Median real estate property taxes paid for housing units with no mortgage in 2022: $881 (0.9%)
Business Search- 14 Million verified businesses
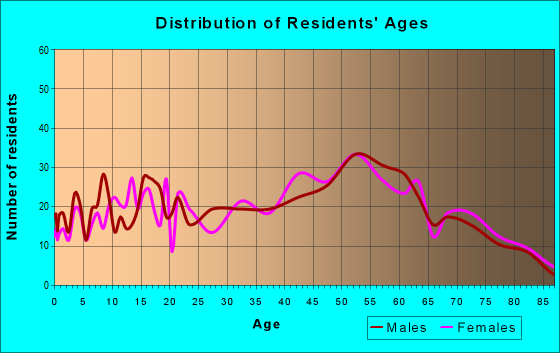
Males: 1,539
(48.5%)
Females: 1,635
(51.5%)
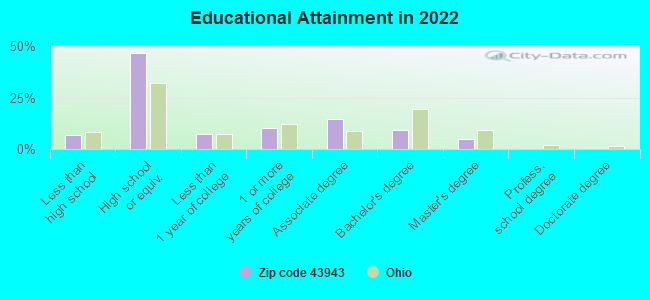
For population 25 years and over in 43943:
High school or higher: 92.1%
Bachelor's degree or higher: 14.2%
Graduate or professional degree: 5.1%
Unemployed: 4.1%
Mean travel time to work (commute): 29.0 minutes
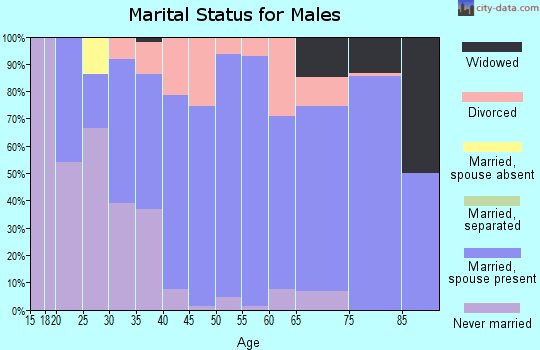
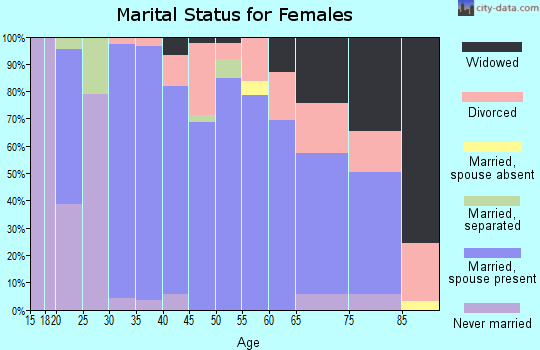
For population 15 years and over in 43943:
Never married: 22.1%
Now married: 51.6%
Separated: 1.4%
Widowed: 10.0%
Divorced: 15.0%
Zip code 43943 compared to state average:
Median house value below state average.
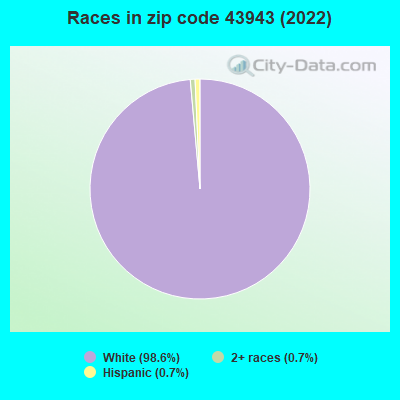
Black race population percentage significantly below state average.
Hispanic race population percentage significantly below state average.
Median age significantly above state average.
Foreign-born population percentage significantly below state average.
Renting percentage significantly below state average.
Length of stay since moving in significantly above state average.
Number of college students below state average.
Percentage of population with a bachelor's degree or higher below state average.
Estimated median house/condo value in 2022: $122,816
43943:
$122,816
Ohio:
$204,100
According to our research of Ohio and other state lists, there were 5 registered sex offenders living in 43943 zip code as of May 21, 2024. The ratio of all residents to sex offenders in zip code 43943 is 611 to 1. The ratio of registered sex offenders to all residents in this zip code is near the state average.
Median resident age:
This zip code:
51.4 years
Ohio median age:
39.9 years
Average household size:
This zip code:
2.3 people
Ohio:
2.4 people
Averages for the 2020 tax year for zip code 43943, filed in 2021:
Average Adjusted Gross Income (AGI) in 2020: $54,642 (Individual Income Tax Returns)
Here:
$54,642
State:
$67,288
Salary/wage: $46,266 (reported on 77.1% of returns)
Here:
$46,266
State:
$55,628
(% of AGI for various income ranges: 1013.6% for AGIs below $25k, 3177.6% for AGIs $25k-50k, 5857.5% for AGIs $50k-75k, 8918.3% for AGIs $75k-100k, 16725.4% for AGIs $100k-200k)
Taxable interest for individuals: $948 (reported on 25.3% of returns)
This zip code:
$948
Ohio:
$1,518
(% of AGI for various income ranges: 12.4% for AGIs below $25k, 36.2% for AGIs $25k-50k, 30.5% for AGIs $50k-75k, 55.8% for AGIs $75k-100k, 50.0% for AGIs $100k-200k)
Ordinary dividends: $1,821 (reported on 14.5% of returns)
Here:
$1,821
State:
$7,167
(% of AGI for various income ranges: 9.8% for AGIs below $25k, 37.6% for AGIs $25k-50k, 47.0% for AGIs $50k-75k, 38.3% for AGIs $75k-100k, 98.5% for AGIs $100k-200k)
Net capital gain/loss in AGI: +$3,750 (reported on 12.0% of returns)
Here:
+$3,750
State:
+$18,919
(% of AGI for various income ranges: 7.6% for AGIs below $25k, 16.2% for AGIs $25k-50k, 34.0% for AGIs $50k-75k, 92.5% for AGIs $75k-100k, 372.3% for AGIs $100k-200k)
Profit/loss from business: +$10,431 (reported on 7.8% of returns)
Here:
+$10,431
State:
+$13,744
(% of AGI for various income ranges: 70.2% for AGIs below $25k, 97.9% for AGIs $25k-50k, 140.8% for AGIs $75k-100k, 430.0% for AGIs $100k-200k)
Taxable individual retirement arrangement distribution: $12,256 (reported on 9.6% of returns)
43943:
$12,256
Ohio:
$18,876
(% of AGI for various income ranges: 50.2% for AGIs below $25k, 111.2% for AGIs $25k-50k, 219.0% for AGIs $50k-75k, 350.0% for AGIs $75k-100k, 395.4% for AGIs $100k-200k)
Earned income credit: $2,278 (reported on 13.9% of returns)
Here:
$2,278
State:
$2,304
(% of AGI for various income ranges: 87.4% for AGIs below $25k, 46.2% for AGIs $25k-50k)
Percentage of individuals using paid preparers for their 2020 taxes: 93.4%
Here:
93%
State:
94%
(% for various income ranges: 90.9% for AGIs below $25k, 95.3% for AGIs $25k-50k, 92.6% for AGIs $50k-75k, 94.1% for AGIs $75k-100k, 95.2% for AGIs $100k-200k, 100.0% for AGIs over 200k)
Averages for the 2012 tax year for zip code 43943, filed in 2013:
Average Adjusted Gross Income (AGI) in 2012: $48,488 (Individual Income Tax Returns)
Here:
$48,488
State:
$54,926
Salary/wage: $36,223 (reported on 82.9% of returns)
Here:
$36,223
State:
$45,869
(% of AGI for various income ranges: 69.5% for AGIs below $25k, 68.8% for AGIs $25k-50k, 74.5% for AGIs $50k-75k, 68.6% for AGIs $75k-100k, 65.8% for AGIs $100k-200k, 17.0% for AGIs over 200k)
Taxable interest for individuals: $1,086 (reported on 28.8% of returns)
This zip code:
$1,086
Ohio:
$1,297
(% of AGI for various income ranges: 0.7% for AGIs below $25k, 1.1% for AGIs $25k-50k, 1.0% for AGIs $50k-75k, 0.4% for AGIs $75k-100k, 0.2% for AGIs $100k-200k, 0.3% for AGIs over 200k)
Ordinary dividends: $1,540 (reported on 14.7% of returns)
Here:
$1,540
State:
$5,821
(% of AGI for various income ranges: 0.6% for AGIs below $25k, 0.4% for AGIs $25k-50k, 0.9% for AGIs $50k-75k, 0.5% for AGIs $75k-100k, 0.4% for AGIs $100k-200k)
Net capital gain/loss in AGI: +$557 (reported on 8.2% of returns)
Here:
+$557
State:
+$11,232
(% of AGI for various income ranges: 3.4% for AGIs $50k-75k, 0.7% for AGIs $100k-200k)
Profit/loss from business: +$10,565 (reported on 10.0% of returns)
Here:
+$10,565
State:
+$12,773
(% of AGI for various income ranges: 5.0% for AGIs below $25k, 1.2% for AGIs $25k-50k, 2.4% for AGIs $50k-75k, 5.8% for AGIs $75k-100k)
Taxable individual retirement arrangement distribution: $9,841 (reported on 10.0% of returns)
43943:
$9,841
Ohio:
$14,511
(% of AGI for various income ranges: 1.5% for AGIs below $25k, 2.3% for AGIs $25k-50k, 2.3% for AGIs $50k-75k, 3.3% for AGIs $75k-100k, 2.2% for AGIs $100k-200k)
Total itemized deductions: $17,727 (16% of AGI, reported on 12.9% of returns)
Here:
$17,727
State:
$21,278
Here:
16.1% of AGI
State:
18.8% of AGI
(% of AGI for various income ranges: 3.7% for AGIs $25k-50k, 5.8% for AGIs $50k-75k, 5.1% for AGIs $75k-100k, 5.8% for AGIs $100k-200k, 6.0% for AGIs over 200k)
Charity contributions: $2,385 (reported on 7.6% of returns)
Here:
$2,385
State:
$3,943
(% of AGI for various income ranges: 0.4% for AGIs below $25k, 0.4% for AGIs $50k-75k, 0.5% for AGIs $75k-100k, 0.9% for AGIs $100k-200k)
Taxes paid: $6,141 (reported on 12.9% of returns)
43943:
$6,141
State:
$9,568
(% of AGI for various income ranges: 0.6% for AGIs $25k-50k, 1.7% for AGIs $50k-75k, 1.2% for AGIs $75k-100k, 1.9% for AGIs $100k-200k, 4.3% for AGIs over 200k)
Earned income credit: $2,110 (reported on 17.6% of returns)
Here:
$2,110
State:
$2,285
(% of AGI for various income ranges: 6.1% for AGIs below $25k, 0.8% for AGIs $25k-50k)
Percentage of individuals using paid preparers for their 2012 taxes: 57.6%
Here:
58%
State:
51%
(% for various income ranges: 48.5% for AGIs below $25k, 57.4% for AGIs $25k-50k, 66.7% for AGIs $50k-75k, 66.7% for AGIs $75k-100k, 66.7% for AGIs $100k-200k, 100.0% for AGIs over 200k)
Averages for the 2004 tax year for zip code 43943, filed in 2005:
Average Adjusted Gross Income (AGI) in 2004: $32,063 (Individual Income Tax Returns)
Here:
$32,063
State:
$44,480
Salary/wage: $30,608 (reported on 83.7% of returns)
Here:
$30,608
State:
$39,198
(% of AGI for various income ranges: 76.8% for AGIs below $10k, 67.4% for AGIs $10k-25k, 80.3% for AGIs $25k-50k, 85.7% for AGIs $50k-75k, 83.3% for AGIs $75k-100k, 78.6% for AGIs over 100k)
Taxable interest for individuals: $1,199 (reported on 41.3% of returns)
This zip code:
$1,199
Ohio:
$1,532
(% of AGI for various income ranges: 3.8% for AGIs below $10k, 3.1% for AGIs $10k-25k, 1.5% for AGIs $25k-50k, 0.9% for AGIs $50k-75k, 0.8% for AGIs $75k-100k, 0.9% for AGIs over 100k)
Taxable dividends: $1,036 (reported on 16.4% of returns)
Here:
$1,036
State:
$3,496
(% of AGI for various income ranges: 0.6% for AGIs below $10k, 0.6% for AGIs $10k-25k, 0.6% for AGIs $25k-50k, 0.4% for AGIs $50k-75k, 0.6% for AGIs $75k-100k, 0.4% for AGIs over 100k)
Net capital gain/loss: +$994 (reported on 10.2% of returns)
Here:
+$994
State:
+$8,582
(% of AGI for various income ranges: 0.3% for AGIs below $10k, 0.2% for AGIs $10k-25k, 0.4% for AGIs $25k-50k, 0.1% for AGIs $50k-75k, 0.8% for AGIs $75k-100k)
Profit/loss from business: +$7,530 (reported on 8.9% of returns)
Here:
+$7,530
State:
+$10,813
(% of AGI for various income ranges: 5.1% for AGIs below $10k, 1.9% for AGIs $10k-25k, 1.8% for AGIs $25k-50k, 1.9% for AGIs $50k-75k, 3.8% for AGIs $75k-100k)
IRA payment deduction: $2,238 (reported on 1.2% of returns)
43943:
$2,238
Ohio:
$2,794
Total itemized deductions: $13,790 (22% of AGI, reported on 12.9% of returns)
Here:
$13,790
State:
$17,503
Here:
22.5% of AGI
State:
20.8% of AGI
(% of AGI for various income ranges: 3.3% for AGIs $10k-25k, 4.4% for AGIs $25k-50k, 5.6% for AGIs $50k-75k, 8.0% for AGIs $75k-100k, 11.7% for AGIs over 100k)
Charity contributions deductions: $1,673 (3% of AGI, reported on 9.3% of returns)
Here:
$1,673
State:
$3,087
Here:
2.6% of AGI
State:
3.4% of AGI
(% of AGI for various income ranges: 0.1% for AGIs $10k-25k, 0.4% for AGIs $25k-50k, 0.5% for AGIs $50k-75k, 0.8% for AGIs $75k-100k, 1.1% for AGIs over 100k)
Total tax: $3,523 (reported on 72.6% of returns)
43943:
$3,523
State:
$6,781
(% of AGI for various income ranges: 1.8% for AGIs below $10k, 3.8% for AGIs $10k-25k, 6.6% for AGIs $25k-50k, 8.8% for AGIs $50k-75k, 11.0% for AGIs $75k-100k, 15.7% for AGIs over 100k)
Earned income credit: $1,550 (reported on 15.8% of returns)
Here:
$1,550
State:
$1,696
Percentage of individuals using paid preparers for their 2004 taxes: 60.0%
Here:
60%
State:
55%
(% for various income ranges: 50.3% for AGIs below $10k, 59.9% for AGIs $10k-25k, 65.9% for AGIs $25k-50k, 60.9% for AGIs $50k-75k, 60.2% for AGIs $75k-100k, 77.1% for AGIs over 100k)
Household received Food Stamps/SNAP in the past 12 months: 195 Household did not receive Food Stamps/SNAP in the past 12 months: 1,191
Women who had a birth in the past 12 months: 32 (26 now married, 6 unmarried) Women who did not have a birth in the past 12 months: 468 (237 now married, 230 unmarried)
Housing units in zip code 43943 with a mortgage: 425 (27 second mortgage, 22 both second mortgage and home equity loan) Houses without a mortgage: 38
Median monthly owner costs for units with a mortgage: $949 Median monthly owner costs for units without a mortgage: $416
Residents with income below the poverty level in 2022:
This zip code:
16.6%
Whole state:
13.4%
Residents with income below 50% of the poverty level in 2022:
This zip code:
6.5%
Whole state:
7.0%
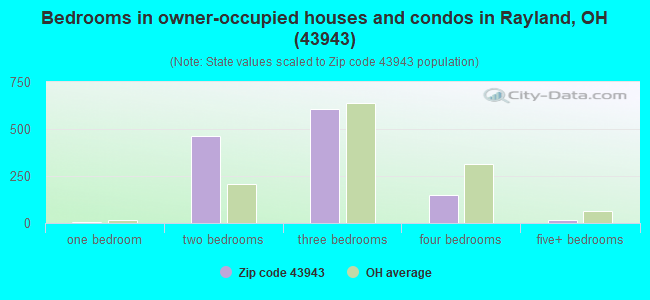
Median number of rooms in houses and condos:
Here:
6.0
State:
6.7
Median number of rooms in apartments:
Here:
4.9
State:
4.4
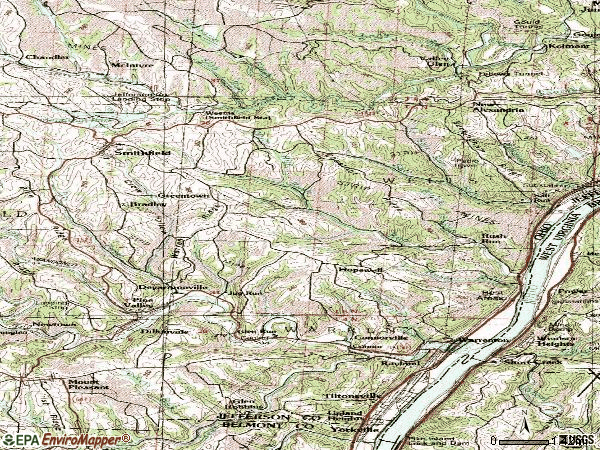
Notable locations in this zip code not listed on our city pages
Notable locations in zip code 43943: Vine Cliff Golf Course (A), Smithfield Emergency Squad (B), Rayland Volunteer Fire Department (C), Cardinal Power Plant (D). Display/hide their locations on the map
Cemeteries: Oak Grove Cemetery (1), Upland Heights Cemetery (2), Oliver Cemetery (3), Bayless Private Cemetery (4), Everson Family Cemetery (5), Hopewell Methodist Cemetery (6), Warrenton Cemetery (7). Display/hide their locations on the map
Lakes and reservoirs: Lake Betsy (A), Mingo Sportsmens Club Lake Number (B), Friendship Park Lake (C), Malabu Lake (D), Dorothy Mine Pond (E). Display/hide their locations on the map
Streams, rivers, and creeks: Little McIntyre Creek (A), Blues Run (B), Short Creek (C), Piney Fork (D), Williamson Run (E), Salt Run (F), Rush Run (G), Plum Run (H), Limestone Run (I). Display/hide their locations on the map
Size of family households: 553 2-persons, 128 3-persons, 115 4-persons, 57 5-persons, 24 6-persons, 7 7-or-more-persons
Size of nonfamily households: 416 1-person, 86 2-persons
324 married couples with children.
243 single-parent households (135 men, 108 women).
98.0% of residents of 43943 zip code speak English at home.
0.2% of residents speak Spanish at home (100% very well).
1.9% of residents speak other Indo-European language at home (93% very well, 7% not well).
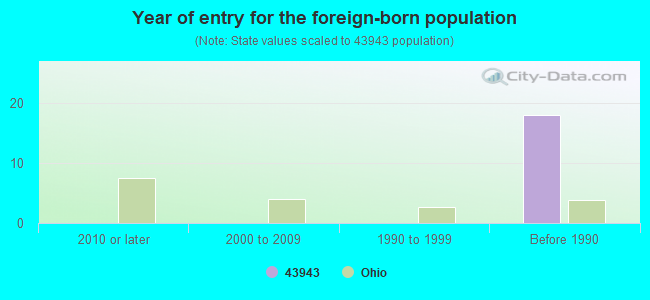
Foreign born population: 11 (0.4%) (100.0% of them are naturalized citizens)
This zip code:
0.4%
Whole state:
5.0%
82%Greece
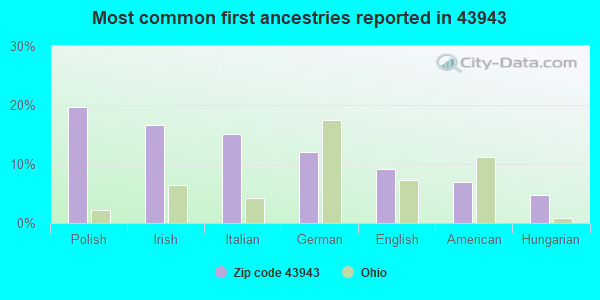
20%Polish
17%Irish
15%Italian
12%German
9%English
7%American
5%Hungarian
Year of entry for the foreign-born population
02010 or later
02000 to 2009
01990 to 1999
18Before 1990
Facilities with environmental interests located in this zip code:
BUCKEYE LOCAL SCH DIST (STATE RTE 150 in CONNORSVILLE, OH)
STATE MASTER (Ohio general info) - PCS-OH0107603, National Pollutant Discharge Elimination System Permit National Pollutant Discharge Elimination System NON-MAJOR (Tracking pollutant discharge elimination systems) - permit Business SIC classification: SEWERAGE SYSTEMS; ELEMENTARY AND SECONDARY SCHOOLS Organizations: BUCKEYE LOCAL SCHOOL DIST (CONTACT/OWNER)
BUCKEYE LOCAL HIGH SCHOOL (10692 STATE ROUTE 150 in RAYLAND, OH)
(National Center for Education Statistics) - STATE ID-111138 Organizations: BUCKEYE LOCAL SD (SCHOOL DISTRICT)
BUCKEYE LOCAL SD (PO BOX 300 in RAYLAND, OH)
COMPLIANCE ACTIVITY (Tracking inspections of insecticide, fungicide, and rodenticide, and toxic substances)
Housing units lacking complete plumbing facilities: 3.4% Housing units lacking complete kitchen facilities: 5.1%
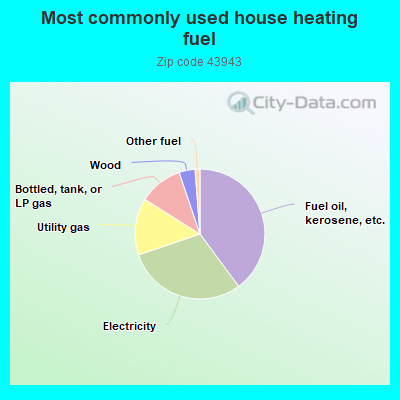
40.0%Fuel oil, kerosene, etc.
30.0%Electricity
14.2%Utility gas
10.9%Bottled, tank, or LP gas
4.0%Wood
1.2%Other fuel
Population in 1990: 4,623.
Place of birth for U.S.-born residents:
This state: 2,030
Northeast: 87
Midwest: 26
South: 984
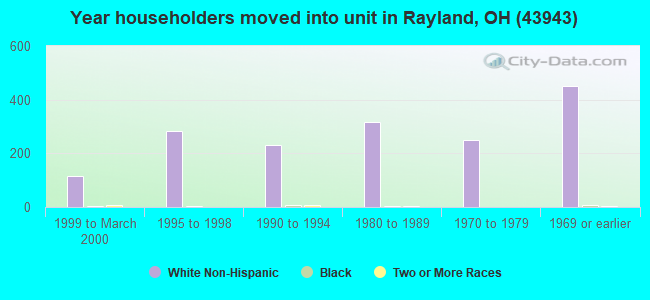
74% of the 43943 zip code residents lived in the same house 5 years ago. Out of people who lived in different houses, 79% lived in this county. Out of people who lived in different counties, 50% lived in Ohio.
94% of the 43943 zip code residents lived in the same house 1 year ago. Out of people who lived in different houses, 47% moved from this county. Out of people who lived in different houses, 52% moved from different county within same state. Out of people who lived in different houses, 1% moved from different state. Out of people who lived in different houses, 8% moved from abroad.
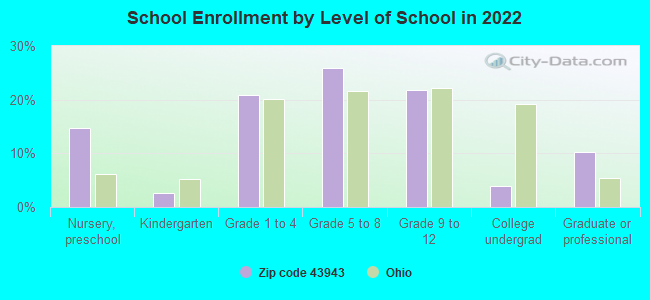
Private vs. public school enrollment:
Students in private schools in grades 1 to 8 (elementary and middle school): 13
Here:
5.0%
Ohio:
16.0%
Students in private schools in grades 9 to 12 (high school):
Here:
0.0%
Ohio:
13.1%
Students in private undergraduate colleges: 5
Here:
24.8%
Ohio:
22.3%
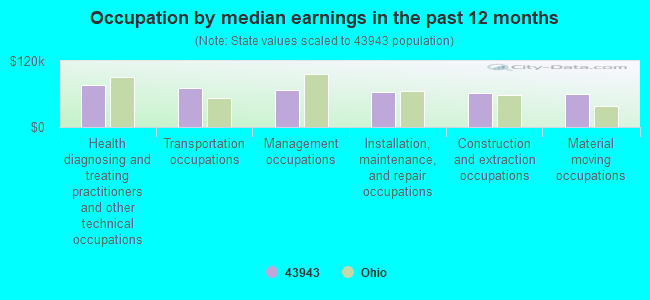
Occupation by median earnings in the past 12 months ($)
76,621Health diagnosing and treating practitioners and other technical occupations
70,764Transportation occupations
67,557Management occupations
63,085Installation, maintenance, and repair occupations
62,466Construction and extraction occupations
60,700Material moving occupations
Top industries in this zip code by the number of employees in 2005:
Health Care and Social Assistance: Residential Mental Retardation Facilities (20-49 employees: 1 establishment)
Construction: Poured Concrete Foundation and Structure Contractors (10-19: 1)
Construction: Electrical Contractors (10-19: 1)
Accommodation and Food Services: Limited-Service Restaurants (10-19: 1)
Construction: New Single-Family Housing Construction (except Operative Builders) (5-9: 1, 1-4: 1)
Fatal accident statistics in 2011:
Fatal accident count: 1
Vehicles involved in fatal accidents: 1
Fatal accidents caused by drunken drivers: 1
Fatalities: 1
Persons involved in fatal accidents: 1
Pedestrians involved in fatal accidents: 0
Home Mortgage Disclosure Act Aggregated Statistics For Year 2009 (Based on 10 partial tracts)
A) FHA, FSA/RHS & VA Home Purchase Loans
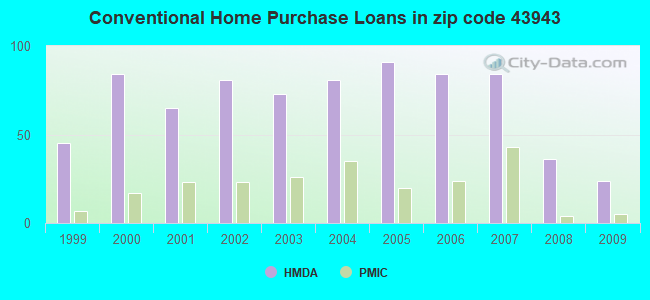
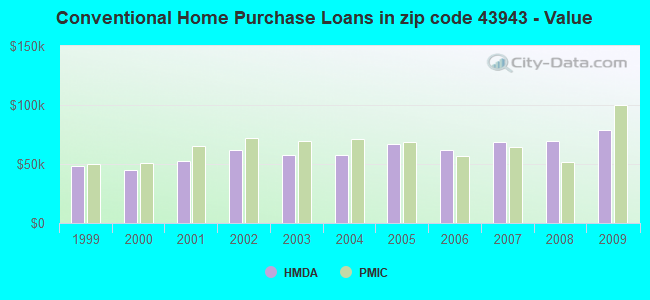
B) Conventional Home Purchase Loans
C) Refinancings
D) Home Improvement Loans
F) Non-occupant Loans on < 5 Family Dwellings (A B C & D)
G) Loans On Manufactured Home Dwelling (A B C & D)
Number
Average Value
Number
Average Value
Number
Average Value
Number
Average Value
Number
Average Value
Number
Average Value
LOANS ORIGINATED
22
$61,038
24
$78,573
79
$78,830
23
$29,145
3
$64,230
3
$43,580
APPLICATIONS APPROVED, NOT ACCEPTED
1
$43,420
4
$112,670
10
$51,646
2
$92,310
0
$0
2
$23,670
APPLICATIONS DENIED
5
$73,896
24
$44,253
72
$95,870
27
$13,984
7
$58,146
22
$28,401
APPLICATIONS WITHDRAWN
2
$137,285
1
$46,050
21
$75,535
2
$21,565
0
$0
0
$0
FILES CLOSED FOR INCOMPLETENESS
1
$22,370
0
$0
4
$73,945
1
$8,280
0
$0
0
$0
Aggregated Statistics For Year 2008 (Based on 10 partial tracts)
A) FHA, FSA/RHS & VA Home Purchase Loans
B) Conventional Home Purchase Loans
C) Refinancings
D) Home Improvement Loans
F) Non-occupant Loans on < 5 Family Dwellings (A B C & D)
G) Loans On Manufactured Home Dwelling (A B C & D)
Number
Average Value
Number
Average Value
Number
Average Value
Number
Average Value
Number
Average Value
Number
Average Value
LOANS ORIGINATED
38
$68,613
36
$69,395
84
$74,681
29
$28,783
16
$41,336
9
$59,720
APPLICATIONS APPROVED, NOT ACCEPTED
2
$64,380
6
$94,798
14
$73,959
3
$41,743
1
$36,320
0
$0
APPLICATIONS DENIED
13
$46,461
21
$43,736
104
$88,098
39
$26,787
11
$35,557
15
$60,257
APPLICATIONS WITHDRAWN
5
$63,144
3
$42,500
26
$106,535
5
$24,480
0
$0
0
$0
FILES CLOSED FOR INCOMPLETENESS
5
$85,916
6
$39,115
8
$68,138
1
$54,210
1
$19,050
3
$44,007
Aggregated Statistics For Year 2007 (Based on 10 partial tracts)
A) FHA, FSA/RHS & VA Home Purchase Loans
B) Conventional Home Purchase Loans
C) Refinancings
D) Home Improvement Loans
F) Non-occupant Loans on < 5 Family Dwellings (A B C & D)
G) Loans On Manufactured Home Dwelling (A B C & D)
Number
Average Value
Number
Average Value
Number
Average Value
Number
Average Value
Number
Average Value
Number
Average Value
LOANS ORIGINATED
22
$78,244
84
$68,657
114
$68,774
67
$23,109
14
$58,116
22
$76,630
APPLICATIONS APPROVED, NOT ACCEPTED
0
$0
10
$67,867
28
$71,420
13
$19,234
1
$101,570
3
$73,163
APPLICATIONS DENIED
9
$47,408
19
$66,414
134
$104,492
91
$41,918
6
$40,425
14
$48,689
APPLICATIONS WITHDRAWN
0
$0
15
$47,934
48
$120,911
10
$48,168
5
$36,808
2
$40,590
FILES CLOSED FOR INCOMPLETENESS
1
$68,710
7
$68,967
7
$114,549
1
$45,560
0
$0
1
$55,430
Aggregated Statistics For Year 2006 (Based on 10 partial tracts)
A) FHA, FSA/RHS & VA Home Purchase Loans
B) Conventional Home Purchase Loans
C) Refinancings
D) Home Improvement Loans
F) Non-occupant Loans on < 5 Family Dwellings (A B C & D)
G) Loans On Manufactured Home Dwelling (A B C & D)
Number
Average Value
Number
Average Value
Number
Average Value
Number
Average Value
Number
Average Value
Number
Average Value
LOANS ORIGINATED
15
$68,427
84
$62,073
116
$59,251
61
$25,389
23
$37,742
9
$60,257
APPLICATIONS APPROVED, NOT ACCEPTED
1
$105,210
9
$52,027
27
$68,312
5
$32,084
2
$37,280
4
$62,422
APPLICATIONS DENIED
9
$67,573
29
$59,204
137
$66,133
81
$26,286
24
$34,759
8
$65,146
APPLICATIONS WITHDRAWN
0
$0
13
$64,562
51
$85,765
3
$25,593
2
$48,510
2
$22,895
FILES CLOSED FOR INCOMPLETENESS
0
$0
1
$86,340
13
$96,327
1
$46,820
2
$47,340
0
$0
Aggregated Statistics For Year 2005 (Based on 10 partial tracts)
A) FHA, FSA/RHS & VA Home Purchase Loans
B) Conventional Home Purchase Loans
C) Refinancings
D) Home Improvement Loans
F) Non-occupant Loans on < 5 Family Dwellings (A B C & D)
G) Loans On Manufactured Home Dwelling (A B C & D)
Number
Average Value
Number
Average Value
Number
Average Value
Number
Average Value
Number
Average Value
Number
Average Value
LOANS ORIGINATED
15
$54,589
91
$67,304
141
$67,751
64
$37,195
15
$46,508
10
$77,497
APPLICATIONS APPROVED, NOT ACCEPTED
2
$105,695
18
$60,883
38
$68,914
11
$36,635
0
$0
8
$69,501
APPLICATIONS DENIED
9
$72,807
45
$47,795
168
$68,028
66
$24,680
10
$34,497
16
$60,662
APPLICATIONS WITHDRAWN
0
$0
10
$69,898
93
$79,733
7
$430,236
4
$64,295
7
$66,646
FILES CLOSED FOR INCOMPLETENESS
2
$41,720
4
$71,015
19
$86,373
2
$46,870
0
$0
0
$0
Aggregated Statistics For Year 2004 (Based on 10 partial tracts)
A) FHA, FSA/RHS & VA Home Purchase Loans
B) Conventional Home Purchase Loans
C) Refinancings
D) Home Improvement Loans
F) Non-occupant Loans on < 5 Family Dwellings (A B C & D)
G) Loans On Manufactured Home Dwelling (A B C & D)
Number
Average Value
Number
Average Value
Number
Average Value
Number
Average Value
Number
Average Value
Number
Average Value
LOANS ORIGINATED
18
$76,866
81
$57,661
166
$63,939
46
$21,777
20
$34,042
10
$59,472
APPLICATIONS APPROVED, NOT ACCEPTED
2
$69,570
6
$42,815
32
$60,782
11
$19,758
1
$15,450
2
$60,595
APPLICATIONS DENIED
10
$66,639
31
$50,586
189
$65,491
45
$25,158
8
$29,404
15
$54,379
APPLICATIONS WITHDRAWN
1
$19,230
18
$52,243
83
$69,615
6
$37,333
0
$0
7
$60,663
FILES CLOSED FOR INCOMPLETENESS
1
$46,760
5
$58,040
21
$81,047
1
$74,560
0
$0
0
$0
Aggregated Statistics For Year 2003 (Based on 10 partial tracts)
A) FHA, FSA/RHS & VA Home Purchase Loans
B) Conventional Home Purchase Loans
C) Refinancings
D) Home Improvement Loans
F) Non-occupant Loans on < 5 Family Dwellings (A B C & D)
Number
Average Value
Number
Average Value
Number
Average Value
Number
Average Value
Number
Average Value
LOANS ORIGINATED
19
$54,001
73
$57,945
292
$60,094
33
$22,824
22
$40,499
APPLICATIONS APPROVED, NOT ACCEPTED
0
$0
8
$47,779
49
$64,504
5
$21,680
5
$43,408
APPLICATIONS DENIED
3
$90,410
20
$56,456
183
$62,522
30
$20,029
9
$45,284
APPLICATIONS WITHDRAWN
3
$64,210
15
$84,452
77
$68,891
5
$30,780
3
$69,707
FILES CLOSED FOR INCOMPLETENESS
7
$41,033
3
$45,017
12
$69,585
1
$40,880
0
$0
Aggregated Statistics For Year 2002 (Based on 10 partial tracts)
A) FHA, FSA/RHS & VA Home Purchase Loans
B) Conventional Home Purchase Loans
C) Refinancings
D) Home Improvement Loans
F) Non-occupant Loans on < 5 Family Dwellings (A B C & D)
Number
Average Value
Number
Average Value
Number
Average Value
Number
Average Value
Number
Average Value
LOANS ORIGINATED
19
$63,901
81
$62,003
227
$61,956
51
$14,649
22
$33,473
APPLICATIONS APPROVED, NOT ACCEPTED
0
$0
15
$52,629
58
$67,152
10
$11,495
3
$48,323
APPLICATIONS DENIED
8
$61,556
30
$46,589
161
$58,753
47
$14,036
10
$44,409
APPLICATIONS WITHDRAWN
2
$59,790
11
$41,885
67
$69,281
7
$11,037
4
$30,550
FILES CLOSED FOR INCOMPLETENESS
1
$52,330
5
$47,034
32
$66,955
0
$0
3
$62,803
Aggregated Statistics For Year 2001 (Based on 10 partial tracts)
A) FHA, FSA/RHS & VA Home Purchase Loans
B) Conventional Home Purchase Loans
C) Refinancings
D) Home Improvement Loans
F) Non-occupant Loans on < 5 Family Dwellings (A B C & D)
Number
Average Value
Number
Average Value
Number
Average Value
Number
Average Value
Number
Average Value
LOANS ORIGINATED
11
$68,106
65
$52,744
217
$53,162
51
$17,642
14
$34,886
APPLICATIONS APPROVED, NOT ACCEPTED
0
$0
9
$58,158
45
$52,323
11
$20,652
2
$56,375
APPLICATIONS DENIED
2
$55,860
33
$46,000
139
$57,247
35
$13,262
5
$21,506
APPLICATIONS WITHDRAWN
0
$0
6
$87,083
91
$58,971
9
$17,526
0
$0
FILES CLOSED FOR INCOMPLETENESS
0
$0
5
$68,196
21
$42,214
0
$0
0
$0
Aggregated Statistics For Year 2000 (Based on 10 partial tracts)
A) FHA, FSA/RHS & VA Home Purchase Loans
B) Conventional Home Purchase Loans
C) Refinancings
D) Home Improvement Loans
F) Non-occupant Loans on < 5 Family Dwellings (A B C & D)
Number
Average Value
Number
Average Value
Number
Average Value
Number
Average Value
Number
Average Value
LOANS ORIGINATED
8
$53,156
84
$45,002
134
$47,056
34
$17,886
22
$23,336
APPLICATIONS APPROVED, NOT ACCEPTED
2
$34,610
17
$45,998
51
$45,195
6
$10,058
5
$53,836
APPLICATIONS DENIED
0
$0
64
$39,613
125
$48,947
36
$11,516
5
$30,008
APPLICATIONS WITHDRAWN
2
$42,950
3
$49,423
52
$44,118
4
$12,885
0
$0
FILES CLOSED FOR INCOMPLETENESS
0
$0
1
$16,380
10
$52,834
1
$31,480
0
$0
Aggregated Statistics For Year 1999 (Based on 5 partial tracts)
A) FHA, FSA/RHS & VA Home Purchase Loans
B) Conventional Home Purchase Loans
C) Refinancings
D) Home Improvement Loans
F) Non-occupant Loans on < 5 Family Dwellings (A B C & D)
2002 - 2018 National Fire Incident Reporting System (NFIRS) incidents
According to the data from the years 2002 - 2018 the average number of fire incidents per year is 27. The highest number of reported fires - 73 took place in 2009, and the least - 4 in 2002. The data has a rising trend.
When looking into fire subcategories, the most incidents belonged to: Structure Fires (55.1%), and Outside Fires (35.7%).
Fire incident types reported to NFIRS in Zip Code 43943


 Nearest zip codes: 43963, 43971, 26075, 43917, 26030, 43948.


 According to the data from the years 2002 - 2018 the average number of fire incidents per year is 27. The highest number of reported fires - 73 took place in 2009, and the least - 4 in 2002. The data has a rising trend.
 When looking into fire subcategories, the most incidents belonged to: Structure Fires (55.1%), and Outside Fires (35.7%).