Estimated zip code population in 2022: 4,811 Zip code population in 2010: 4,967 Zip code population in 2000: 4,481
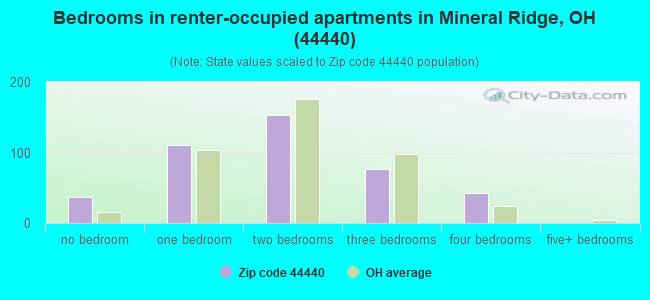
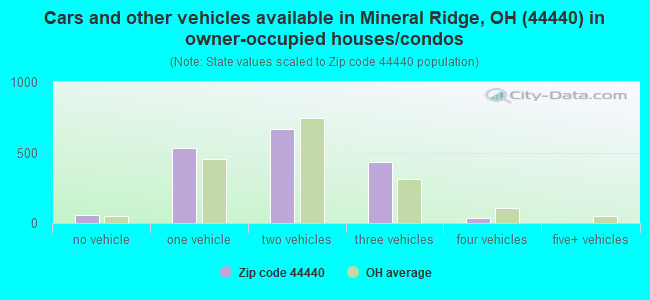
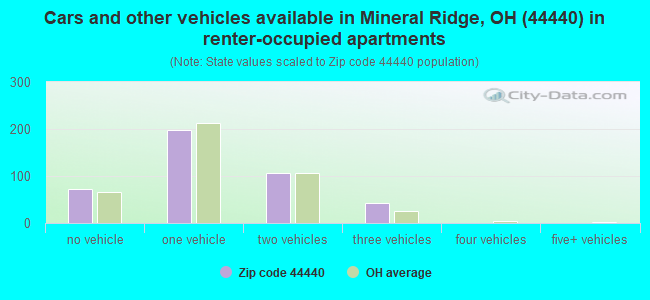
Houses and condos: 2,260 Renter-occupied apartments: 420
% of renters here:
20%
State:
33%
March 2022 cost of living index in zip code 44440: 89.3 (less than average, U.S. average is 100)
Land area: 8.3 sq. mi. Water area: 1.1 sq. mi.
Population density: 576 people per square mile
(low).
OSM Map
General Map
Google Map
MSN Map
OSM Map
General Map
Google Map
MSN Map
OSM Map
General Map
Google Map
MSN Map
OSM Map
General Map
Google Map
MSN Map
Please wait while loading the map...
Real estate property taxes paid for housing units in 2022:
This zip code:
1.4% ($2,325)
Ohio:
1.3% ($2,639)
Median real estate property taxes paid for housing units with mortgages in 2022: $2,471 (1.6%) Median real estate property taxes paid for housing units with no mortgage in 2022: $2,195 (1.2%)
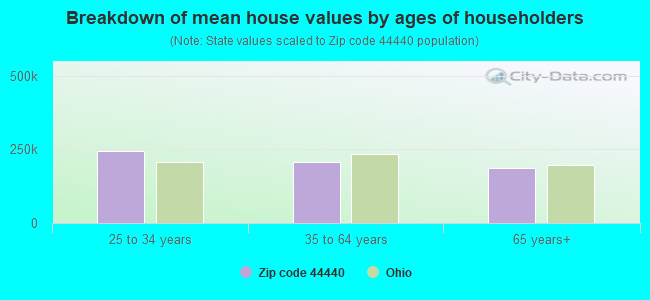
Estimated median house/condo value in 2022: $171,587
44440:
$171,587
Ohio:
$204,100
According to our research of Ohio and other state lists, there were 6 registered sex offenders living in 44440 zip code as of May 08, 2024. The ratio of all residents to sex offenders in zip code 44440 is 859 to 1. The ratio of registered sex offenders to all residents in this zip code is lower than the state average.
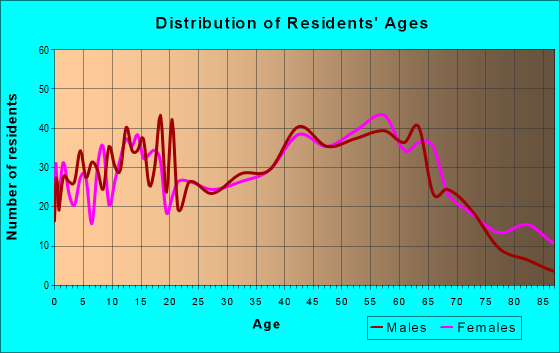
Median resident age:
This zip code:
49.4 years
Ohio median age:
39.9 years
Average household size:
This zip code:
2.1 people
Ohio:
2.4 people
Averages for the 2020 tax year for zip code 44440, filed in 2021:
Average Adjusted Gross Income (AGI) in 2020: $52,855 (Individual Income Tax Returns)
Here:
$52,855
State:
$67,288
Salary/wage: $46,852 (reported on 77.7% of returns)
Here:
$46,852
State:
$55,628
(% of AGI for various income ranges: 1013.1% for AGIs below $25k, 3281.0% for AGIs $25k-50k, 5350.0% for AGIs $50k-75k, 7971.2% for AGIs $75k-100k, 15061.0% for AGIs $100k-200k)
Taxable interest for individuals: $1,056 (reported on 30.9% of returns)
This zip code:
$1,056
Ohio:
$1,518
(% of AGI for various income ranges: 15.9% for AGIs below $25k, 23.7% for AGIs $25k-50k, 44.3% for AGIs $50k-75k, 59.4% for AGIs $75k-100k, 159.5% for AGIs $100k-200k)
Ordinary dividends: $3,193 (reported on 18.0% of returns)
Here:
$3,193
State:
$7,167
(% of AGI for various income ranges: 19.4% for AGIs below $25k, 39.8% for AGIs $25k-50k, 59.3% for AGIs $50k-75k, 157.1% for AGIs $75k-100k, 294.0% for AGIs $100k-200k)
Net capital gain/loss in AGI: +$5,609 (reported on 14.6% of returns)
Here:
+$5,609
State:
+$18,919
(% of AGI for various income ranges: 7.0% for AGIs below $25k, 26.7% for AGIs $25k-50k, 50.0% for AGIs $50k-75k, 158.2% for AGIs $75k-100k, 657.0% for AGIs $100k-200k)
Profit/loss from business: +$7,561 (reported on 13.3% of returns)
Here:
+$7,561
State:
+$13,744
(% of AGI for various income ranges: 104.8% for AGIs below $25k, 93.9% for AGIs $25k-50k, 89.7% for AGIs $50k-75k, 154.1% for AGIs $75k-100k, 384.0% for AGIs $100k-200k)
Taxable individual retirement arrangement distribution: $10,185 (reported on 11.6% of returns)
44440:
$10,185
Ohio:
$18,876
(% of AGI for various income ranges: 53.5% for AGIs below $25k, 88.6% for AGIs $25k-50k, 286.7% for AGIs $50k-75k, 329.4% for AGIs $75k-100k, 294.5% for AGIs $100k-200k)
Total itemized deductions: $32,060 (reported on 2.1% of returns)
Here:
$32,060
State:
$33,869
(% of AGI for various income ranges: 126.7% for AGIs below $25k, 540.6% for AGIs $75k-100k)
Charity contributions: $9,025 (reported on 1.7% of returns)
Here:
$9,025
State:
$14,577
(% of AGI for various income ranges: 212.4% for AGIs $75k-100k)
Taxes paid: $6,000 (reported on 2.1% of returns)
44440:
$6,000
State:
$7,681
(% of AGI for various income ranges: 176.5% for AGIs $75k-100k)
Earned income credit: $2,070 (reported on 12.9% of returns)
Here:
$2,070
State:
$2,304
(% of AGI for various income ranges: 76.1% for AGIs below $25k, 41.2% for AGIs $25k-50k)
Percentage of individuals using paid preparers for their 2020 taxes: 94.4%
Here:
94%
State:
94%
(% for various income ranges: 91.9% for AGIs below $25k, 95.4% for AGIs $25k-50k, 95.0% for AGIs $50k-75k, 95.7% for AGIs $75k-100k, 96.6% for AGIs $100k-200k, 100.0% for AGIs over 200k)
Averages for the 2012 tax year for zip code 44440, filed in 2013:
Average Adjusted Gross Income (AGI) in 2012: $46,492 (Individual Income Tax Returns)
Here:
$46,492
State:
$54,926
Salary/wage: $40,111 (reported on 83.0% of returns)
Here:
$40,111
State:
$45,869
(% of AGI for various income ranges: 66.9% for AGIs below $25k, 70.3% for AGIs $25k-50k, 75.1% for AGIs $50k-75k, 75.1% for AGIs $75k-100k, 69.1% for AGIs $100k-200k)
Taxable interest for individuals: $992 (reported on 33.9% of returns)
This zip code:
$992
Ohio:
$1,297
(% of AGI for various income ranges: 1.5% for AGIs below $25k, 0.6% for AGIs $25k-50k, 1.1% for AGIs $50k-75k, 0.4% for AGIs $75k-100k, 0.4% for AGIs $100k-200k)
Ordinary dividends: $2,305 (reported on 18.7% of returns)
Here:
$2,305
State:
$5,821
(% of AGI for various income ranges: 1.0% for AGIs below $25k, 0.5% for AGIs $25k-50k, 0.7% for AGIs $50k-75k, 0.9% for AGIs $75k-100k, 1.4% for AGIs $100k-200k)
Net capital gain/loss in AGI: +$3,204 (reported on 11.7% of returns)
Here:
+$3,204
State:
+$11,232
(% of AGI for various income ranges: 0.2% for AGIs $50k-75k, 0.2% for AGIs $75k-100k, 2.8% for AGIs $100k-200k)
Profit/loss from business: +$7,735 (reported on 11.3% of returns)
Here:
+$7,735
State:
+$12,773
(% of AGI for various income ranges: 4.5% for AGIs below $25k, 1.9% for AGIs $25k-50k, 1.6% for AGIs $50k-75k, 1.5% for AGIs $75k-100k, 1.5% for AGIs $100k-200k)
Taxable individual retirement arrangement distribution: $9,720 (reported on 10.9% of returns)
44440:
$9,720
Ohio:
$14,511
(% of AGI for various income ranges: 3.1% for AGIs below $25k, 1.8% for AGIs $25k-50k, 1.9% for AGIs $50k-75k, 2.3% for AGIs $75k-100k, 2.6% for AGIs $100k-200k)
Total itemized deductions: $16,382 (21% of AGI, reported on 26.5% of returns)
Here:
$16,382
State:
$21,278
Here:
20.9% of AGI
State:
18.8% of AGI
(% of AGI for various income ranges: 10.5% for AGIs below $25k, 7.7% for AGIs $25k-50k, 9.3% for AGIs $50k-75k, 9.0% for AGIs $75k-100k, 10.4% for AGIs $100k-200k)
Charity contributions: $2,617 (reported on 20.0% of returns)
Here:
$2,617
State:
$3,943
(% of AGI for various income ranges: 0.5% for AGIs below $25k, 1.1% for AGIs $25k-50k, 1.2% for AGIs $50k-75k, 1.1% for AGIs $75k-100k, 1.3% for AGIs $100k-200k)
Taxes paid: $5,551 (reported on 25.7% of returns)
44440:
$5,551
State:
$9,568
(% of AGI for various income ranges: 0.9% for AGIs below $25k, 1.8% for AGIs $25k-50k, 2.8% for AGIs $50k-75k, 3.3% for AGIs $75k-100k, 4.7% for AGIs $100k-200k)
Earned income credit: $2,239 (reported on 12.2% of returns)
Here:
$2,239
State:
$2,285
(% of AGI for various income ranges: 4.5% for AGIs below $25k, 0.7% for AGIs $25k-50k)
Percentage of individuals using paid preparers for their 2012 taxes: 53.5%
Here:
53%
State:
51%
(% for various income ranges: 46.0% for AGIs below $25k, 54.2% for AGIs $25k-50k, 58.3% for AGIs $50k-75k, 59.3% for AGIs $75k-100k, 66.7% for AGIs $100k-200k)
Averages for the 2004 tax year for zip code 44440, filed in 2005:
Average Adjusted Gross Income (AGI) in 2004: $39,472 (Individual Income Tax Returns)
Here:
$39,472
State:
$44,480
Salary/wage: $36,226 (reported on 88.4% of returns)
Here:
$36,226
State:
$39,198
(% of AGI for various income ranges: 97.5% for AGIs below $10k, 69.8% for AGIs $10k-25k, 76.9% for AGIs $25k-50k, 86.0% for AGIs $50k-75k, 84.0% for AGIs $75k-100k, 81.4% for AGIs over 100k)
Taxable interest for individuals: $821 (reported on 50.9% of returns)
This zip code:
$821
Ohio:
$1,532
(% of AGI for various income ranges: 2.4% for AGIs below $10k, 2.5% for AGIs $10k-25k, 1.0% for AGIs $25k-50k, 0.7% for AGIs $50k-75k, 1.1% for AGIs $75k-100k, 0.6% for AGIs over 100k)
Taxable dividends: $1,202 (reported on 23.9% of returns)
Here:
$1,202
State:
$3,496
(% of AGI for various income ranges: 2.4% for AGIs below $10k, 0.7% for AGIs $10k-25k, 0.6% for AGIs $25k-50k, 0.6% for AGIs $50k-75k, 0.7% for AGIs $75k-100k, 1.1% for AGIs over 100k)
Net capital gain/loss: +$2,793 (reported on 14.6% of returns)
Here:
+$2,793
State:
+$8,582
(% of AGI for various income ranges: -0.7% for AGIs below $10k, 0.3% for AGIs $10k-25k, 0.1% for AGIs $25k-50k, 1.4% for AGIs $50k-75k, 0.3% for AGIs $75k-100k, 3.7% for AGIs over 100k)
Profit/loss from business: +$7,508 (reported on 11.2% of returns)
Here:
+$7,508
State:
+$10,813
(% of AGI for various income ranges: 2.3% for AGIs below $10k, 4.3% for AGIs $10k-25k, 2.0% for AGIs $25k-50k, 1.3% for AGIs $50k-75k, 2.2% for AGIs $75k-100k, 2.6% for AGIs over 100k)
IRA payment deduction: $3,115 (reported on 2.3% of returns)
44440:
$3,115
Ohio:
$2,794
Total itemized deductions: $13,316 (20% of AGI, reported on 32.5% of returns)
Here:
$13,316
State:
$17,503
Here:
20.4% of AGI
State:
20.8% of AGI
(% of AGI for various income ranges: 7.2% for AGIs $10k-25k, 9.6% for AGIs $25k-50k, 11.5% for AGIs $50k-75k, 13.5% for AGIs $75k-100k, 12.9% for AGIs over 100k)
Charity contributions deductions: $2,210 (3% of AGI, reported on 28.0% of returns)
Here:
$2,210
State:
$3,087
Here:
3.3% of AGI
State:
3.4% of AGI
(% of AGI for various income ranges: 0.8% for AGIs $10k-25k, 1.2% for AGIs $25k-50k, 1.5% for AGIs $50k-75k, 1.8% for AGIs $75k-100k, 2.8% for AGIs over 100k)
Total tax: $4,689 (reported on 79.4% of returns)
44440:
$4,689
State:
$6,781
(% of AGI for various income ranges: 1.8% for AGIs below $10k, 4.1% for AGIs $10k-25k, 7.4% for AGIs $25k-50k, 9.3% for AGIs $50k-75k, 10.8% for AGIs $75k-100k, 15.8% for AGIs over 100k)
Earned income credit: $1,610 (reported on 10.9% of returns)
Here:
$1,610
State:
$1,696
Percentage of individuals using paid preparers for their 2004 taxes: 55.6%
Here:
56%
State:
55%
(% for various income ranges: 44.9% for AGIs below $10k, 51.4% for AGIs $10k-25k, 60.9% for AGIs $25k-50k, 58.2% for AGIs $50k-75k, 63.5% for AGIs $75k-100k, 58.3% for AGIs over 100k)
Household received Food Stamps/SNAP in the past 12 months: 108 Household did not receive Food Stamps/SNAP in the past 12 months: 2,014
Women who had a birth in the past 12 months: 19 (20 now married, 0 unmarried) Women who did not have a birth in the past 12 months: 857 (431 now married, 425 unmarried)
Housing units in zip code 44440 with a mortgage: 1,021 (116 second mortgage, 101 both second mortgage and home equity loan) Houses without a mortgage: 138
Median monthly owner costs for units with a mortgage: $1,215 Median monthly owner costs for units without a mortgage: $474
Residents with income below the poverty level in 2022:
This zip code:
7.6%
Whole state:
13.4%
Residents with income below 50% of the poverty level in 2022:
This zip code:
3.3%
Whole state:
7.0%
Median number of rooms in houses and condos:
Here:
6.3
State:
6.7
Median number of rooms in apartments:
Here:
4.6
State:
4.4
Notable locations in this zip code not listed on our city pages
Churches in zip code 44440 include: First United Methodist Church of Mineral Ridge (A), First Presbyterian Church (B), Church of Christ (C). Display/hide their locations on the map
In group quarters: 297 (-1 institutionalized population)
Size of family households: 823 2-persons, 237 3-persons, 103 4-persons, 138 5-persons, 8 6-persons
Size of nonfamily households: 708 1-person, 113 2-persons
549 married couples with children.
80 single-parent households (46 men, 34 women).
97.7% of residents of 44440 zip code speak English at home.
1.9% of residents speak Spanish at home (100% very well).
0.7% of residents speak other Indo-European language at home (100% well).
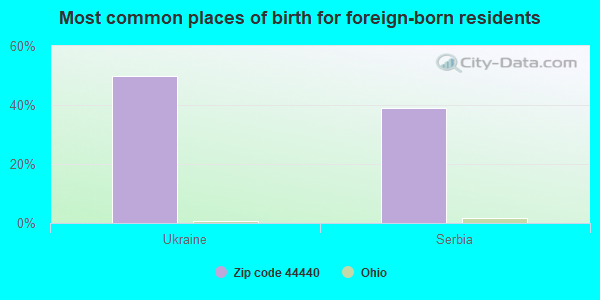
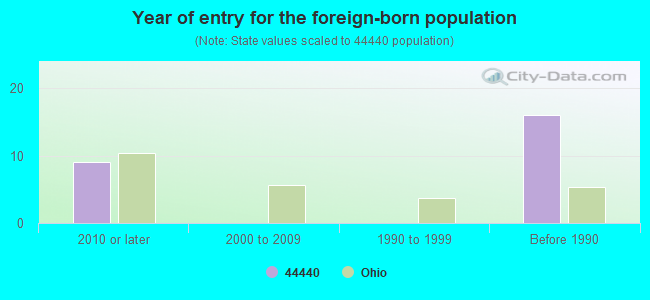
Foreign born population: 18 (0.4%) (100.0% of them are naturalized citizens)
This zip code:
0.4%
Whole state:
5.0%
50%Ukraine
39%Serbia
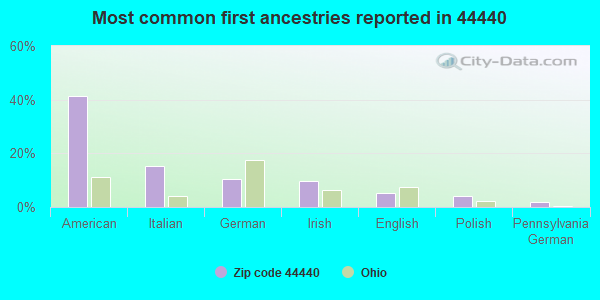
41%American
15%Italian
10%German
10%Irish
5%English
4%Polish
2%Pennsylvania German
Year of entry for the foreign-born population
92010 or later
02000 to 2009
01990 to 1999
16Before 1990
Facilities with environmental interests located in this zip code:
AUTO SPECIALTY (3798 MAIN ST in MINERAL RIDGE, OH)
STATE MASTER (Ohio general info) - RCRA-OHD986998409, HAZARDOUS WASTE PROGRAM Small Quantity Generators, between 100 kg and 1000 kg of hazardous waste/month (Resource Conservation and Recovery Act (tracking hazardous waste)) - notification Organizations: BEAZELL JAMES M AND LILLIAN E (CONTACT/OWNER)
Housing units lacking complete plumbing facilities: 2.2% Housing units lacking complete kitchen facilities: 1.8%
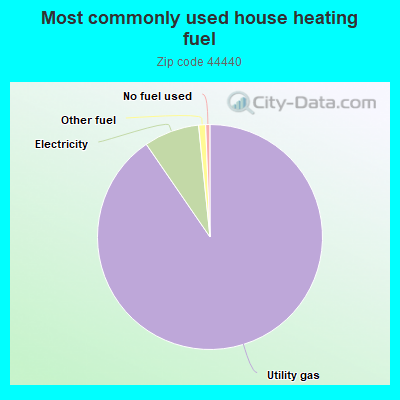
89.8%Utility gas
7.9%Electricity
1.0%Other fuel
0.6%No fuel used
Population in 1990: 921. Population change in the 1990s: +3,560 (+386.5%).
Place of birth for U.S.-born residents:
This state: 3,900
Northeast: 435
Midwest: 93
South: 253
West: 102
62% of the 44440 zip code residents lived in the same house 5 years ago. Out of people who lived in different houses, 63% lived in this county. Out of people who lived in different counties, 50% lived in Ohio.
87% of the 44440 zip code residents lived in the same house 1 year ago. Out of people who lived in different houses, 51% moved from this county. Out of people who lived in different houses, 14% moved from different county within same state. Out of people who lived in different houses, 33% moved from different state.
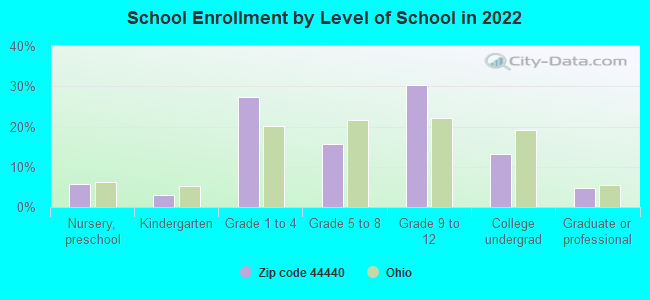
Private vs. public school enrollment:
Students in private schools in grades 1 to 8 (elementary and middle school): 24
Here:
8.4%
Ohio:
16.0%
Students in private schools in grades 9 to 12 (high school): 23
Here:
11.4%
Ohio:
13.1%
Students in private undergraduate colleges: 5
Here:
6.2%
Ohio:
22.3%
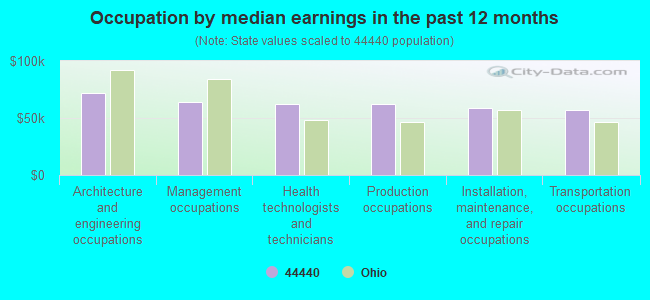
Occupation by median earnings in the past 12 months ($)
71,892Architecture and engineering occupations
63,635Management occupations
62,154Health technologists and technicians
61,999Production occupations
58,680Installation, maintenance, and repair occupations
56,758Transportation occupations
Top industries in this zip code by the number of employees in 2005:
Health Care and Social Assistance: Nursing Care Facilities (100-249 employees: 1 establishment)
Construction: Commercial and Institutional Building Construction (50-99: 1, 20-49: 1)
Wholesale Trade: Metal Service Centers and Other Metal Merchant Wholesalers (20-49: 1, 1-4: 1)
Administrative and Support and Waste Management and Remediation Services: Temporary Help Services (20-49: 1)
Wholesale Trade: Plumbing and Heating Equipment and Supplies (Hydronics) Merchant Wholesalers (20-49: 1)
Construction: Electrical Contractors (20-49: 1)
Other Services (except Public Administration): Religious Organizations (10-19: 1, 5-9: 1, 1-4: 3)
Management of Companies and Enterprises: Corporate, Subsidiary, and Regional Managing Offices (10-19: 1)
People in group quarters in 2010:
159 people in nursing facilities/skilled-nursing facilities
109 people in residential treatment centers for adults
8 people in group homes intended for adults
People in group quarters in 2000:
208 people in nursing homes
102 people in homes for the mentally retarded
Fatal accident statistics in 2011:
Fatal accident count: 2
Vehicles involved in fatal accidents: 2
Fatal accidents caused by drunken drivers: 1
Fatalities: 2
Persons involved in fatal accidents: 3
Pedestrians involved in fatal accidents: 0
Fatal accident statistics in 2010:
Fatal accident count: 1
Vehicles involved in fatal accidents: 1
Fatal accidents caused by drunken drivers: 1
Fatalities: 1
Persons involved in fatal accidents: 1
Pedestrians involved in fatal accidents: 0
Home Mortgage Disclosure Act Aggregated Statistics For Year 2009 (Based on 6 partial tracts)
A) FHA, FSA/RHS & VA Home Purchase Loans
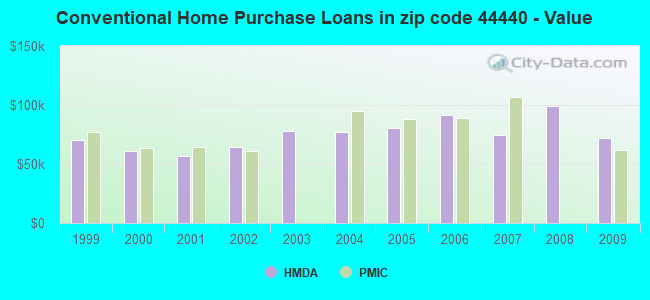
B) Conventional Home Purchase Loans
C) Refinancings
D) Home Improvement Loans
F) Non-occupant Loans on < 5 Family Dwellings (A B C & D)
G) Loans On Manufactured Home Dwelling (A B C & D)
Number
Average Value
Number
Average Value
Number
Average Value
Number
Average Value
Number
Average Value
Number
Average Value
LOANS ORIGINATED
17
$97,726
12
$72,174
77
$102,932
4
$29,345
5
$69,212
1
$16,940
APPLICATIONS APPROVED, NOT ACCEPTED
0
$0
0
$0
5
$124,818
2
$12,660
1
$1,270
0
$0
APPLICATIONS DENIED
4
$77,685
8
$76,535
48
$100,967
14
$55,758
3
$98,690
2
$38,000
APPLICATIONS WITHDRAWN
2
$163,235
0
$0
25
$95,658
0
$0
2
$31,410
0
$0
FILES CLOSED FOR INCOMPLETENESS
1
$93,240
1
$27,160
4
$93,775
0
$0
1
$14,580
0
$0
Aggregated Statistics For Year 2008 (Based on 6 partial tracts)
A) FHA, FSA/RHS & VA Home Purchase Loans
B) Conventional Home Purchase Loans
C) Refinancings
D) Home Improvement Loans
F) Non-occupant Loans on < 5 Family Dwellings (A B C & D)
G) Loans On Manufactured Home Dwelling (A B C & D)
Number
Average Value
Number
Average Value
Number
Average Value
Number
Average Value
Number
Average Value
Number
Average Value
LOANS ORIGINATED
19
$83,155
27
$98,862
69
$91,450
17
$26,628
12
$59,205
1
$32,060
APPLICATIONS APPROVED, NOT ACCEPTED
1
$80,170
2
$28,670
9
$79,169
4
$8,618
3
$52,713
1
$31,620
APPLICATIONS DENIED
3
$73,367
9
$120,912
85
$88,748
20
$23,159
3
$84,970
2
$8,320
APPLICATIONS WITHDRAWN
2
$73,880
2
$55,550
22
$100,500
6
$55,388
1
$162,600
0
$0
FILES CLOSED FOR INCOMPLETENESS
0
$0
1
$27,250
3
$91,223
1
$21,590
0
$0
0
$0
Aggregated Statistics For Year 2007 (Based on 6 partial tracts)
A) FHA, FSA/RHS & VA Home Purchase Loans
B) Conventional Home Purchase Loans
C) Refinancings
D) Home Improvement Loans
E) Loans on Dwellings For 5+ Families
F) Non-occupant Loans on < 5 Family Dwellings (A B C & D)
G) Loans On Manufactured Home Dwelling (A B C & D)
Number
Average Value
Number
Average Value
Number
Average Value
Number
Average Value
Number
Average Value
Number
Average Value
Number
Average Value
LOANS ORIGINATED
11
$82,305
52
$74,868
86
$81,359
25
$41,633
0
$0
9
$60,171
5
$36,700
APPLICATIONS APPROVED, NOT ACCEPTED
0
$0
5
$69,274
31
$76,310
4
$22,965
1
$677,520
2
$75,415
0
$0
APPLICATIONS DENIED
3
$61,790
20
$66,334
127
$92,296
24
$45,065
1
$78,590
6
$88,925
7
$30,871
APPLICATIONS WITHDRAWN
1
$97,160
10
$53,408
36
$98,502
2
$46,205
0
$0
2
$65,445
0
$0
FILES CLOSED FOR INCOMPLETENESS
1
$36,130
2
$117,975
6
$99,448
0
$0
0
$0
1
$177,130
0
$0
Aggregated Statistics For Year 2006 (Based on 6 partial tracts)
A) FHA, FSA/RHS & VA Home Purchase Loans
B) Conventional Home Purchase Loans
C) Refinancings
D) Home Improvement Loans
E) Loans on Dwellings For 5+ Families
F) Non-occupant Loans on < 5 Family Dwellings (A B C & D)
G) Loans On Manufactured Home Dwelling (A B C & D)
Number
Average Value
Number
Average Value
Number
Average Value
Number
Average Value
Number
Average Value
Number
Average Value
Number
Average Value
LOANS ORIGINATED
11
$78,328
85
$91,232
115
$73,120
25
$37,166
1
$63,380
21
$64,691
8
$34,640
APPLICATIONS APPROVED, NOT ACCEPTED
0
$0
11
$78,310
24
$83,826
5
$28,322
1
$60,840
5
$54,246
0
$0
APPLICATIONS DENIED
2
$104,895
33
$76,492
116
$93,009
29
$23,879
0
$0
10
$115,976
12
$34,748
APPLICATIONS WITHDRAWN
0
$0
8
$84,449
65
$88,555
6
$28,142
0
$0
3
$83,580
0
$0
FILES CLOSED FOR INCOMPLETENESS
0
$0
1
$106,470
16
$108,528
1
$6,340
0
$0
0
$0
0
$0
Aggregated Statistics For Year 2005 (Based on 6 partial tracts)
A) FHA, FSA/RHS & VA Home Purchase Loans
B) Conventional Home Purchase Loans
C) Refinancings
D) Home Improvement Loans
F) Non-occupant Loans on < 5 Family Dwellings (A B C & D)
G) Loans On Manufactured Home Dwelling (A B C & D)
Number
Average Value
Number
Average Value
Number
Average Value
Number
Average Value
Number
Average Value
Number
Average Value
LOANS ORIGINATED
12
$94,227
99
$80,350
143
$89,538
36
$39,657
13
$79,297
16
$16,797
APPLICATIONS APPROVED, NOT ACCEPTED
0
$0
19
$90,647
35
$92,027
2
$27,530
1
$44,050
1
$19,200
APPLICATIONS DENIED
0
$0
19
$79,652
147
$84,381
27
$28,383
7
$61,603
7
$20,284
APPLICATIONS WITHDRAWN
0
$0
10
$90,875
90
$110,009
13
$128,501
5
$106,662
0
$0
FILES CLOSED FOR INCOMPLETENESS
0
$0
4
$110,812
19
$112,717
0
$0
0
$0
0
$0
Aggregated Statistics For Year 2004 (Based on 6 partial tracts)
A) FHA, FSA/RHS & VA Home Purchase Loans
B) Conventional Home Purchase Loans
C) Refinancings
D) Home Improvement Loans
E) Loans on Dwellings For 5+ Families
F) Non-occupant Loans on < 5 Family Dwellings (A B C & D)
G) Loans On Manufactured Home Dwelling (A B C & D)
Number
Average Value
Number
Average Value
Number
Average Value
Number
Average Value
Number
Average Value
Number
Average Value
Number
Average Value
LOANS ORIGINATED
17
$77,486
88
$77,213
147
$84,082
31
$42,176
1
$17,110
22
$72,800
7
$19,121
APPLICATIONS APPROVED, NOT ACCEPTED
0
$0
8
$86,636
39
$88,155
4
$40,548
0
$0
2
$49,305
2
$20,890
APPLICATIONS DENIED
2
$65,460
33
$53,606
127
$87,725
39
$22,306
0
$0
6
$69,258
15
$28,035
APPLICATIONS WITHDRAWN
0
$0
12
$62,959
74
$91,298
9
$44,391
0
$0
5
$33,716
3
$41,927
FILES CLOSED FOR INCOMPLETENESS
0
$0
4
$62,052
21
$87,945
1
$12,590
0
$0
1
$54,700
0
$0
Aggregated Statistics For Year 2003 (Based on 6 partial tracts)
A) FHA, FSA/RHS & VA Home Purchase Loans
B) Conventional Home Purchase Loans
C) Refinancings
D) Home Improvement Loans
F) Non-occupant Loans on < 5 Family Dwellings (A B C & D)
Number
Average Value
Number
Average Value
Number
Average Value
Number
Average Value
Number
Average Value
LOANS ORIGINATED
19
$78,217
84
$77,883
267
$77,689
31
$29,622
15
$55,777
APPLICATIONS APPROVED, NOT ACCEPTED
0
$0
12
$48,703
59
$81,593
4
$16,690
2
$49,200
APPLICATIONS DENIED
1
$60,740
17
$44,816
158
$78,152
18
$12,157
5
$57,022
APPLICATIONS WITHDRAWN
1
$123,790
15
$70,340
82
$94,914
4
$39,560
4
$48,398
FILES CLOSED FOR INCOMPLETENESS
0
$0
4
$54,210
17
$90,903
0
$0
0
$0
Aggregated Statistics For Year 2002 (Based on 2 partial tracts)
A) FHA, FSA/RHS & VA Home Purchase Loans
B) Conventional Home Purchase Loans
C) Refinancings
D) Home Improvement Loans
F) Non-occupant Loans on < 5 Family Dwellings (A B C & D)
Number
Average Value
Number
Average Value
Number
Average Value
Number
Average Value
Number
Average Value
LOANS ORIGINATED
6
$74,145
22
$64,706
56
$62,356
5
$17,456
12
$51,482
APPLICATIONS APPROVED, NOT ACCEPTED
0
$0
2
$53,490
18
$74,161
1
$6,570
3
$86,367
APPLICATIONS DENIED
0
$0
4
$51,095
45
$70,595
5
$11,218
1
$91,380
APPLICATIONS WITHDRAWN
0
$0
2
$93,160
24
$71,090
2
$8,345
1
$22,710
FILES CLOSED FOR INCOMPLETENESS
0
$0
0
$0
6
$67,898
0
$0
1
$107,520
Aggregated Statistics For Year 2001 (Based on 2 partial tracts)
A) FHA, FSA/RHS & VA Home Purchase Loans
B) Conventional Home Purchase Loans
C) Refinancings
D) Home Improvement Loans
F) Non-occupant Loans on < 5 Family Dwellings (A B C & D)
Number
Average Value
Number
Average Value
Number
Average Value
Number
Average Value
Number
Average Value
LOANS ORIGINATED
7
$62,967
18
$56,848
53
$56,857
10
$12,722
9
$45,053
APPLICATIONS APPROVED, NOT ACCEPTED
0
$0
3
$58,640
17
$63,137
3
$18,697
0
$0
APPLICATIONS DENIED
0
$0
5
$41,532
48
$68,212
9
$13,832
3
$39,033
APPLICATIONS WITHDRAWN
0
$0
3
$50,890
23
$65,117
0
$0
1
$65,660
FILES CLOSED FOR INCOMPLETENESS
0
$0
0
$0
3
$72,230
0
$0
0
$0
Aggregated Statistics For Year 2000 (Based on 2 partial tracts)
A) FHA, FSA/RHS & VA Home Purchase Loans
B) Conventional Home Purchase Loans
C) Refinancings
D) Home Improvement Loans
F) Non-occupant Loans on < 5 Family Dwellings (A B C & D)
Number
Average Value
Number
Average Value
Number
Average Value
Number
Average Value
Number
Average Value
LOANS ORIGINATED
9
$64,964
21
$60,778
23
$55,006
7
$19,113
6
$47,470
APPLICATIONS APPROVED, NOT ACCEPTED
1
$32,560
1
$77,160
11
$62,033
4
$11,080
1
$11,490
APPLICATIONS DENIED
0
$0
7
$43,893
27
$51,994
7
$22,591
2
$25,855
APPLICATIONS WITHDRAWN
0
$0
3
$52,167
12
$58,732
0
$0
1
$80,160
FILES CLOSED FOR INCOMPLETENESS
0
$0
1
$41,860
3
$72,320
0
$0
0
$0
Aggregated Statistics For Year 1999 (Based on 2 partial tracts)
A) FHA, FSA/RHS & VA Home Purchase Loans
B) Conventional Home Purchase Loans
C) Refinancings
D) Home Improvement Loans
F) Non-occupant Loans on < 5 Family Dwellings (A B C & D)
2002 - 2018 National Fire Incident Reporting System (NFIRS) incidents
According to the data from the years 2002 - 2018 the average number of fire incidents per year is 15. The highest number of reported fire incidents - 23 took place in 2004, and the least - 9 in 2002. The data has a rising trend.
When looking into fire subcategories, the most incidents belonged to: Structure Fires (53.2%), and Outside Fires (29.4%).
Fire incident types reported to NFIRS in Zip Code 44440


 Nearest zip codes: 44515, 44446, 44437, 44451, 44481, 44484.


 According to the data from the years 2002 - 2018 the average number of fire incidents per year is 15. The highest number of reported fire incidents - 23 took place in 2004, and the least - 9 in 2002. The data has a rising trend.
 When looking into fire subcategories, the most incidents belonged to: Structure Fires (53.2%), and Outside Fires (29.4%).