Estimated zip code population in 2022: 4,631 Zip code population in 2010: 4,791 Zip code population in 2000: 5,087
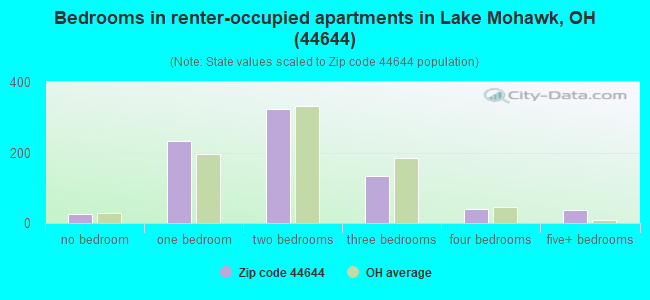
Houses and condos: 2,406 Renter-occupied apartments: 796
% of renters here:
36%
State:
33%
March 2022 cost of living index in zip code 44644: 89.8 (less than average, U.S. average is 100)
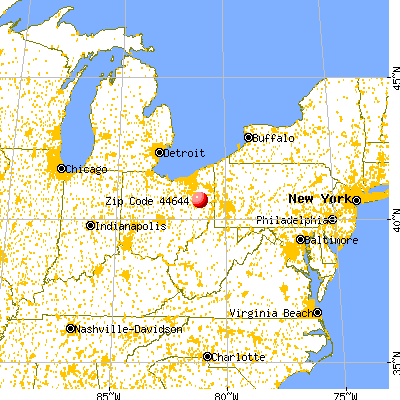
Land area: 22.1 sq. mi. Water area: 0.8 sq. mi.
Population density: 209 people per square mile
(very low).
OSM Map
General Map
Google Map
MSN Map
OSM Map
General Map
Google Map
MSN Map
OSM Map
General Map
Google Map
MSN Map
OSM Map
General Map
Google Map
MSN Map
Please wait while loading the map...
Real estate property taxes paid for housing units in 2022:
This zip code:
1.1% ($2,002)
Ohio:
1.3% ($2,639)
Median real estate property taxes paid for housing units with mortgages in 2022: $2,532 (1.3%) Median real estate property taxes paid for housing units with no mortgage in 2022: $1,588 (1.0%)
Estimated median house/condo value in 2022: $180,606
44644:
$180,606
Ohio:
$204,100
According to our research of Ohio and other state lists, there were 8 registered sex offenders living in 44644 zip code as of June 15, 2024. The ratio of all residents to sex offenders in zip code 44644 is 589 to 1. The ratio of registered sex offenders to all residents in this zip code is near the state average.
Median resident age:
This zip code:
50.7 years
Ohio median age:
39.9 years
Average household size:
This zip code:
2.1 people
Ohio:
2.4 people
Averages for the 2020 tax year for zip code 44644, filed in 2021:
Average Adjusted Gross Income (AGI) in 2020: $62,581 (Individual Income Tax Returns)
Here:
$62,581
State:
$67,288
Salary/wage: $48,907 (reported on 78.4% of returns)
Here:
$48,907
State:
$55,628
(% of AGI for various income ranges: 1080.4% for AGIs below $25k, 3053.5% for AGIs $25k-50k, 6013.5% for AGIs $50k-75k, 9648.5% for AGIs $75k-100k, 15538.0% for AGIs $100k-200k, 64625.0% for AGIs over 200k)
Taxable interest for individuals: $1,185 (reported on 29.7% of returns)
This zip code:
$1,185
Ohio:
$1,518
(% of AGI for various income ranges: 12.3% for AGIs below $25k, 12.9% for AGIs $25k-50k, 33.5% for AGIs $50k-75k, 19.2% for AGIs $75k-100k, 176.7% for AGIs $100k-200k, 1385.0% for AGIs over 200k)
Ordinary dividends: $5,768 (reported on 18.5% of returns)
Here:
$5,768
State:
$7,167
(% of AGI for various income ranges: 26.6% for AGIs below $25k, 26.5% for AGIs $25k-50k, 73.5% for AGIs $50k-75k, 72.3% for AGIs $75k-100k, 377.3% for AGIs $100k-200k, 6215.0% for AGIs over 200k)
Net capital gain/loss in AGI: +$12,819 (reported on 16.2% of returns)
Here:
+$12,819
State:
+$18,919
(% of AGI for various income ranges: 10.8% for AGIs below $25k, 26.3% for AGIs $25k-50k, 93.5% for AGIs $50k-75k, 90.0% for AGIs $75k-100k, 1236.7% for AGIs $100k-200k, 11070.0% for AGIs over 200k)
Profit/loss from business: +$16,367 (reported on 13.5% of returns)
Here:
+$16,367
State:
+$13,744
(% of AGI for various income ranges: 85.3% for AGIs below $25k, 77.3% for AGIs $25k-50k, 270.0% for AGIs $50k-75k, 360.8% for AGIs $75k-100k, 883.3% for AGIs $100k-200k, 7915.0% for AGIs over 200k)
Taxable individual retirement arrangement distribution: $21,473 (reported on 11.7% of returns)
44644:
$21,473
Ohio:
$18,876
(% of AGI for various income ranges: 90.8% for AGIs below $25k, 142.4% for AGIs $25k-50k, 269.2% for AGIs $50k-75k, 401.5% for AGIs $75k-100k, 2121.3% for AGIs $100k-200k)
Total itemized deductions: $27,382 (reported on 5.0% of returns)
Here:
$27,382
State:
$33,869
(% of AGI for various income ranges: 434.6% for AGIs $50k-75k, 415.3% for AGIs $100k-200k, 6295.0% for AGIs over 200k)
Charity contributions: $11,533 (reported on 4.1% of returns)
Here:
$11,533
State:
$14,577
(% of AGI for various income ranges: 97.3% for AGIs $50k-75k, 127.3% for AGIs $100k-200k, 2970.0% for AGIs over 200k)
Taxes paid: $6,791 (reported on 5.0% of returns)
44644:
$6,791
State:
$7,681
(% of AGI for various income ranges: 95.8% for AGIs $50k-75k, 147.3% for AGIs $100k-200k, 1385.0% for AGIs over 200k)
Earned income credit: $2,236 (reported on 14.9% of returns)
Here:
$2,236
State:
$2,304
(% of AGI for various income ranges: 83.6% for AGIs below $25k, 60.2% for AGIs $25k-50k)
Percentage of individuals using paid preparers for their 2020 taxes: 93.7%
Here:
94%
State:
94%
(% for various income ranges: 93.1% for AGIs below $25k, 94.9% for AGIs $25k-50k, 91.9% for AGIs $50k-75k, 94.7% for AGIs $75k-100k, 96.3% for AGIs $100k-200k, 87.5% for AGIs over 200k)
Averages for the 2012 tax year for zip code 44644, filed in 2013:
Average Adjusted Gross Income (AGI) in 2012: $48,964 (Individual Income Tax Returns)
Here:
$48,964
State:
$54,926
Salary/wage: $39,556 (reported on 83.7% of returns)
Here:
$39,556
State:
$45,869
(% of AGI for various income ranges: 74.7% for AGIs below $25k, 71.5% for AGIs $25k-50k, 76.5% for AGIs $50k-75k, 75.5% for AGIs $75k-100k, 63.1% for AGIs $100k-200k, 45.2% for AGIs over 200k)
Taxable interest for individuals: $1,007 (reported on 30.8% of returns)
This zip code:
$1,007
Ohio:
$1,297
(% of AGI for various income ranges: 1.1% for AGIs below $25k, 0.4% for AGIs $25k-50k, 0.3% for AGIs $50k-75k, 0.6% for AGIs $75k-100k, 0.6% for AGIs $100k-200k, 1.1% for AGIs over 200k)
Ordinary dividends: $4,118 (reported on 17.2% of returns)
Here:
$4,118
State:
$5,821
(% of AGI for various income ranges: 1.2% for AGIs below $25k, 0.8% for AGIs $25k-50k, 0.6% for AGIs $50k-75k, 1.6% for AGIs $75k-100k, 1.8% for AGIs $100k-200k, 2.9% for AGIs over 200k)
Net capital gain/loss in AGI: +$5,929 (reported on 12.3% of returns)
Here:
+$5,929
State:
+$11,232
(% of AGI for various income ranges: 0.3% for AGIs $25k-50k, 0.2% for AGIs $50k-75k, 0.6% for AGIs $75k-100k, 2.9% for AGIs $100k-200k, 4.8% for AGIs over 200k)
Profit/loss from business: +$12,372 (reported on 14.1% of returns)
Here:
+$12,372
State:
+$12,773
(% of AGI for various income ranges: 4.3% for AGIs below $25k, 2.4% for AGIs $25k-50k, 2.8% for AGIs $50k-75k, 2.2% for AGIs $75k-100k, 9.3% for AGIs $100k-200k)
Taxable individual retirement arrangement distribution: $11,396 (reported on 10.6% of returns)
44644:
$11,396
Ohio:
$14,511
(% of AGI for various income ranges: 2.7% for AGIs below $25k, 3.4% for AGIs $25k-50k, 2.2% for AGIs $50k-75k, 2.5% for AGIs $75k-100k, 3.7% for AGIs $100k-200k)
Total itemized deductions: $18,605 (19% of AGI, reported on 25.6% of returns)
Here:
$18,605
State:
$21,278
Here:
18.9% of AGI
State:
18.8% of AGI
(% of AGI for various income ranges: 5.8% for AGIs below $25k, 6.8% for AGIs $25k-50k, 8.8% for AGIs $50k-75k, 11.6% for AGIs $75k-100k, 13.1% for AGIs $100k-200k, 11.0% for AGIs over 200k)
Charity contributions: $3,173 (reported on 19.4% of returns)
Here:
$3,173
State:
$3,943
(% of AGI for various income ranges: 0.5% for AGIs below $25k, 0.5% for AGIs $25k-50k, 0.9% for AGIs $50k-75k, 1.5% for AGIs $75k-100k, 1.8% for AGIs $100k-200k, 2.1% for AGIs over 200k)
Taxes paid: $6,936 (reported on 25.6% of returns)
44644:
$6,936
State:
$9,568
(% of AGI for various income ranges: 0.9% for AGIs below $25k, 1.8% for AGIs $25k-50k, 2.9% for AGIs $50k-75k, 3.9% for AGIs $75k-100k, 5.3% for AGIs $100k-200k, 6.3% for AGIs over 200k)
Earned income credit: $2,142 (reported on 17.6% of returns)
Here:
$2,142
State:
$2,285
(% of AGI for various income ranges: 5.9% for AGIs below $25k, 0.9% for AGIs $25k-50k)
Percentage of individuals using paid preparers for their 2012 taxes: 59.5%
Here:
59%
State:
51%
(% for various income ranges: 54.9% for AGIs below $25k, 60.3% for AGIs $25k-50k, 56.8% for AGIs $50k-75k, 70.0% for AGIs $75k-100k, 68.8% for AGIs $100k-200k, 80.0% for AGIs over 200k)
Averages for the 2004 tax year for zip code 44644, filed in 2005:
Average Adjusted Gross Income (AGI) in 2004: $38,467 (Individual Income Tax Returns)
Here:
$38,467
State:
$44,480
Salary/wage: $33,009 (reported on 87.3% of returns)
Here:
$33,009
State:
$39,198
(% of AGI for various income ranges: 97.5% for AGIs below $10k, 78.5% for AGIs $10k-25k, 79.7% for AGIs $25k-50k, 83.2% for AGIs $50k-75k, 79.6% for AGIs $75k-100k, 53.2% for AGIs over 100k)
Taxable interest for individuals: $1,189 (reported on 38.5% of returns)
This zip code:
$1,189
Ohio:
$1,532
(% of AGI for various income ranges: 4.7% for AGIs below $10k, 1.0% for AGIs $10k-25k, 0.8% for AGIs $25k-50k, 0.8% for AGIs $50k-75k, 0.6% for AGIs $75k-100k, 2.4% for AGIs over 100k)
Taxable dividends: $2,769 (reported on 20.6% of returns)
Here:
$2,769
State:
$3,496
(% of AGI for various income ranges: 4.2% for AGIs below $10k, 0.9% for AGIs $10k-25k, 0.6% for AGIs $25k-50k, 0.7% for AGIs $50k-75k, 1.4% for AGIs $75k-100k, 3.6% for AGIs over 100k)
Net capital gain/loss: +$3,383 (reported on 14.2% of returns)
Here:
+$3,383
State:
+$8,582
(% of AGI for various income ranges: -2.2% for AGIs below $10k, 0.2% for AGIs $10k-25k, 0.5% for AGIs $25k-50k, 1.1% for AGIs $50k-75k, 0.8% for AGIs $75k-100k, 3.5% for AGIs over 100k)
Profit/loss from business: +$10,571 (reported on 14.0% of returns)
Here:
+$10,571
State:
+$10,813
(% of AGI for various income ranges: 5.6% for AGIs below $10k, 3.7% for AGIs $10k-25k, 2.7% for AGIs $25k-50k, 2.9% for AGIs $50k-75k, 3.6% for AGIs $75k-100k, 6.4% for AGIs over 100k)
IRA payment deduction: $3,365 (reported on 2.6% of returns)
44644:
$3,365
Ohio:
$2,794
Self-employed pension: $12,000 (reported on 0.6% of returns)
Here:
$12,000
Ohio:
$13,981
Total itemized deductions: $15,462 (22% of AGI, reported on 28.4% of returns)
Here:
$15,462
State:
$17,503
Here:
22.0% of AGI
State:
20.8% of AGI
(% of AGI for various income ranges: 11.8% for AGIs below $10k, 5.1% for AGIs $10k-25k, 9.9% for AGIs $25k-50k, 12.0% for AGIs $50k-75k, 12.8% for AGIs $75k-100k, 15.3% for AGIs over 100k)
Charity contributions deductions: $2,501 (3% of AGI, reported on 22.7% of returns)
Here:
$2,501
State:
$3,087
Here:
3.3% of AGI
State:
3.4% of AGI
(% of AGI for various income ranges: 0.4% for AGIs below $10k, 0.3% for AGIs $10k-25k, 1.0% for AGIs $25k-50k, 1.5% for AGIs $50k-75k, 1.5% for AGIs $75k-100k, 2.8% for AGIs over 100k)
Total tax: $5,146 (reported on 74.9% of returns)
44644:
$5,146
State:
$6,781
(% of AGI for various income ranges: 2.5% for AGIs below $10k, 4.3% for AGIs $10k-25k, 7.2% for AGIs $25k-50k, 9.2% for AGIs $50k-75k, 11.3% for AGIs $75k-100k, 17.5% for AGIs over 100k)
Earned income credit: $1,595 (reported on 14.6% of returns)
Here:
$1,595
State:
$1,696
Percentage of individuals using paid preparers for their 2004 taxes: 57.7%
Here:
58%
State:
55%
(% for various income ranges: 49.2% for AGIs below $10k, 56.8% for AGIs $10k-25k, 59.4% for AGIs $25k-50k, 60.4% for AGIs $50k-75k, 58.0% for AGIs $75k-100k, 76.9% for AGIs over 100k)
Household received Food Stamps/SNAP in the past 12 months: 372 Household did not receive Food Stamps/SNAP in the past 12 months: 1,842
Women who had a birth in the past 12 months: 98 (56 now married, 41 unmarried) Women who did not have a birth in the past 12 months: 692 (274 now married, 418 unmarried)
Housing units in zip code 44644 with a mortgage: 734 (77 second mortgage, 79 both second mortgage and home equity loan) Houses without a mortgage: 61
Median monthly owner costs for units with a mortgage: $1,362 Median monthly owner costs for units without a mortgage: $466
Residents with income below the poverty level in 2022:
This zip code:
15.8%
Whole state:
13.4%
Residents with income below 50% of the poverty level in 2022:
This zip code:
8.8%
Whole state:
7.0%
Median number of rooms in houses and condos:
Here:
6.6
State:
6.7
Median number of rooms in apartments:
Here:
4.2
State:
4.4
Notable locations in this zip code not listed on our city pages
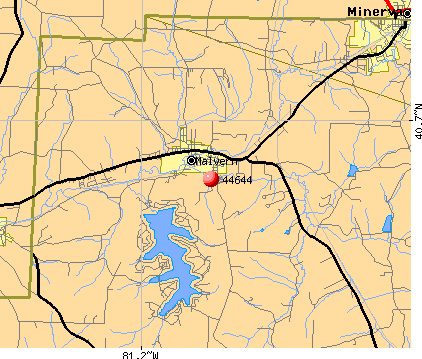
Notable locations in zip code 44644: YMCA Camp (A), Village of Malvern Fire Department (B), Brown Township Fire Department (C). Display/hide their locations on the map
In group quarters: 28 (-1 institutionalized population)
Size of family households: 720 2-persons, 198 3-persons, 118 4-persons, 80 5-persons, 126 6-persons, 5 7-or-more-persons
Size of nonfamily households: 881 1-person, 77 2-persons, 8 3-persons
515 married couples with children.
320 single-parent households (23 men, 297 women).
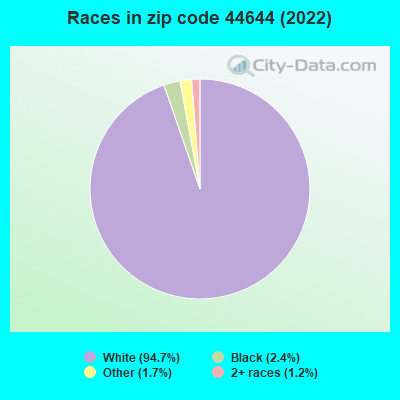
97.9% of residents of 44644 zip code speak English at home.
0.9% of residents speak Spanish at home (100% very well).
1.7% of residents speak other Indo-European language at home (18% very well, 82% well).
0.1% of residents speak other language at home (100% very well).
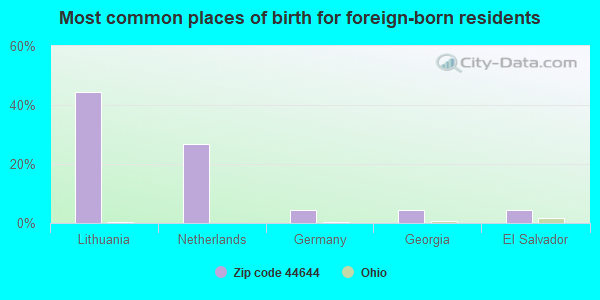
Foreign born population: 44 (1.0%) (48.2% of them are naturalized citizens)
This zip code:
1.0%
Whole state:
5.0%
44%Lithuania
27%Netherlands
4%Germany
4%Georgia
4%El Salvador
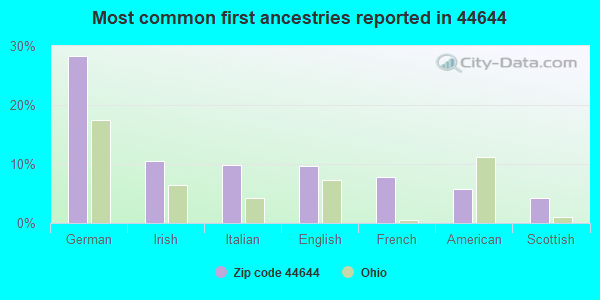
28%German
10%Irish
10%Italian
10%English
8%French
6%American
4%Scottish
Year of entry for the foreign-born population
122010 or later
92000 to 2009
01990 to 1999
42Before 1990
Facilities with environmental interests located in this zip code:
(Integrated Compliance Information System) - ICIS-05-1985-0038, FORMAL ENFORCEMENT ACTION COMPLIANCE ACTIVITY (Tracking inspections of insecticide, fungicide, and rodenticide, and toxic substances) STATE MASTER (Ohio general info) - AIR MAJOR Business SIC classification: LUBRICATING OILS AND GREASES; PRODUCTS OF PETROLEUM AND COAL; REPAIR SHOPS AND RELATED SERVICES
BROWN TWP MALVERN SD (620 WEST CANAL STREET in MALVERN, OH)
National Pollutant Discharge Elimination System NON-MAJOR (Tracking pollutant discharge elimination systems) - permit National Pollutant Discharge Elimination System NON-MAJOR (Tracking pollutant discharge elimination systems) - permit Business SIC classification: SEWERAGE SYSTEMS Organizations: BOARD OF COMMISSIONERS (CONTACT/OWNER)
Alternative names: MALVERN, VILLAGE OF, VILLAGE OF MALVERN
Small Quantity Generators, between 100 kg and 1000 kg of hazardous waste/month (Resource Conservation and Recovery Act (tracking hazardous waste)) - notification Organizations: CERNY EMIL (CONTACT/OWNER)
Housing units lacking complete plumbing facilities: 2.5% Housing units lacking complete kitchen facilities: 2.4%
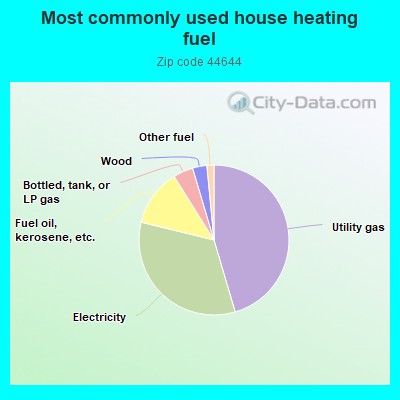
45.5%Utility gas
33.4%Electricity
12.3%Fuel oil, kerosene, etc.
4.3%Bottled, tank, or LP gas
3.1%Wood
1.5%Other fuel
Population in 1990: 4,761. Population change in the 1990s: +326 (+6.8%).
Place of birth for U.S.-born residents:
This state: 3,624
Northeast: 326
Midwest: 114
South: 311
West: 186
62% of the 44644 zip code residents lived in the same house 5 years ago. Out of people who lived in different houses, 46% lived in this county. Out of people who lived in different counties, 50% lived in Ohio.
95% of the 44644 zip code residents lived in the same house 1 year ago. Out of people who lived in different houses, 20% moved from this county. Out of people who lived in different houses, 35% moved from different county within same state. Out of people who lived in different houses, 56% moved from different state.
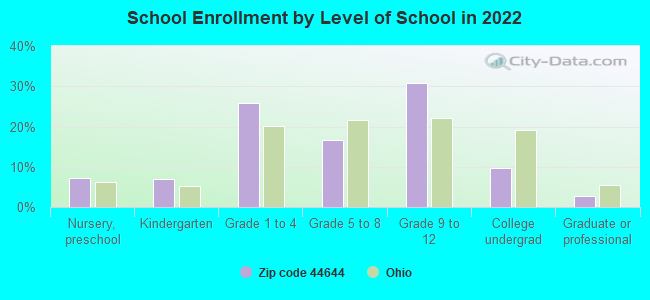
Private vs. public school enrollment:
Students in private schools in grades 1 to 8 (elementary and middle school): 7
Here:
2.0%
Ohio:
16.0%
Students in private schools in grades 9 to 12 (high school):
Here:
0.0%
Ohio:
13.1%
Students in private undergraduate colleges: 27
Here:
32.9%
Ohio:
22.3%
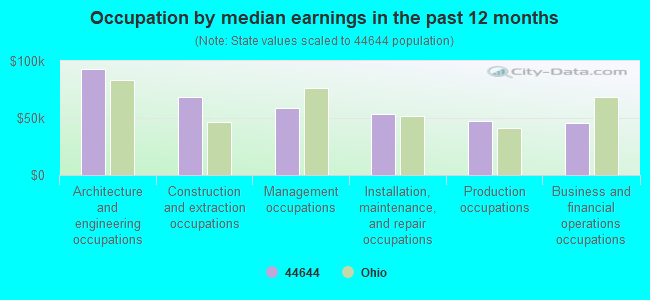
Occupation by median earnings in the past 12 months ($)
93,105Architecture and engineering occupations
68,831Construction and extraction occupations
58,667Management occupations
53,410Installation, maintenance, and repair occupations
47,726Production occupations
45,341Business and financial operations occupations
Top industries in this zip code by the number of employees in 2005:
Other Services (except Public Administration): Other Similar Organizations (except Business, Professional, Labor, and Political Organizations) (20-49: 1)
People in group quarters in 2010:
10 people in nursing facilities/skilled-nursing facilities
5 people in group homes intended for adults
Fatal accident statistics in 2014:
Fatal accident count: 2
Vehicles involved in fatal accidents: 4
Fatal accidents caused by drunken drivers: 0
Fatalities: 2
Persons involved in fatal accidents: 5
Pedestrians involved in fatal accidents: 0
Fatal accident statistics in 2013:
Fatal accident count: 1
Vehicles involved in fatal accidents: 3
Fatal accidents caused by drunken drivers: 0
Fatalities: 1
Persons involved in fatal accidents: 3
Pedestrians involved in fatal accidents: 0
2002 - 2018 National Fire Incident Reporting System (NFIRS) incidents
According to the data from the years 2002 - 2018 the average number of fire incidents per year is 24. The highest number of reported fire incidents - 39 took place in 2007, and the least - 12 in 2012. The data has a declining trend.
When looking into fire subcategories, the most reports belonged to: Structure Fires (46.6%), and Outside Fires (35.7%).
Fire incident types reported to NFIRS in Zip Code 44644


 Nearest zip codes: 44670, 44688, 44657, 44669, 44620, 44730.


 According to the data from the years 2002 - 2018 the average number of fire incidents per year is 24. The highest number of reported fire incidents - 39 took place in 2007, and the least - 12 in 2012. The data has a declining trend.
 When looking into fire subcategories, the most reports belonged to: Structure Fires (46.6%), and Outside Fires (35.7%).