Estimated zip code population in 2022: 16,359
Zip code population in 2010: 14,513
Zip code population in 2000: 12,747
Houses and condos: 5,507
Renter-occupied apartments: 1,277
% of renters here:
25%State:
33%
March 2022 cost of living index in zip code 44905: 90.1
(less than average, U.S. average is 100)
Land area: 12.7
sq. mi.
Water area: 0.0
sq. mi.
Population density: 1,286 people per square mile (low).
OSM Map
General Map
Google Map
MSN Map
OSM Map
General Map
Google Map
MSN Map
OSM Map
General Map
Google Map
MSN Map
OSM Map
General Map
Google Map
MSN Map
Please wait while loading the map...
Real estate property taxes paid for housing units in 2022:
This zip code:
1.2% ($1,451)Ohio:
1.3% ($2,639)
Median real estate property taxes paid for housing units with mortgages in 2022: $1,780 (1.3%)
Median real estate property taxes paid for housing units with no mortgage in 2022: $1,207 (1.2%)
Profiles of local businesses
Business Search - 14 Million verified businesses
Males: 10,508 Females: 5,854
For population 25 years and over in 44905:
High school or higher: 82.6%Bachelor's degree or higher: 7.7%Graduate or professional degree: 2.5%Unemployed: 4.6%Mean travel time to work (commute): 19.1 minutes
For population 15 years and over in 44905:
Never married: 39.6%Now married: 37.4%Separated: 2.3%Widowed: 5.9%Divorced: 14.8%
Zip code 44905 compared to state average:
Median house value below state average. Foreign-born population percentage significantly below state average. Length of stay since moving in significantly above state average. Percentage of population with a bachelor's degree or higher significantly below state average. 12,943 79.1% White 2,016 12.3% Black 640 3.9% Two or more races 583 3.6% Hispanic or Latino 68 0.4% Asian 56 0.3% Some other race 39 0.2% American Indian 8 0.05% Native Hawaiian and Other
Data:
Median household income ($)
Median household income (% change since 2000)
Household income diversity
Ratio of average income to average house value (%)
Ratio of average income to average rent
Median household income ($) - White
Median household income ($) - Black or African American
Median household income ($) - Asian
Median household income ($) - Hispanic or Latino
Median household income ($) - American Indian and Alaska Native
Median household income ($) - Multirace
Median household income ($) - Other Race
Median household income for houses/condos with a mortgage ($)
Median household income for apartments without a mortgage ($)
Races - White alone (%)
Races - White alone (% change since 2000)
Races - Black alone (%)
Races - Black alone (% change since 2000)
Races - American Indian alone (%)
Races - American Indian alone (% change since 2000)
Races - Asian alone (%)
Races - Asian alone (% change since 2000)
Races - Hispanic (%)
Races - Hispanic (% change since 2000)
Races - Native Hawaiian and Other Pacific Islander alone (%)
Races - Native Hawaiian and Other Pacific Islander alone (% change since 2000)
Races - Two or more races (%)
Races - Two or more races (% change since 2000)
Races - Other race alone (%)
Races - Other race alone (% change since 2000)
Racial diversity
Unemployment (%)
Unemployment (% change since 2000)
Unemployment (%) - White
Unemployment (%) - Black or African American
Unemployment (%) - Asian
Unemployment (%) - Hispanic or Latino
Unemployment (%) - American Indian and Alaska Native
Unemployment (%) - Multirace
Unemployment (%) - Other Race
Population density (people per square mile)
Population - Males (%)
Population - Females (%)
Population - Males (%) - White
Population - Males (%) - Black or African American
Population - Males (%) - Asian
Population - Males (%) - Hispanic or Latino
Population - Males (%) - American Indian and Alaska Native
Population - Males (%) - Multirace
Population - Males (%) - Other Race
Population - Females (%) - White
Population - Females (%) - Black or African American
Population - Females (%) - Asian
Population - Females (%) - Hispanic or Latino
Population - Females (%) - American Indian and Alaska Native
Population - Females (%) - Multirace
Population - Females (%) - Other Race
Coronavirus confirmed cases (Jun 19, 2024)
Deaths caused by coronavirus (Jun 19, 2024)
Coronavirus confirmed cases (per 100k population) (Jun 19, 2024)
Deaths caused by coronavirus (per 100k population) (Jun 19, 2024)
Daily increase in number of cases (Jun 19, 2024)
Weekly increase in number of cases (Jun 19, 2024)
Cases doubled (in days) (Jun 19, 2024)
Hospitalized patients (Apr 18, 2022)
Negative test results (Apr 18, 2022)
Total test results (Apr 18, 2022)
COVID Vaccine doses distributed (per 100k population) (Sep 19, 2023)
COVID Vaccine doses administered (per 100k population) (Sep 19, 2023)
COVID Vaccine doses distributed (Sep 19, 2023)
COVID Vaccine doses administered (Sep 19, 2023)
Likely homosexual households (%)
Likely homosexual households (% change since 2000)
Likely homosexual households - Lesbian couples (%)
Likely homosexual households - Lesbian couples (% change since 2000)
Likely homosexual households - Gay men (%)
Likely homosexual households - Gay men (% change since 2000)
Cost of living index
Median gross rent ($)
Median contract rent ($)
Median monthly housing costs ($)
Median house or condo value ($)
Median house or condo value ($ change since 2000)
Mean house or condo value by units in structure - 1, detached ($)
Mean house or condo value by units in structure - 1, attached ($)
Mean house or condo value by units in structure - 2 ($)
Mean house or condo value by units in structure by units in structure - 3 or 4 ($)
Mean house or condo value by units in structure - 5 or more ($)
Mean house or condo value by units in structure - Boat, RV, van, etc. ($)
Mean house or condo value by units in structure - Mobile home ($)
Median house or condo value ($) - White
Median house or condo value ($) - Black or African American
Median house or condo value ($) - Asian
Median house or condo value ($) - Hispanic or Latino
Median house or condo value ($) - American Indian and Alaska Native
Median house or condo value ($) - Multirace
Median house or condo value ($) - Other Race
Median resident age
Resident age diversity
Median resident age - Males
Median resident age - Females
Median resident age - White
Median resident age - Black or African American
Median resident age - Asian
Median resident age - Hispanic or Latino
Median resident age - American Indian and Alaska Native
Median resident age - Multirace
Median resident age - Other Race
Median resident age - Males - White
Median resident age - Males - Black or African American
Median resident age - Males - Asian
Median resident age - Males - Hispanic or Latino
Median resident age - Males - American Indian and Alaska Native
Median resident age - Males - Multirace
Median resident age - Males - Other Race
Median resident age - Females - White
Median resident age - Females - Black or African American
Median resident age - Females - Asian
Median resident age - Females - Hispanic or Latino
Median resident age - Females - American Indian and Alaska Native
Median resident age - Females - Multirace
Median resident age - Females - Other Race
Commute - mean travel time to work (minutes)
Travel time to work - Less than 5 minutes (%)
Travel time to work - Less than 5 minutes (% change since 2000)
Travel time to work - 5 to 9 minutes (%)
Travel time to work - 5 to 9 minutes (% change since 2000)
Travel time to work - 10 to 19 minutes (%)
Travel time to work - 10 to 19 minutes (% change since 2000)
Travel time to work - 20 to 29 minutes (%)
Travel time to work - 20 to 29 minutes (% change since 2000)
Travel time to work - 30 to 39 minutes (%)
Travel time to work - 30 to 39 minutes (% change since 2000)
Travel time to work - 40 to 59 minutes (%)
Travel time to work - 40 to 59 minutes (% change since 2000)
Travel time to work - 60 to 89 minutes (%)
Travel time to work - 60 to 89 minutes (% change since 2000)
Travel time to work - 90 or more minutes (%)
Travel time to work - 90 or more minutes (% change since 2000)
Marital status - Never married (%)
Marital status - Now married (%)
Marital status - Separated (%)
Marital status - Widowed (%)
Marital status - Divorced (%)
Median family income ($)
Median family income (% change since 2000)
Median non-family income ($)
Median non-family income (% change since 2000)
Median per capita income ($)
Median per capita income (% change since 2000)
Median family income ($) - White
Median family income ($) - Black or African American
Median family income ($) - Asian
Median family income ($) - Hispanic or Latino
Median family income ($) - American Indian and Alaska Native
Median family income ($) - Multirace
Median family income ($) - Other Race
Median year house/condo built
Median year apartment built
Year house built - Built 2005 or later (%)
Year house built - Built 2000 to 2004 (%)
Year house built - Built 1990 to 1999 (%)
Year house built - Built 1980 to 1989 (%)
Year house built - Built 1970 to 1979 (%)
Year house built - Built 1960 to 1969 (%)
Year house built - Built 1950 to 1959 (%)
Year house built - Built 1940 to 1949 (%)
Year house built - Built 1939 or earlier (%)
Average household size
Household density (households per square mile)
Average household size - White
Average household size - Black or African American
Average household size - Asian
Average household size - Hispanic or Latino
Average household size - American Indian and Alaska Native
Average household size - Multirace
Average household size - Other Race
Occupied housing units (%)
Vacant housing units (%)
Owner occupied housing units (%)
Renter occupied housing units (%)
Vacancy status - For rent (%)
Vacancy status - For sale only (%)
Vacancy status - Rented or sold, not occupied (%)
Vacancy status - For seasonal, recreational, or occasional use (%)
Vacancy status - For migrant workers (%)
Vacancy status - Other vacant (%)
Residents with income below the poverty level (%)
Residents with income below 50% of the poverty level (%)
Children below poverty level (%)
Poor families by family type - Married-couple family (%)
Poor families by family type - Male, no wife present (%)
Poor families by family type - Female, no husband present (%)
Poverty status for native-born residents (%)
Poverty status for foreign-born residents (%)
Poverty among high school graduates not in families (%)
Poverty among people who did not graduate high school not in families (%)
Residents with income below the poverty level (%) - White
Residents with income below the poverty level (%) - Black or African American
Residents with income below the poverty level (%) - Asian
Residents with income below the poverty level (%) - Hispanic or Latino
Residents with income below the poverty level (%) - American Indian and Alaska Native
Residents with income below the poverty level (%) - Multirace
Residents with income below the poverty level (%) - Other Race
Air pollution - Air Quality Index (AQI)
Air pollution - CO
Air pollution - NO2
Air pollution - SO2
Air pollution - Ozone
Air pollution - PM10
Air pollution - PM25
Air pollution - Pb
Crime - Murders per 100,000 population
Crime - Rapes per 100,000 population
Crime - Robberies per 100,000 population
Crime - Assaults per 100,000 population
Crime - Burglaries per 100,000 population
Crime - Thefts per 100,000 population
Crime - Auto thefts per 100,000 population
Crime - Arson per 100,000 population
Crime - City-data.com crime index
Crime - Violent crime index
Crime - Property crime index
Crime - Murders per 100,000 population (5 year average)
Crime - Rapes per 100,000 population (5 year average)
Crime - Robberies per 100,000 population (5 year average)
Crime - Assaults per 100,000 population (5 year average)
Crime - Burglaries per 100,000 population (5 year average)
Crime - Thefts per 100,000 population (5 year average)
Crime - Auto thefts per 100,000 population (5 year average)
Crime - Arson per 100,000 population (5 year average)
Crime - City-data.com crime index (5 year average)
Crime - Violent crime index (5 year average)
Crime - Property crime index (5 year average)
1996 Presidential Elections Results (%) - Democratic Party (Clinton)
1996 Presidential Elections Results (%) - Republican Party (Dole)
1996 Presidential Elections Results (%) - Other
2000 Presidential Elections Results (%) - Democratic Party (Gore)
2000 Presidential Elections Results (%) - Republican Party (Bush)
2000 Presidential Elections Results (%) - Other
2004 Presidential Elections Results (%) - Democratic Party (Kerry)
2004 Presidential Elections Results (%) - Republican Party (Bush)
2004 Presidential Elections Results (%) - Other
2008 Presidential Elections Results (%) - Democratic Party (Obama)
2008 Presidential Elections Results (%) - Republican Party (McCain)
2008 Presidential Elections Results (%) - Other
2012 Presidential Elections Results (%) - Democratic Party (Obama)
2012 Presidential Elections Results (%) - Republican Party (Romney)
2012 Presidential Elections Results (%) - Other
2016 Presidential Elections Results (%) - Democratic Party (Clinton)
2016 Presidential Elections Results (%) - Republican Party (Trump)
2016 Presidential Elections Results (%) - Other
2020 Presidential Elections Results (%) - Democratic Party (Biden)
2020 Presidential Elections Results (%) - Republican Party (Trump)
2020 Presidential Elections Results (%) - Other
Ancestries Reported - Arab (%)
Ancestries Reported - Czech (%)
Ancestries Reported - Danish (%)
Ancestries Reported - Dutch (%)
Ancestries Reported - English (%)
Ancestries Reported - French (%)
Ancestries Reported - French Canadian (%)
Ancestries Reported - German (%)
Ancestries Reported - Greek (%)
Ancestries Reported - Hungarian (%)
Ancestries Reported - Irish (%)
Ancestries Reported - Italian (%)
Ancestries Reported - Lithuanian (%)
Ancestries Reported - Norwegian (%)
Ancestries Reported - Polish (%)
Ancestries Reported - Portuguese (%)
Ancestries Reported - Russian (%)
Ancestries Reported - Scotch-Irish (%)
Ancestries Reported - Scottish (%)
Ancestries Reported - Slovak (%)
Ancestries Reported - Subsaharan African (%)
Ancestries Reported - Swedish (%)
Ancestries Reported - Swiss (%)
Ancestries Reported - Ukrainian (%)
Ancestries Reported - United States (%)
Ancestries Reported - Welsh (%)
Ancestries Reported - West Indian (%)
Ancestries Reported - Other (%)
Educational Attainment - No schooling completed (%)
Educational Attainment - Less than high school (%)
Educational Attainment - High school or equivalent (%)
Educational Attainment - Less than 1 year of college (%)
Educational Attainment - 1 or more years of college (%)
Educational Attainment - Associate degree (%)
Educational Attainment - Bachelor's degree (%)
Educational Attainment - Master's degree (%)
Educational Attainment - Professional school degree (%)
Educational Attainment - Doctorate degree (%)
School Enrollment - Nursery, preschool (%)
School Enrollment - Kindergarten (%)
School Enrollment - Grade 1 to 4 (%)
School Enrollment - Grade 5 to 8 (%)
School Enrollment - Grade 9 to 12 (%)
School Enrollment - College undergrad (%)
School Enrollment - Graduate or professional (%)
School Enrollment - Not enrolled in school (%)
School enrollment - Public schools (%)
School enrollment - Private schools (%)
School enrollment - Not enrolled (%)
Median number of rooms in houses and condos
Median number of rooms in apartments
Housing units lacking complete plumbing facilities (%)
Housing units lacking complete kitchen facilities (%)
Density of houses
Urban houses (%)
Rural houses (%)
Households with people 60 years and over (%)
Households with people 65 years and over (%)
Households with people 75 years and over (%)
Households with one or more nonrelatives (%)
Households with no nonrelatives (%)
Population in households (%)
Family households (%)
Nonfamily households (%)
Population in families (%)
Family households with own children (%)
Median number of bedrooms in owner occupied houses
Mean number of bedrooms in owner occupied houses
Median number of bedrooms in renter occupied houses
Mean number of bedrooms in renter occupied houses
Median number of vehichles in owner occupied houses
Mean number of vehichles in owner occupied houses
Median number of vehichles in renter occupied houses
Mean number of vehichles in renter occupied houses
Mortgage status - with mortgage (%)
Mortgage status - with second mortgage (%)
Mortgage status - with home equity loan (%)
Mortgage status - with both second mortgage and home equity loan (%)
Mortgage status - without a mortgage (%)
Average family size
Average family size - White
Average family size - Black or African American
Average family size - Asian
Average family size - Hispanic or Latino
Average family size - American Indian and Alaska Native
Average family size - Multirace
Average family size - Other Race
Geographical mobility - Same house 1 year ago (%)
Geographical mobility - Moved within same county (%)
Geographical mobility - Moved from different county within same state (%)
Geographical mobility - Moved from different state (%)
Geographical mobility - Moved from abroad (%)
Place of birth - Born in state of residence (%)
Place of birth - Born in other state (%)
Place of birth - Native, outside of US (%)
Place of birth - Foreign born (%)
Housing units in structures - 1, detached (%)
Housing units in structures - 1, attached (%)
Housing units in structures - 2 (%)
Housing units in structures - 3 or 4 (%)
Housing units in structures - 5 to 9 (%)
Housing units in structures - 10 to 19 (%)
Housing units in structures - 20 to 49 (%)
Housing units in structures - 50 or more (%)
Housing units in structures - Mobile home (%)
Housing units in structures - Boat, RV, van, etc. (%)
House/condo owner moved in on average (years ago)
Renter moved in on average (years ago)
Year householder moved into unit - Moved in 1999 to March 2000 (%)
Year householder moved into unit - Moved in 1995 to 1998 (%)
Year householder moved into unit - Moved in 1990 to 1994 (%)
Year householder moved into unit - Moved in 1980 to 1989 (%)
Year householder moved into unit - Moved in 1970 to 1979 (%)
Year householder moved into unit - Moved in 1969 or earlier (%)
Means of transportation to work - Drove car alone (%)
Means of transportation to work - Carpooled (%)
Means of transportation to work - Public transportation (%)
Means of transportation to work - Bus or trolley bus (%)
Means of transportation to work - Streetcar or trolley car (%)
Means of transportation to work - Subway or elevated (%)
Means of transportation to work - Railroad (%)
Means of transportation to work - Ferryboat (%)
Means of transportation to work - Taxicab (%)
Means of transportation to work - Motorcycle (%)
Means of transportation to work - Bicycle (%)
Means of transportation to work - Walked (%)
Means of transportation to work - Other means (%)
Working at home (%)
Industry diversity
Most Common Industries - Agriculture, forestry, fishing and hunting, and mining (%)
Most Common Industries - Agriculture, forestry, fishing and hunting (%)
Most Common Industries - Mining, quarrying, and oil and gas extraction (%)
Most Common Industries - Construction (%)
Most Common Industries - Manufacturing (%)
Most Common Industries - Wholesale trade (%)
Most Common Industries - Retail trade (%)
Most Common Industries - Transportation and warehousing, and utilities (%)
Most Common Industries - Transportation and warehousing (%)
Most Common Industries - Utilities (%)
Most Common Industries - Information (%)
Most Common Industries - Finance and insurance, and real estate and rental and leasing (%)
Most Common Industries - Finance and insurance (%)
Most Common Industries - Real estate and rental and leasing (%)
Most Common Industries - Professional, scientific, and management, and administrative and waste management services (%)
Most Common Industries - Professional, scientific, and technical services (%)
Most Common Industries - Management of companies and enterprises (%)
Most Common Industries - Administrative and support and waste management services (%)
Most Common Industries - Educational services, and health care and social assistance (%)
Most Common Industries - Educational services (%)
Most Common Industries - Health care and social assistance (%)
Most Common Industries - Arts, entertainment, and recreation, and accommodation and food services (%)
Most Common Industries - Arts, entertainment, and recreation (%)
Most Common Industries - Accommodation and food services (%)
Most Common Industries - Other services, except public administration (%)
Most Common Industries - Public administration (%)
Occupation diversity
Most Common Occupations - Management, business, science, and arts occupations (%)
Most Common Occupations - Management, business, and financial occupations (%)
Most Common Occupations - Management occupations (%)
Most Common Occupations - Business and financial operations occupations (%)
Most Common Occupations - Computer, engineering, and science occupations (%)
Most Common Occupations - Computer and mathematical occupations (%)
Most Common Occupations - Architecture and engineering occupations (%)
Most Common Occupations - Life, physical, and social science occupations (%)
Most Common Occupations - Education, legal, community service, arts, and media occupations (%)
Most Common Occupations - Community and social service occupations (%)
Most Common Occupations - Legal occupations (%)
Most Common Occupations - Education, training, and library occupations (%)
Most Common Occupations - Arts, design, entertainment, sports, and media occupations (%)
Most Common Occupations - Healthcare practitioners and technical occupations (%)
Most Common Occupations - Health diagnosing and treating practitioners and other technical occupations (%)
Most Common Occupations - Health technologists and technicians (%)
Most Common Occupations - Service occupations (%)
Most Common Occupations - Healthcare support occupations (%)
Most Common Occupations - Protective service occupations (%)
Most Common Occupations - Fire fighting and prevention, and other protective service workers including supervisors (%)
Most Common Occupations - Law enforcement workers including supervisors (%)
Most Common Occupations - Food preparation and serving related occupations (%)
Most Common Occupations - Building and grounds cleaning and maintenance occupations (%)
Most Common Occupations - Personal care and service occupations (%)
Most Common Occupations - Sales and office occupations (%)
Most Common Occupations - Sales and related occupations (%)
Most Common Occupations - Office and administrative support occupations (%)
Most Common Occupations - Natural resources, construction, and maintenance occupations (%)
Most Common Occupations - Farming, fishing, and forestry occupations (%)
Most Common Occupations - Construction and extraction occupations (%)
Most Common Occupations - Installation, maintenance, and repair occupations (%)
Most Common Occupations - Production, transportation, and material moving occupations (%)
Most Common Occupations - Production occupations (%)
Most Common Occupations - Transportation occupations (%)
Most Common Occupations - Material moving occupations (%)
People in Group quarters - Institutionalized population (%)
People in Group quarters - Correctional institutions (%)
People in Group quarters - Federal prisons and detention centers (%)
People in Group quarters - Halfway houses (%)
People in Group quarters - Local jails and other confinement facilities (including police lockups) (%)
People in Group quarters - Military disciplinary barracks (%)
People in Group quarters - State prisons (%)
People in Group quarters - Other types of correctional institutions (%)
People in Group quarters - Nursing homes (%)
People in Group quarters - Hospitals/wards, hospices, and schools for the handicapped (%)
People in Group quarters - Hospitals/wards and hospices for chronically ill (%)
People in Group quarters - Hospices or homes for chronically ill (%)
People in Group quarters - Military hospitals or wards for chronically ill (%)
People in Group quarters - Other hospitals or wards for chronically ill (%)
People in Group quarters - Hospitals or wards for drug/alcohol abuse (%)
People in Group quarters - Mental (Psychiatric) hospitals or wards (%)
People in Group quarters - Schools, hospitals, or wards for the mentally retarded (%)
People in Group quarters - Schools, hospitals, or wards for the physically handicapped (%)
People in Group quarters - Institutions for the deaf (%)
People in Group quarters - Institutions for the blind (%)
People in Group quarters - Orthopedic wards and institutions for the physically handicapped (%)
People in Group quarters - Wards in general hospitals for patients who have no usual home elsewhere (%)
People in Group quarters - Wards in military hospitals for patients who have no usual home elsewhere (%)
People in Group quarters - Juvenile institutions (%)
People in Group quarters - Long-term care (%)
People in Group quarters - Homes for abused, dependent, and neglected children (%)
People in Group quarters - Residential treatment centers for emotionally disturbed children (%)
People in Group quarters - Training schools for juvenile delinquents (%)
People in Group quarters - Short-term care, detention or diagnostic centers for delinquent children (%)
People in Group quarters - Type of juvenile institution unknown (%)
People in Group quarters - Noninstitutionalized population (%)
People in Group quarters - College dormitories (includes college quarters off campus) (%)
People in Group quarters - Military quarters (%)
People in Group quarters - On base (%)
People in Group quarters - Barracks, unaccompanied personnel housing (UPH), (Enlisted/Officer), ;and similar group living quarters for military personnel (%)
People in Group quarters - Transient quarters for temporary residents (%)
People in Group quarters - Military ships (%)
People in Group quarters - Group homes (%)
People in Group quarters - Homes or halfway houses for drug/alcohol abuse (%)
People in Group quarters - Homes for the mentally ill (%)
People in Group quarters - Homes for the mentally retarded (%)
People in Group quarters - Homes for the physically handicapped (%)
People in Group quarters - Other group homes (%)
People in Group quarters - Religious group quarters (%)
People in Group quarters - Dormitories (%)
People in Group quarters - Agriculture workers' dormitories on farms (%)
People in Group quarters - Job Corps and vocational training facilities (%)
People in Group quarters - Other workers' dormitories (%)
People in Group quarters - Crews of maritime vessels (%)
People in Group quarters - Other nonhousehold living situations (%)
People in Group quarters - Other noninstitutional group quarters (%)
Residents speaking English at home (%)
Residents speaking English at home - Born in the United States (%)
Residents speaking English at home - Native, born elsewhere (%)
Residents speaking English at home - Foreign born (%)
Residents speaking Spanish at home (%)
Residents speaking Spanish at home - Born in the United States (%)
Residents speaking Spanish at home - Native, born elsewhere (%)
Residents speaking Spanish at home - Foreign born (%)
Residents speaking other language at home (%)
Residents speaking other language at home - Born in the United States (%)
Residents speaking other language at home - Native, born elsewhere (%)
Residents speaking other language at home - Foreign born (%)
Class of Workers - Employee of private company (%)
Class of Workers - Self-employed in own incorporated business (%)
Class of Workers - Private not-for-profit wage and salary workers (%)
Class of Workers - Local government workers (%)
Class of Workers - State government workers (%)
Class of Workers - Federal government workers (%)
Class of Workers - Self-employed workers in own not incorporated business and Unpaid family workers (%)
House heating fuel used in houses and condos - Utility gas (%)
House heating fuel used in houses and condos - Bottled, tank, or LP gas (%)
House heating fuel used in houses and condos - Electricity (%)
House heating fuel used in houses and condos - Fuel oil, kerosene, etc. (%)
House heating fuel used in houses and condos - Coal or coke (%)
House heating fuel used in houses and condos - Wood (%)
House heating fuel used in houses and condos - Solar energy (%)
House heating fuel used in houses and condos - Other fuel (%)
House heating fuel used in houses and condos - No fuel used (%)
House heating fuel used in apartments - Utility gas (%)
House heating fuel used in apartments - Bottled, tank, or LP gas (%)
House heating fuel used in apartments - Electricity (%)
House heating fuel used in apartments - Fuel oil, kerosene, etc. (%)
House heating fuel used in apartments - Coal or coke (%)
House heating fuel used in apartments - Wood (%)
House heating fuel used in apartments - Solar energy (%)
House heating fuel used in apartments - Other fuel (%)
House heating fuel used in apartments - No fuel used (%)
Armed forces status - In Armed Forces (%)
Armed forces status - Civilian (%)
Armed forces status - Civilian - Veteran (%)
Armed forces status - Civilian - Nonveteran (%)
Fatal accidents locations in years 2005-2021
Fatal accidents locations in 2005
Fatal accidents locations in 2006
Fatal accidents locations in 2007
Fatal accidents locations in 2008
Fatal accidents locations in 2009
Fatal accidents locations in 2010
Fatal accidents locations in 2011
Fatal accidents locations in 2012
Fatal accidents locations in 2013
Fatal accidents locations in 2014
Fatal accidents locations in 2015
Fatal accidents locations in 2016
Fatal accidents locations in 2017
Fatal accidents locations in 2018
Fatal accidents locations in 2019
Fatal accidents locations in 2020
Fatal accidents locations in 2021
Alcohol use - People drinking some alcohol every month (%)
Alcohol use - People not drinking at all (%)
Alcohol use - Average days/month drinking alcohol
Alcohol use - Average drinks/week
Alcohol use - Average days/year people drink much
Audiometry - Average condition of hearing (%)
Audiometry - People that can hear a whisper from across a quiet room (%)
Audiometry - People that can hear normal voice from across a quiet room (%)
Audiometry - Ears ringing, roaring, buzzing (%)
Audiometry - Had a job exposure to loud noise (%)
Audiometry - Had off-work exposure to loud noise (%)
Blood Pressure & Cholesterol - Has high blood pressure (%)
Blood Pressure & Cholesterol - Checking blood pressure at home (%)
Blood Pressure & Cholesterol - Frequently checking blood cholesterol (%)
Blood Pressure & Cholesterol - Has high cholesterol level (%)
Consumer Behavior - Money monthly spent on food at supermarket/grocery store
Consumer Behavior - Money monthly spent on food at other stores
Consumer Behavior - Money monthly spent on eating out
Consumer Behavior - Money monthly spent on carryout/delivered foods
Consumer Behavior - Income spent on food at supermarket/grocery store (%)
Consumer Behavior - Income spent on food at other stores (%)
Consumer Behavior - Income spent on eating out (%)
Consumer Behavior - Income spent on carryout/delivered foods (%)
Current Health Status - General health condition (%)
Current Health Status - Blood donors (%)
Current Health Status - Has blood ever tested for HIV virus (%)
Current Health Status - Left-handed people (%)
Dermatology - People using sunscreen (%)
Diabetes - Diabetics (%)
Diabetes - Had a blood test for high blood sugar (%)
Diabetes - People taking insulin (%)
Diet Behavior & Nutrition - Diet health (%)
Diet Behavior & Nutrition - Milk product consumption (# of products/month)
Diet Behavior & Nutrition - Meals not home prepared (#/week)
Diet Behavior & Nutrition - Meals from fast food or pizza place (#/week)
Diet Behavior & Nutrition - Ready-to-eat foods (#/month)
Diet Behavior & Nutrition - Frozen meals/pizza (#/month)
Drug Use - People that ever used marijuana or hashish (%)
Drug Use - Ever used hard drugs (%)
Drug Use - Ever used any form of cocaine (%)
Drug Use - Ever used heroin (%)
Drug Use - Ever used methamphetamine (%)
Health Insurance - People covered by health insurance (%)
Kidney Conditions-Urology - Avg. # of times urinating at night
Medical Conditions - People with asthma (%)
Medical Conditions - People with anemia (%)
Medical Conditions - People with psoriasis (%)
Medical Conditions - People with overweight (%)
Medical Conditions - Elderly people having difficulties in thinking or remembering (%)
Medical Conditions - People who ever received blood transfusion (%)
Medical Conditions - People having trouble seeing even with glass/contacts (%)
Medical Conditions - People with arthritis (%)
Medical Conditions - People with gout (%)
Medical Conditions - People with congestive heart failure (%)
Medical Conditions - People with coronary heart disease (%)
Medical Conditions - People with angina pectoris (%)
Medical Conditions - People who ever had heart attack (%)
Medical Conditions - People who ever had stroke (%)
Medical Conditions - People with emphysema (%)
Medical Conditions - People with thyroid problem (%)
Medical Conditions - People with chronic bronchitis (%)
Medical Conditions - People with any liver condition (%)
Medical Conditions - People who ever had cancer or malignancy (%)
Mental Health - People who have little interest in doing things (%)
Mental Health - People feeling down, depressed, or hopeless (%)
Mental Health - People who have trouble sleeping or sleeping too much (%)
Mental Health - People feeling tired or having little energy (%)
Mental Health - People with poor appetite or overeating (%)
Mental Health - People feeling bad about themself (%)
Mental Health - People who have trouble concentrating on things (%)
Mental Health - People moving or speaking slowly or too fast (%)
Mental Health - People having thoughts they would be better off dead (%)
Oral Health - Average years since last visit a dentist
Oral Health - People embarrassed because of mouth (%)
Oral Health - People with gum disease (%)
Oral Health - General health of teeth and gums (%)
Oral Health - Average days a week using dental floss/device
Oral Health - Average days a week using mouthwash for dental problem
Oral Health - Average number of teeth
Pesticide Use - Households using pesticides to control insects (%)
Pesticide Use - Households using pesticides to kill weeds (%)
Physical Activity - People doing vigorous-intensity work activities (%)
Physical Activity - People doing moderate-intensity work activities (%)
Physical Activity - People walking or bicycling (%)
Physical Activity - People doing vigorous-intensity recreational activities (%)
Physical Activity - People doing moderate-intensity recreational activities (%)
Physical Activity - Average hours a day doing sedentary activities
Physical Activity - Average hours a day watching TV or videos
Physical Activity - Average hours a day using computer
Physical Functioning - People having limitations keeping them from working (%)
Physical Functioning - People limited in amount of work they can do (%)
Physical Functioning - People that need special equipment to walk (%)
Physical Functioning - People experiencing confusion/memory problems (%)
Physical Functioning - People requiring special healthcare equipment (%)
Prescription Medications - Average number of prescription medicines taking
Preventive Aspirin Use - Adults 40+ taking low-dose aspirin (%)
Reproductive Health - Vaginal deliveries (%)
Reproductive Health - Cesarean deliveries (%)
Reproductive Health - Deliveries resulted in a live birth (%)
Reproductive Health - Pregnancies resulted in a delivery (%)
Reproductive Health - Women breastfeeding newborns (%)
Reproductive Health - Women that had a hysterectomy (%)
Reproductive Health - Women that had both ovaries removed (%)
Reproductive Health - Women that have ever taken birth control pills (%)
Reproductive Health - Women taking birth control pills (%)
Reproductive Health - Women that have ever used Depo-Provera or injectables (%)
Reproductive Health - Women that have ever used female hormones (%)
Sexual Behavior - People 18+ that ever had sex (vaginal, anal, or oral) (%)
Sexual Behavior - Males 18+ that ever had vaginal sex with a woman (%)
Sexual Behavior - Males 18+ that ever performed oral sex on a woman (%)
Sexual Behavior - Males 18+ that ever had anal sex with a woman (%)
Sexual Behavior - Males 18+ that ever had any sex with a man (%)
Sexual Behavior - Females 18+ that ever had vaginal sex with a man (%)
Sexual Behavior - Females 18+ that ever performed oral sex on a man (%)
Sexual Behavior - Females 18+ that ever had anal sex with a man (%)
Sexual Behavior - Females 18+ that ever had any kind of sex with a woman (%)
Sexual Behavior - Average age people first had sex
Sexual Behavior - Average number of female sex partners in lifetime (males 18+)
Sexual Behavior - Average number of female vaginal sex partners in lifetime (males 18+)
Sexual Behavior - Average age people first performed oral sex on a woman (18+)
Sexual Behavior - Average number of woman performed oral sex on in lifetime (18+)
Sexual Behavior - Average number of male sex partners in lifetime (males 18+)
Sexual Behavior - Average number of male anal sex partners in lifetime (males 18+)
Sexual Behavior - Average age people first performed oral sex on a man (18+)
Sexual Behavior - Average number of male oral sex partners in lifetime (18+)
Sexual Behavior - People using protection when performing oral sex (%)
Sexual Behavior - Average number of times people have vaginal or anal sex a year
Sexual Behavior - People having sex without condom (%)
Sexual Behavior - Average number of male sex partners in lifetime (females 18+)
Sexual Behavior - Average number of male vaginal sex partners in lifetime (females 18+)
Sexual Behavior - Average number of female sex partners in lifetime (females 18+)
Sexual Behavior - Circumcised males 18+ (%)
Sleep Disorders - Average hours sleeping at night
Sleep Disorders - People that has trouble sleeping (%)
Smoking-Cigarette Use - People smoking cigarettes (%)
Taste & Smell - People 40+ having problems with smell (%)
Taste & Smell - People 40+ having problems with taste (%)
Taste & Smell - People 40+ that ever had wisdom teeth removed (%)
Taste & Smell - People 40+ that ever had tonsils teeth removed (%)
Taste & Smell - People 40+ that ever had a loss of consciousness because of a head injury (%)
Taste & Smell - People 40+ that ever had a broken nose or other serious injury to face or skull (%)
Taste & Smell - People 40+ that ever had two or more sinus infections (%)
Weight - Average height (inches)
Weight - Average weight (pounds)
Weight - Average BMI
Weight - People that are obese (%)
Weight - People that ever were obese (%)
Weight - People trying to lose weight (%)
Urban population: 15,967
Rural population: 391
Estimated median house/condo value in 2022: $117,806
44905:
$117,806Ohio:
$204,100
Median resident age: This zip code:
40.5 yearsOhio median age:
39.9 years
Average household size: This zip code:
2.2 peopleOhio:
2.4 people
Averages for the 2020 tax year for zip code 44905, filed in 2021:
Average Adjusted Gross Income (AGI) in 2020: $38,847 (Individual Income Tax Returns) Here:
$38,847State:
$67,288
Salary/wage: $35,788 (reported on 81.6% of returns )Here:
$35,788State:
$55,628
(% of AGI for various income ranges: 1105.8% for AGIs below $25k , 3467.9% for AGIs $25k-50k , 6094.1% for AGIs $50k-75k , 8558.0% for AGIs $75k-100k , 15003.7% for AGIs $100k-200k ) Taxable interest for individuals: $508 (reported on 16.7% of returns )This zip code:
$508Ohio:
$1,518
(% of AGI for various income ranges: 6.2% for AGIs below $25k , 8.5% for AGIs $25k-50k , 20.4% for AGIs $50k-75k , 18.3% for AGIs $75k-100k , 29.5% for AGIs $100k-200k ) Ordinary dividends: $2,557 (reported on 7.0% of returns )(% of AGI for various income ranges: 7.9% for AGIs below $25k , 8.5% for AGIs $25k-50k , 27.9% for AGIs $50k-75k , 95.7% for AGIs $75k-100k , 162.1% for AGIs $100k-200k ) Net capital gain/loss in AGI: +$4,277 (reported on 6.5% of returns )Here:
+$4,277State:
+$18,919
(% of AGI for various income ranges: 14.1% for AGIs $25k-50k , 36.7% for AGIs $50k-75k , 104.3% for AGIs $75k-100k , 454.7% for AGIs $100k-200k ) Profit/loss from business: +$7,855 (reported on 8.5% of returns )Here:
+$7,855State:
+$13,744
(% of AGI for various income ranges: 54.0% for AGIs below $25k , 38.2% for AGIs $25k-50k , 82.6% for AGIs $50k-75k , 132.0% for AGIs $75k-100k , 746.3% for AGIs $100k-200k ) Taxable individual retirement arrangement distribution: $11,225 (reported on 7.3% of returns )44905:
$11,225Ohio:
$18,876
(% of AGI for various income ranges: 51.1% for AGIs below $25k , 59.5% for AGIs $25k-50k , 132.3% for AGIs $50k-75k , 266.7% for AGIs $75k-100k , 681.6% for AGIs $100k-200k ) Total itemized deductions: $22,867 (reported on 1.0% of returns )Here:
$22,867State:
$33,869
(% of AGI for various income ranges: 34.3% for AGIs $25k-50k , 265.3% for AGIs $75k-100k ) Charity contributions: $9,400 (reported on 0.5% of returns )(% of AGI for various income ranges: 40.3% for AGIs $50k-75k ) Taxes paid: $3,950 (reported on 1.0% of returns )(% of AGI for various income ranges: 5.0% for AGIs $25k-50k , 51.0% for AGIs $75k-100k ) Earned income credit: $2,291 (reported on 19.9% of returns )(% of AGI for various income ranges: 95.9% for AGIs below $25k , 58.9% for AGIs $25k-50k , 1.6% for AGIs $50k-75k ) Percentage of individuals using paid preparers for their 2020 taxes: 92.8%(% for various income ranges: 87.6% for AGIs below $25k , 96.5% for AGIs $25k-50k , 96.6% for AGIs $50k-75k , 95.0% for AGIs $75k-100k , 96.6% for AGIs $100k-200k , 100.0% for AGIs over 200k )
Averages for the 2012 tax year for zip code 44905, filed in 2013:
Average Adjusted Gross Income (AGI) in 2012: $33,295 (Individual Income Tax Returns) Here:
$33,295State:
$54,926
Salary/wage: $30,259 (reported on 86.0% of returns )Here:
$30,259State:
$45,869
(% of AGI for various income ranges: 73.8% for AGIs below $25k , 82.3% for AGIs $25k-50k , 79.2% for AGIs $50k-75k , 83.1% for AGIs $75k-100k , 63.3% for AGIs $100k-200k ) Taxable interest for individuals: $612 (reported on 18.8% of returns )This zip code:
$612Ohio:
$1,297
(% of AGI for various income ranges: 0.6% for AGIs below $25k , 0.3% for AGIs $25k-50k , 0.3% for AGIs $50k-75k , 0.2% for AGIs $75k-100k , 0.3% for AGIs $100k-200k ) Ordinary dividends: $1,992 (reported on 9.0% of returns )(% of AGI for various income ranges: 0.7% for AGIs below $25k , 0.3% for AGIs $25k-50k , 0.6% for AGIs $50k-75k , 0.2% for AGIs $75k-100k , 1.3% for AGIs $100k-200k ) Net capital gain/loss in AGI: +$577 (reported on 5.5% of returns )(% of AGI for various income ranges: 1.2% for AGIs $100k-200k ) Profit/loss from business: +$7,566 (reported on 9.4% of returns )Here:
+$7,566State:
+$12,773
(% of AGI for various income ranges: 4.9% for AGIs below $25k , 1.7% for AGIs $25k-50k , 1.6% for AGIs $50k-75k , 1.1% for AGIs $75k-100k , 1.2% for AGIs $100k-200k ) Taxable individual retirement arrangement distribution: $9,743 (reported on 8.7% of returns )(% of AGI for various income ranges: 2.8% for AGIs below $25k , 1.8% for AGIs $25k-50k , 2.5% for AGIs $50k-75k , 2.0% for AGIs $75k-100k , 5.3% for AGIs $100k-200k ) Total itemized deductions: $14,303 (24% of AGI, reported on 13.8% of returns )Here:
$14,303State:
$21,278
Here:
24.0% of AGIState:
18.8% of AGI
(% of AGI for various income ranges: 3.0% for AGIs below $25k , 5.1% for AGIs $25k-50k , 7.1% for AGIs $50k-75k , 7.3% for AGIs $75k-100k , 9.5% for AGIs $100k-200k ) Charity contributions: $2,876 (reported on 9.0% of returns )(% of AGI for various income ranges: 0.3% for AGIs below $25k , 0.6% for AGIs $25k-50k , 0.9% for AGIs $50k-75k , 1.1% for AGIs $75k-100k , 1.4% for AGIs $100k-200k ) Taxes paid: $4,083 (reported on 13.8% of returns )(% of AGI for various income ranges: 0.4% for AGIs below $25k , 1.2% for AGIs $25k-50k , 2.0% for AGIs $50k-75k , 2.6% for AGIs $75k-100k , 3.6% for AGIs $100k-200k ) Earned income credit: $2,286 (reported on 24.8% of returns )(% of AGI for various income ranges: 7.3% for AGIs below $25k , 1.1% for AGIs $25k-50k ) Percentage of individuals using paid preparers for their 2012 taxes: 47.7%(% for various income ranges: 42.5% for AGIs below $25k , 51.4% for AGIs $25k-50k , 52.7% for AGIs $50k-75k , 50.0% for AGIs $75k-100k , 66.7% for AGIs $100k-200k )
Averages for the 2004 tax year for zip code 44905, filed in 2005:
Average Adjusted Gross Income (AGI) in 2004: $31,083 (Individual Income Tax Returns) Here:
$31,083State:
$44,480
Salary/wage: $29,649 (reported on 88.4% of returns )Here:
$29,649State:
$39,198
(% of AGI for various income ranges: 95.9% for AGIs below $10k , 77.6% for AGIs $10k-25k , 85.7% for AGIs $25k-50k , 87.5% for AGIs $50k-75k , 88.8% for AGIs $75k-100k , 74.5% for AGIs over 100k ) Taxable interest for individuals: $782 (reported on 33.8% of returns )This zip code:
$782Ohio:
$1,532
(% of AGI for various income ranges: 2.3% for AGIs below $10k , 1.3% for AGIs $10k-25k , 0.7% for AGIs $25k-50k , 0.6% for AGIs $50k-75k , 0.2% for AGIs $75k-100k , 1.6% for AGIs over 100k ) Taxable dividends: $1,153 (reported on 12.5% of returns )(% of AGI for various income ranges: 1.0% for AGIs below $10k , 0.6% for AGIs $10k-25k , 0.3% for AGIs $25k-50k , 0.3% for AGIs $50k-75k , 0.1% for AGIs $75k-100k , 1.6% for AGIs over 100k ) Net capital gain/loss: +$1,868 (reported on 8.7% of returns )Here:
+$1,868State:
+$8,582
(% of AGI for various income ranges: -0.7% for AGIs below $10k , 0.1% for AGIs $10k-25k , 0.2% for AGIs $25k-50k , 0.6% for AGIs $50k-75k , 1.0% for AGIs $75k-100k , 2.3% for AGIs over 100k ) Profit/loss from business: +$5,589 (reported on 10.4% of returns )Here:
+$5,589State:
+$10,813
(% of AGI for various income ranges: 4.4% for AGIs below $10k , 2.6% for AGIs $10k-25k , 1.9% for AGIs $25k-50k , 1.4% for AGIs $50k-75k , 1.3% for AGIs $75k-100k , 1.3% for AGIs over 100k ) IRA payment deduction: $2,244 (reported on 1.4% of returns )Total itemized deductions: $12,043 (22% of AGI, reported on 21.8% of returns )Here:
$12,043State:
$17,503
Here:
22.0% of AGIState:
20.8% of AGI
(% of AGI for various income ranges: 4.7% for AGIs below $10k , 4.9% for AGIs $10k-25k , 7.5% for AGIs $25k-50k , 9.9% for AGIs $50k-75k , 12.5% for AGIs $75k-100k , 12.0% for AGIs over 100k ) Charity contributions deductions: $2,220 (4% of AGI, reported on 15.9% of returns )Here:
3.8% of AGIState:
3.4% of AGI
(% of AGI for various income ranges: 0.3% for AGIs below $10k , 0.5% for AGIs $10k-25k , 0.9% for AGIs $25k-50k , 1.3% for AGIs $50k-75k , 1.9% for AGIs $75k-100k , 2.0% for AGIs over 100k ) Total tax: $3,379 (reported on 74.0% of returns )(% of AGI for various income ranges: 2.2% for AGIs below $10k , 4.0% for AGIs $10k-25k , 6.9% for AGIs $25k-50k , 8.9% for AGIs $50k-75k , 10.8% for AGIs $75k-100k , 16.6% for AGIs over 100k ) Earned income credit: $1,607 (reported on 17.9% of returns )Percentage of individuals using paid preparers for their 2004 taxes: 54.0%(% for various income ranges: 44.7% for AGIs below $10k , 55.3% for AGIs $10k-25k , 57.3% for AGIs $25k-50k , 54.9% for AGIs $50k-75k , 56.7% for AGIs $75k-100k , 60.0% for AGIs over 100k )
Estimated median household income in 2022: This zip code:
$52,544Ohio:
$65,720
Nearest zip codes: 44901 ,
44902 ,
44903 ,
44907 ,
44906 ,
44843 .
Mansfield Zip Code Map
Percentage of family households: This zip code:
37.4%Ohio:
43.3%
Percentage of households with unmarried partners: This zip code:
9.0%Ohio:
44.6%
No gay or lesbian households reported
Household received Food Stamps/SNAP in the past 12 months: 671Household did not receive Food Stamps/SNAP in the past 12 months: 4,522
Women who had a birth in the past 12 months: 91 (41 now married , 49 unmarried) Women who did not have a birth in the past 12 months: 2,291 (853 now married , 1,438 unmarried)
Housing units in zip code 44905 with a mortgage: 2,067 (87
second mortgage , 11
home equity loan , 78
both second mortgage and home equity loan )
Houses without a mortgage: 287
Median monthly owner costs for units with a mortgage: $961
Median monthly owner costs for units without a mortgage: $434
Residents with income below the poverty level in 2022:
This zip code:
13.6%Whole state:
13.4%
Residents with income below 50% of the poverty level in 2022:
This zip code:
5.5%Whole state:
7.0%
Median number of rooms in houses and condos: Median number of rooms in apartments: Notable locations in this zip code not listed on our city pages
Click to draw/clear zip code borders Notable locations in zip code 44905: (A) , Mifflin Township Fire Department Station 82 (B) , Madison Township Fire Department (C) , Ohio State Reformatory (D) . Display/hide their locations on the map
Shopping Center: (1) . Display/hide its location on the map
Churches in zip code 44905 include: (A) , First Brethren Church (B) , Christian Assembly Church (C) , Mansfield Baptist Temple (D) , Saint Timothy Lutheran Church (E) , Sunnydale Open Bible Church (F) , Fleming Falls Assembly of God Church (G) , Lincoln Heights Baptist Church (H) , Lincoln Heights Church of Christ in Christian Union (I) . Display/hide their locations on the map
Cemeteries: (1) , Lantz Cemetery (2) , Petit Cemetery (3) . Display/hide their locations on the map
Park in zip code 44905: (1) . Display/hide its location on the map
Year house built (houses)
12 2020 or later143 2010 to 2019112 2000 to 2009430 1990 to 1999282 1980 to 1989861 1970 to 1979859 1960 to 19691,623 1950 to 1959450 1940 to 1949634 1939 or earlier
Zip code 44905 household income distribution in 2022 413 Less than $10,00098 $10,000 to $14,999302 $15,000 to $19,999192 $20,000 to $24,999312 $25,000 to $29,999219 $30,000 to $34,999130 $35,000 to $39,999433 $40,000 to $44,999357 $45,000 to $49,999661 $50,000 to $59,999476 $60,000 to $74,999619 $75,000 to $99,999560 $100,000 to $124,999175 $125,000 to $149,999201 $150,000 to $199,99952 $200,000 or moreEstimate of home value of owner-occupied houses/condos in 2022 in zip code 44905 304 Less than $10,00060 $10,000 to $14,99941 $15,000 to $19,99947 $20,000 to $24,9998 $25,000 to $29,99939 $30,000 to $34,99957 $40,000 to $49,999101 $50,000 to $59,999230 $60,000 to $69,999181 $70,000 to $79,999247 $80,000 to $89,999246 $90,000 to $99,999719 $100,000 to $124,999394 $125,000 to $149,999376 $150,000 to $174,999150 $175,000 to $199,99978 $200,000 to $249,999130 $250,000 to $299,99936 $300,000 to $399,99915 $400,000 to $499,99940 $500,000 to $749,99934 $1,000,000 to $1,499,99913 $2,000,000 or moreRent paid by renters in 2022 in zip code 44905 14 $200 to $24945 $250 to $29929 $300 to $34935 $350 to $39968 $400 to $449105 $450 to $49962 $500 to $549161 $550 to $599143 $600 to $649121 $650 to $699146 $700 to $74934 $750 to $79947 $800 to $89993 $900 to $99920 $1,000 to $1,24973 No cash rent
Median gross rent in 2022: $844.
Estimated median house (or condo) value in 2022 for: White Non-Hispanic householders: $123,647Black or African American householders: $132,571American Indian or Alaska Native householders: $121,700Asian householders: $182,550Two or more races householders: $137,926Hispanic or Latino householders: $60,850Estimated median house or condo value in 2022: $117,806
44905:
$117,806Ohio:
$204,100
Lower value quartile - upper value quartile: $78,456 - $162,393
Mean price in 2022: Detached houses: $142,087Here:
$142,087State:
$254,366
Townhouses or other attached units: $275,769Here:
$275,769State:
$225,733
In 2-unit structures: $119,977Here:
$119,977State:
$144,384
In 3-to-4-unit structures: $184,937Here:
$184,937State:
$203,002
In 5-or-more-unit structures: $164,595Here:
$164,595State:
$211,593
Mobile homes: $47,013Here:
$47,013State:
$62,719
Housing units in structures:
One, detached: 4,136One, attached: 103Two: 1273 or 4: 1325 to 9: 18510 to 19: 11920 to 49: 3450 or more: 33Mobile homes: 602Unemployment : 4.6%
Means of transportation to work in zip code 44905 86.0% 4,619 Drove a car alone7.4% 399 Carpooled0.2% 9 Bus or trolley bus0.8% 43 Taxi0.9% 46 Walked0.8% 43 Other means0.8% 43 Worked at homeTravel time to work (commute) in zip code 44905 281 Less than 5 minutes880 5 to 9 minutes897 10 to 14 minutes1,200 15 to 19 minutes788 20 to 24 minutes290 25 to 29 minutes344 30 to 34 minutes33 35 to 39 minutes91 40 to 44 minutes77 45 to 59 minutes194 60 to 89 minutes68 90 or more minutes
Neighborhoods in zip code 44905: Percentage of zip code residents living and working in this county: 76.7%
Household type by relationship:
Households: 16,359
Male householders: 2,878 (1,044 living alone ), Female householders: 2,309 (699 living alone )2,260 spouses (2,260 opposite-sex spouses ), 648 unmarried partners , (619 opposite-sex unmarried partners ), 2,515 children (2,356 natural , 40 adopted , 118 stepchildren ), 305 grandchildren , 86 brothers or sisters , 49 parents , 14 foster children , 177 other relatives , 299 non-relatives In group quarters: 4,702 (-1 institutionalized population )
Size of family households: 1,854 2-persons , 504 3-persons , 374 4-persons , 164 5-persons , 124 6-persons , 23 7-or-more-persons
Size of nonfamily households: 1,739 1-person , 408 2-persons , 16 3-persons
1,234 married couples with children. single-parent households (129 men , 484 women ).
95.6% of residents of 44905 zip code speak English at home. of residents speak Spanish at home (68% very well, 20% well, 7% not well, 5% not at all ).of residents speak other Indo-European language at home (49% very well, 51% well ).of residents speak Asian or Pacific Island language at home (50% very well, 6% well, 44% not well ).of residents speak other language at home (95% very well, 5% well ).
Foreign born population: 215 (1.3%)
(78.9%
of them are naturalized citizens )
This zip code:
1.3%Whole state:
5.0%
18% France 13% Malaysia 11% Honduras 11% Japan 9% Ukraine 8% West Indies 7% Haiti 21% German 12% English 10% American 8% Irish 4% Italian 2% Scotch-Irish 2% Pennsylvania German
Year of entry for the foreign-born population
26 2010 or later 60 2000 to 2009 47 1990 to 1999 184 Before 1990
There are
40 Medical Specialists in Zip Code 44905 .
Facilities with environmental interests located in this zip code:
BP AMOCO 01981 * (1072 ASHLAND ROAD in MANSFIELD, OH)
STATE MASTER (Ohio general info) - RCRA-OHD987024676, HAZARDOUS WASTE PROGRAM, -70-5541-905-2, EPCRA, SDWIS-7049612, DRINKING WATER PROGRAM STATE MASTER (Ohio general info) - AIR MAJOR Conditionally Exempt Small Quantity Generators, less than 100 kg/month of hazardous waste (Resource Conservation and Recovery Act (tracking hazardous waste)) - notification Organizations: BP OIL CO (CONTACT/OWNER)
, BP OIL COMPANY (CONTACT/OWNER)
Alternative names: BP OIL CO SITE 01981, STANDARD OIL CO OHIO *
ACTION AUTO BODY INC (250 8TH AVE in MANSFIELD, OH)
STATE MASTER (Ohio general info) - RCRA-OHD986998078, HAZARDOUS WASTE PROGRAM Small Quantity Generators, between 100 kg and 1000 kg of hazardous waste/month (Resource Conservation and Recovery Act (tracking hazardous waste)) - notification Organizations: UNKNOWN (CONTACT/OWNER)
ADCO WELDING & SANDBLASTING (253 NINTH AVE in MANSFIELD, OH)
STATE MASTER (Ohio general info) - AIR MAJOR Small Quantity Generators, between 100 kg and 1000 kg of hazardous waste/month (Resource Conservation and Recovery Act (tracking hazardous waste)) - notification Organizations: ADKINS RUSSELL W (CONTACT/OWNER)
, UNKNOWN (CONTACT/OWNER)
B & B DRAIN SVC (320 S. ILLINOIS AVE in MANSFIELD, OH)
(Integrated Compliance Information System) - ICIS-05-1999-0784, FORMAL ENFORCEMENT ACTION National Pollutant Discharge Elimination System NON-MAJOR (Tracking pollutant discharge elimination systems) - permit Business SIC classification: REPAIR SHOPS AND RELATED SERVICES
BATES BODY SHOP (335 PARK AVE E in MANSFIELD, OH)
STATE MASTER (Ohio general info) - RCRA-OHD016395162, HAZARDOUS WASTE PROGRAM Small Quantity Generators, between 100 kg and 1000 kg of hazardous waste/month (Resource Conservation and Recovery Act (tracking hazardous waste)) - notification Organizations: BATES JAMES (CONTACT/OWNER)
BP OIL CO (680 N MAIN in MANSFIELD, OH)
STATE MASTER (Ohio general info) - RCRA-OHD987010667, HAZARDOUS WASTE PROGRAM, -70-5541-905-3, EPCRA Conditionally Exempt Small Quantity Generators, less than 100 kg/month of hazardous waste (Resource Conservation and Recovery Act (tracking hazardous waste)) - notification Organizations: BP OIL COMPANY (CONTACT/OWNER)
Alternative names: BP OIL CO SITE 05262
BAKERS BODY SHOP (595 FIFTH AVE in MANSFIELD, OH)
Small Quantity Generators, between 100 kg and 1000 kg of hazardous waste/month (Resource Conservation and Recovery Act (tracking hazardous waste)) - notification Organizations: BAKER MERVIN (CONTACT/OWNER)
BFI WASTE SYSTEMS OF OHIO INC (392 LAIRD ST in MANSFIELD, OH)
Small Quantity Generators, between 100 kg and 1000 kg of hazardous waste/month (Resource Conservation and Recovery Act (tracking hazardous waste)) - notification
ALKIM PAINTING INC (400 PARK AVE E REAR in MANSFIELD, OH)
Small Quantity Generators, between 100 kg and 1000 kg of hazardous waste/month (Resource Conservation and Recovery Act (tracking hazardous waste)) - notification
Housing units lacking complete plumbing facilities: 0.7%
Housing units lacking complete kitchen facilities: 0.6%
82.2% Utility gas 12.7% Electricity 2.8% Fuel oil, kerosene, etc. 1.5% Bottled, tank, or LP gas
Population in 1990: 16,221.
Place of birth for U.S.-born residents:
This state: 13,227Northeast: 517Midwest: 823South: 1,201West: 220
59% of the 44905 zip code residents lived in the same house 5 years ago.
Out of people who lived in different houses, 74% lived in this county.
Out of people who lived in different counties, 50% lived in Ohio.
83% of the 44905 zip code residents lived in the same house 1 year ago.
Out of people who lived in different houses, 24% moved from this county.
Out of people who lived in different houses, 74% moved from different county within same state.
Out of people who lived in different houses, 3% moved from different state.
Out of people who lived in different houses, 1% moved from abroad.
Private vs. public school enrollment:
Students in private schools in grades 1 to 8 (elementary and middle school): 44
Students in private schools in grades 9 to 12 (high school): 166
Students in private undergraduate colleges: 232
Occupation by median earnings in the past 12 months ($)
93,673 Health diagnosing and treating practitioners and other technical occupations 80,168 Architecture and engineering occupations 66,985 Construction and extraction occupations 60,422 Fire fighting and prevention, and other protective service workers including supervisors 49,061 Installation, maintenance, and repair occupations 46,808 Health technologists and technicians
Companies with federal contracts located in this zip code:
K&D OF OHIO, INC (270 NINTH AVE in MANSFIELD, OH) in 2 contracts from 2004 to 2005
$4,361 with Army for Maintenance, Repair and Rebuilding of Equipment -- Fuels, Lubricants, Oils, and Waxes. Signed on 2004-09-29. Completion date: 2004-10-29.
, same as above. Signed on 2005-09-22. Completion date: 2005-09-28.
Top industries in this zip code by the number of employees in 2005:
Accommodation and Food Services: Limited-Service Restaurants (20-49 employees: 6 establishments, 10-19 employees: 1 establishment, 5-9 employees: 3 establishments, 1-4 employees: 4 establishments)Health Care and Social Assistance: Residential Mental Health and Substance Abuse Facilities (100-249: 1)Other Services (except Public Administration): Religious Organizations (50-99: 1, 20-49: 1, 5-9: 6, 1-4: 6)Accommodation and Food Services: Full-Service Restaurants (10-19: 5, 1-4: 1)Real Estate and Rental and Leasing: Residential Property Managers (50-99: 1, 1-4: 1)
People in group quarters in 2010:
2,550 people in state prisons
36 people in nursing facilities/skilled-nursing facilities
31 people in correctional residential facilities
14 people in group homes intended for adults
People in group quarters in 2000:
150 people in nursing homes
23 people in other nonhousehold living situations
7 people in other group homes
3 people in mental (psychiatric) hospitals or wards
Fatal accident statistics in 2014:
Fatal accident count: 1Vehicles involved in fatal accidents: 1Fatal accidents caused by drunken drivers: 1Fatalities: 1Persons involved in fatal accidents: 1Pedestrians involved in fatal accidents: 0
Fatal accident statistics in 2012:
Fatal accident count: 3Vehicles involved in fatal accidents: 4Fatal accidents caused by drunken drivers: 0Fatalities: 3Persons involved in fatal accidents: 6Pedestrians involved in fatal accidents: 1
Home Mortgage Disclosure Act Aggregated Statistics For Year 2009(Based on 10 partial tracts) A) FHA, FSA/RHS & VA B) Conventional C) Refinancings D) Home Improvement Loans F) Non-occupant Loans on G) Loans On Manufactured Number Average Value Number Average Value Number Average Value Number Average Value Number Average Value Number Average Value
LOANS ORIGINATED 76 $82,082 40 $54,584 148 $83,004 23 $22,825 23 $43,715 1 $127,160 APPLICATIONS APPROVED, NOT ACCEPTED 2 $85,780 9 $66,626 17 $81,955 2 $29,880 2 $16,220 0 $0 APPLICATIONS DENIED 10 $67,280 18 $41,391 90 $76,067 27 $14,683 11 $50,925 8 $16,976 APPLICATIONS WITHDRAWN 4 $54,392 2 $57,670 23 $90,080 3 $23,123 0 $0 0 $0 FILES CLOSED FOR INCOMPLETENESS 1 $96,300 0 $0 10 $107,510 0 $0 0 $0 0 $0
Aggregated Statistics For Year 2008(Based on 10 partial tracts) A) FHA, FSA/RHS & VA B) Conventional C) Refinancings D) Home Improvement Loans F) Non-occupant Loans on G) Loans On Manufactured Number Average Value Number Average Value Number Average Value Number Average Value Number Average Value Number Average Value
LOANS ORIGINATED 70 $77,398 109 $60,835 147 $75,019 46 $29,587 53 $54,680 2 $30,650 APPLICATIONS APPROVED, NOT ACCEPTED 7 $37,631 12 $64,476 21 $90,915 7 $20,916 8 $46,961 2 $13,790 APPLICATIONS DENIED 15 $58,969 42 $48,259 220 $86,102 54 $20,485 24 $58,211 7 $25,550 APPLICATIONS WITHDRAWN 2 $24,820 6 $100,195 58 $90,394 5 $17,630 2 $51,910 0 $0 FILES CLOSED FOR INCOMPLETENESS 2 $86,070 2 $27,575 13 $86,575 3 $17,703 3 $48,667 0 $0
Aggregated Statistics For Year 2007(Based on 10 partial tracts) A) FHA, FSA/RHS & VA B) Conventional C) Refinancings D) Home Improvement Loans E) Loans on Dwellings For 5+ Families F) Non-occupant Loans on G) Loans On Manufactured Number Average Value Number Average Value Number Average Value Number Average Value Number Average Value Number Average Value Number Average Value
LOANS ORIGINATED 45 $77,162 154 $78,508 212 $75,971 74 $27,166 5 $126,424 48 $60,010 8 $24,332 APPLICATIONS APPROVED, NOT ACCEPTED 2 $86,160 19 $63,272 42 $82,319 23 $33,872 0 $0 8 $54,826 2 $29,150 APPLICATIONS DENIED 13 $80,808 55 $78,048 329 $83,772 123 $31,075 0 $0 17 $67,976 8 $15,786 APPLICATIONS WITHDRAWN 2 $76,245 21 $81,161 88 $84,338 12 $40,284 0 $0 4 $86,325 0 $0 FILES CLOSED FOR INCOMPLETENESS 2 $57,590 7 $59,647 24 $84,568 2 $45,420 0 $0 0 $0 0 $0
Aggregated Statistics For Year 2006(Based on 10 partial tracts) A) FHA, FSA/RHS & VA B) Conventional C) Refinancings D) Home Improvement Loans F) Non-occupant Loans on G) Loans On Manufactured Number Average Value Number Average Value Number Average Value Number Average Value Number Average Value Number Average Value
LOANS ORIGINATED 39 $84,316 247 $72,645 309 $71,636 102 $33,655 86 $59,596 7 $43,797 APPLICATIONS APPROVED, NOT ACCEPTED 0 $0 33 $76,532 65 $70,389 15 $36,949 4 $58,000 1 $24,880 APPLICATIONS DENIED 2 $130,250 98 $56,781 342 $78,145 118 $24,732 27 $53,312 8 $28,058 APPLICATIONS WITHDRAWN 3 $106,397 33 $67,749 182 $86,957 20 $71,350 7 $62,373 0 $0 FILES CLOSED FOR INCOMPLETENESS 3 $119,627 6 $72,597 42 $85,813 1 $28,970 3 $88,577 0 $0
Aggregated Statistics For Year 2005(Based on 10 partial tracts) A) FHA, FSA/RHS & VA B) Conventional C) Refinancings D) Home Improvement Loans E) Loans on Dwellings For 5+ Families F) Non-occupant Loans on G) Loans On Manufactured Number Average Value Number Average Value Number Average Value Number Average Value Number Average Value Number Average Value Number Average Value
LOANS ORIGINATED 53 $76,663 228 $70,572 410 $75,940 79 $29,842 2 $61,645 71 $61,211 10 $35,746 APPLICATIONS APPROVED, NOT ACCEPTED 5 $74,400 43 $54,566 91 $71,484 14 $33,024 0 $0 19 $51,827 2 $15,650 APPLICATIONS DENIED 5 $81,346 107 $57,209 434 $80,927 103 $32,467 0 $0 51 $71,414 26 $37,025 APPLICATIONS WITHDRAWN 3 $74,483 14 $95,179 196 $91,618 37 $137,539 0 $0 6 $96,822 6 $71,108 FILES CLOSED FOR INCOMPLETENESS 0 $0 11 $76,419 53 $93,689 5 $57,206 0 $0 5 $74,304 0 $0
Aggregated Statistics For Year 2004(Based on 10 partial tracts) A) FHA, FSA/RHS & VA B) Conventional C) Refinancings D) Home Improvement Loans E) Loans on Dwellings For 5+ Families F) Non-occupant Loans on G) Loans On Manufactured Number Average Value Number Average Value Number Average Value Number Average Value Number Average Value Number Average Value Number Average Value
LOANS ORIGINATED 49 $82,597 214 $70,926 492 $71,991 118 $24,480 1 $138,280 84 $53,046 12 $38,627 APPLICATIONS APPROVED, NOT ACCEPTED 0 $0 44 $53,938 109 $76,285 24 $19,907 0 $0 15 $83,067 8 $37,542 APPLICATIONS DENIED 4 $64,012 82 $53,388 445 $80,760 86 $24,000 0 $0 35 $48,215 26 $40,465 APPLICATIONS WITHDRAWN 1 $91,360 19 $68,139 227 $85,281 13 $46,297 0 $0 11 $71,918 3 $62,030 FILES CLOSED FOR INCOMPLETENESS 5 $60,346 14 $78,514 31 $95,735 5 $50,606 0 $0 5 $59,570 0 $0
Aggregated Statistics For Year 2003(Based on 10 partial tracts) A) FHA, FSA/RHS & VA B) Conventional C) Refinancings D) Home Improvement Loans F) Non-occupant Loans on Number Average Value Number Average Value Number Average Value Number Average Value Number Average Value
LOANS ORIGINATED 54 $82,502 228 $68,486 789 $72,385 89 $14,138 57 $54,854 APPLICATIONS APPROVED, NOT ACCEPTED 2 $104,080 36 $50,385 141 $81,818 10 $24,625 6 $56,028 APPLICATIONS DENIED 4 $86,768 75 $42,339 420 $75,232 68 $17,181 18 $51,718 APPLICATIONS WITHDRAWN 3 $50,563 8 $90,596 271 $82,609 3 $44,047 8 $50,249 FILES CLOSED FOR INCOMPLETENESS 5 $117,490 12 $63,418 55 $85,881 4 $25,482 3 $62,197
Aggregated Statistics For Year 2002(Based on 10 partial tracts) A) FHA, FSA/RHS & VA B) Conventional C) Refinancings D) Home Improvement Loans F) Non-occupant Loans on Number Average Value Number Average Value Number Average Value Number Average Value Number Average Value
LOANS ORIGINATED 54 $78,240 205 $64,085 618 $71,370 55 $26,877 66 $48,592 APPLICATIONS APPROVED, NOT ACCEPTED 3 $152,090 18 $55,384 173 $76,093 18 $20,376 9 $46,366 APPLICATIONS DENIED 5 $52,840 61 $37,322 457 $73,191 56 $12,502 20 $55,414 APPLICATIONS WITHDRAWN 5 $58,478 13 $83,422 305 $78,084 9 $9,402 5 $84,200 FILES CLOSED FOR INCOMPLETENESS 5 $97,672 5 $99,990 63 $139,850 1 $24,690 3 $97,687
Aggregated Statistics For Year 2001(Based on 10 partial tracts) A) FHA, FSA/RHS & VA B) Conventional C) Refinancings D) Home Improvement Loans F) Non-occupant Loans on Number Average Value Number Average Value Number Average Value Number Average Value Number Average Value
LOANS ORIGINATED 69 $79,474 215 $66,433 537 $68,201 67 $10,795 38 $47,498 APPLICATIONS APPROVED, NOT ACCEPTED 2 $30,810 28 $41,175 127 $62,178 17 $12,066 5 $36,006 APPLICATIONS DENIED 9 $80,824 107 $38,985 463 $61,336 116 $15,416 16 $44,512 APPLICATIONS WITHDRAWN 2 $41,365 18 $74,799 314 $69,017 19 $14,942 3 $105,970 FILES CLOSED FOR INCOMPLETENESS 0 $0 0 $0 27 $76,380 0 $0 0 $0
Aggregated Statistics For Year 2000(Based on 10 partial tracts) A) FHA, FSA/RHS & VA B) Conventional C) Refinancings D) Home Improvement Loans E) Loans on Dwellings For 5+ Families F) Non-occupant Loans on Number Average Value Number Average Value Number Average Value Number Average Value Number Average Value Number Average Value
LOANS ORIGINATED 50 $68,634 220 $58,342 313 $53,325 80 $11,382 0 $0 48 $42,605 APPLICATIONS APPROVED, NOT ACCEPTED 8 $71,099 54 $42,610 111 $60,904 46 $14,162 0 $0 6 $68,698 APPLICATIONS DENIED 13 $64,635 205 $35,592 327 $53,654 110 $20,153 2 $1,622,200 25 $39,116 APPLICATIONS WITHDRAWN 2 $52,390 14 $68,069 131 $54,080 15 $20,095 0 $0 4 $40,592 FILES CLOSED FOR INCOMPLETENESS 0 $0 5 $77,866 31 $52,745 0 $0 0 $0 0 $0
Aggregated Statistics For Year 1999(Based on 5 partial tracts) A) FHA, FSA/RHS & VA B) Conventional C) Refinancings D) Home Improvement Loans F) Non-occupant Loans on Number Average Value Number Average Value Number Average Value Number Average Value Number Average Value
LOANS ORIGINATED 29 $69,589 109 $71,471 231 $115,691 41 $12,710 27 $35,247 APPLICATIONS APPROVED, NOT ACCEPTED 1 $87,020 21 $42,519 94 $59,246 27 $9,220 7 $40,929 APPLICATIONS DENIED 4 $53,768 69 $43,061 193 $53,318 62 $10,515 12 $42,478 APPLICATIONS WITHDRAWN 3 $73,247 17 $58,696 86 $56,487 12 $12,733 4 $37,648 FILES CLOSED FOR INCOMPLETENESS 0 $0 2 $61,675 17 $59,146 0 $0 1 $81,170
Detailed HMDA statistics for the following Tracts:
0008.00
,
0009.00 ,
0018.00 ,
0019.00
Private Mortgage Insurance Companies Aggregated Statistics For Year 2009(Based on 8 partial tracts) A) Conventional B) Refinancings Number Average Value Number Average Value
LOANS ORIGINATED 5 $98,672 0 $0 APPLICATIONS APPROVED, NOT ACCEPTED 0 $0 2 $88,035 APPLICATIONS DENIED 2 $48,785 0 $0 APPLICATIONS WITHDRAWN 0 $0 0 $0 FILES CLOSED FOR INCOMPLETENESS 0 $0 0 $0
Aggregated Statistics For Year 2008(Based on 10 partial tracts) A) Conventional B) Refinancings C) Non-occupant Loans on Number Average Value Number Average Value Number Average Value
LOANS ORIGINATED 28 $69,103 7 $92,610 5 $33,842 APPLICATIONS APPROVED, NOT ACCEPTED 11 $62,565 12 $108,742 0 $0 APPLICATIONS DENIED 3 $89,243 0 $0 2 $110,180 APPLICATIONS WITHDRAWN 2 $79,430 0 $0 0 $0 FILES CLOSED FOR INCOMPLETENESS 3 $57,513 0 $0 0 $0
Aggregated Statistics For Year 2007(Based on 10 partial tracts) A) Conventional B) Refinancings C) Non-occupant Loans on Number Average Value Number Average Value Number Average Value
LOANS ORIGINATED 98 $81,804 27 $101,637 6 $44,902 APPLICATIONS APPROVED, NOT ACCEPTED 7 $87,174 7 $115,404 1 $27,600 APPLICATIONS DENIED 3 $80,033 0 $0 0 $0 APPLICATIONS WITHDRAWN 3 $71,483 5 $59,242 0 $0 FILES CLOSED FOR INCOMPLETENESS 0 $0 2 $62,480 0 $0
Aggregated Statistics For Year 2006(Based on 10 partial tracts) A) Conventional B) Refinancings C) Non-occupant Loans on Number Average Value Number Average Value Number Average Value
LOANS ORIGINATED 85 $73,769 13 $74,566 11 $55,729 APPLICATIONS APPROVED, NOT ACCEPTED 13 $73,245 10 $90,224 4 $42,405 APPLICATIONS DENIED 4 $56,088 0 $0 2 $33,255 APPLICATIONS WITHDRAWN 0 $0 2 $74,465 0 $0 FILES CLOSED FOR INCOMPLETENESS 0 $0 1 $139,510 0 $0
Aggregated Statistics For Year 2005(Based on 10 partial tracts) A) Conventional B) Refinancings C) Non-occupant Loans on Number Average Value Number Average Value Number Average Value
LOANS ORIGINATED 56 $84,613 32 $89,267 5 $65,652 APPLICATIONS APPROVED, NOT ACCEPTED 20 $75,027 21 $106,107 8 $57,091 APPLICATIONS DENIED 0 $0 0 $0 0 $0 APPLICATIONS WITHDRAWN 0 $0 3 $89,763 0 $0 FILES CLOSED FOR INCOMPLETENESS 0 $0 2 $97,675 0 $0
Aggregated Statistics For Year 2004(Based on 10 partial tracts) A) Conventional B) Refinancings C) Non-occupant Loans on Number Average Value Number Average Value Number Average Value
LOANS ORIGINATED 75 $74,613 38 $97,141 5 $42,180 APPLICATIONS APPROVED, NOT ACCEPTED 17 $74,833 16 $104,920 3 $61,203 APPLICATIONS DENIED 0 $0 0 $0 0 $0 APPLICATIONS WITHDRAWN 0 $0 5 $99,476 0 $0 FILES CLOSED FOR INCOMPLETENESS 0 $0 0 $0 0 $0
Aggregated Statistics For Year 2003(Based on 10 partial tracts) A) Conventional B) Refinancings C) Non-occupant Loans on Number Average Value Number Average Value Number Average Value
LOANS ORIGINATED 84 $87,675 87 $90,860 5 $93,830 APPLICATIONS APPROVED, NOT ACCEPTED 21 $86,763 43 $91,365 2 $63,335 APPLICATIONS DENIED 0 $0 3 $76,460 0 $0 APPLICATIONS WITHDRAWN 7 $79,239 7 $86,603 3 $88,937 FILES CLOSED FOR INCOMPLETENESS 1 $198,770 0 $0 0 $0
Aggregated Statistics For Year 2002(Based on 10 partial tracts) A) Conventional B) Refinancings C) Non-occupant Loans on Number Average Value Number Average Value Number Average Value
LOANS ORIGINATED 79 $72,103 79 $89,557 5 $41,266 APPLICATIONS APPROVED, NOT ACCEPTED 6 $109,868 31 $93,741 0 $0 APPLICATIONS DENIED 0 $0 2 $51,100 2 $51,100 APPLICATIONS WITHDRAWN 8 $62,925 12 $105,251 2 $36,805 FILES CLOSED FOR INCOMPLETENESS 0 $0 0 $0 0 $0
Aggregated Statistics For Year 2001(Based on 10 partial tracts) A) Conventional B) Refinancings C) Non-occupant Loans on Number Average Value Number Average Value Number Average Value
LOANS ORIGINATED 78 $72,560 65 $77,811 11 $59,841 APPLICATIONS APPROVED, NOT ACCEPTED 11 $62,044 21 $72,903 7 $49,073 APPLICATIONS DENIED 0 $0 1 $92,590 0 $0 APPLICATIONS WITHDRAWN 2 $73,000 0 $0 0 $0 FILES CLOSED FOR INCOMPLETENESS 0 $0 0 $0 0 $0
Aggregated Statistics For Year 2000(Based on 10 partial tracts) A) Conventional B) Refinancings C) Non-occupant Loans on Number Average Value Number Average Value Number Average Value
LOANS ORIGINATED 64 $72,025 27 $71,987 5 $60,948 APPLICATIONS APPROVED, NOT ACCEPTED 13 $72,535 5 $68,696 2 $58,400 APPLICATIONS DENIED 5 $88,994 2 $80,355 0 $0 APPLICATIONS WITHDRAWN 2 $68,945 0 $0 0 $0 FILES CLOSED FOR INCOMPLETENESS 0 $0 1 $66,120 0 $0
Aggregated Statistics For Year 1999(Based on 5 partial tracts) A) Conventional B) Refinancings C) Non-occupant Loans on Number Average Value Number Average Value Number Average Value
LOANS ORIGINATED 34 $72,263 12 $69,137 1 $20,530 APPLICATIONS APPROVED, NOT ACCEPTED 1 $83,750 5 $55,992 0 $0 APPLICATIONS DENIED 1 $113,730 1 $57,120 0 $0 APPLICATIONS WITHDRAWN 1 $36,890 0 $0 0 $0 FILES CLOSED FOR INCOMPLETENESS 1 $22,810 0 $0 1 $22,810
Detailed PMIC statistics for the following Tracts:
0008.00
,
0009.00 ,
0018.00 ,
0019.00
2002 - 2018 National Fire Incident Reporting System (NFIRS) incidents See full 2006 National Fire Incident Reporting System statistics for zip code 44905, Ohio
Most common first names in zip code 44905 among deceased individuals Name Count Lived (average)
John 141 72.4 years Mary 115 75.8 years Robert 93 71.0 years Charles 84 70.7 years William 82 70.4 years James 74 67.9 years Helen 63 77.0 years George 58 74.6 years Richard 44 71.5 years Joseph 41 72.9 years
Most common last names in zip code 44905 among deceased individuals Last name Count Lived (average)
Smith 48 76.4 years Miller 33 72.2 years Williams 30 72.5 years Thompson 28 73.1 years Brown 21 72.4 years Davis 21 68.6 years Hall 19 73.2 years Johnson 17 66.0 years Hamilton 17 70.4 years Lee 16 68.1 years
Businesses in zip code 44905
Name Count Name Count
Advance Auto Parts 1 MasterBrand Cabinets 3 AutoZone 1 McDonald's 1 Burger King 1 Rite Aid 1 CVS 1 Starbucks 1 Dairy Queen 1 Subway 1 Decora Cabinetry 2 Taco Bell 1 GNC 1 U-Haul 1 H&R Block 1 UPS 2 KFC 1 Walgreens 1 Kroger 1 Wendy's 1 Lane Furniture 1
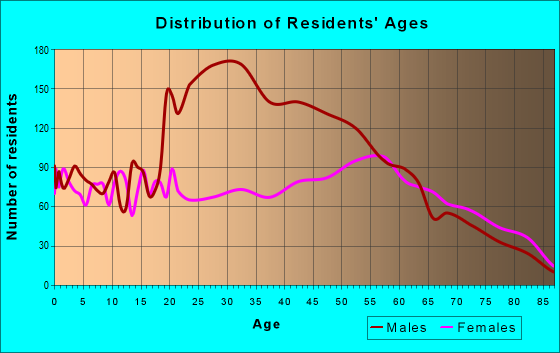


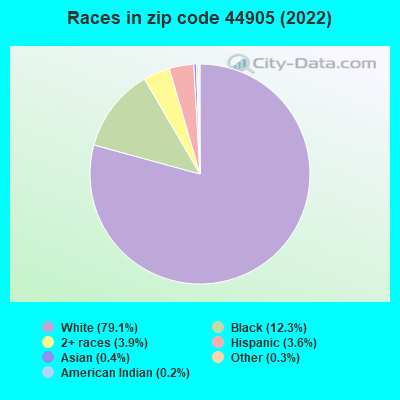


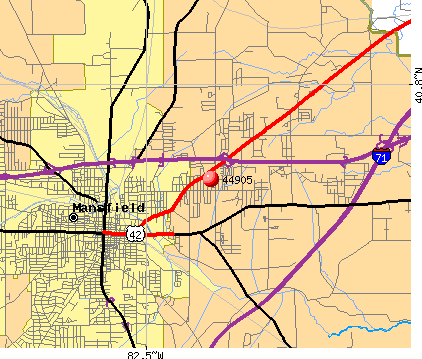 Nearest zip codes: 44901, 44902, 44903, 44907, 44906, 44843.
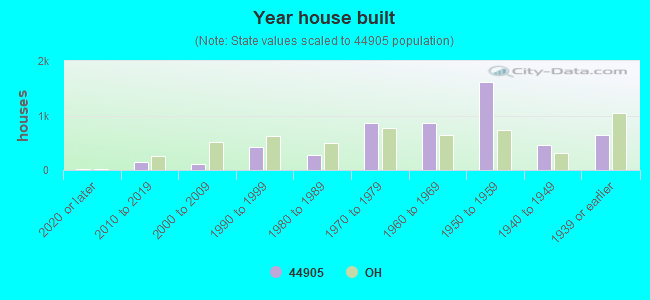
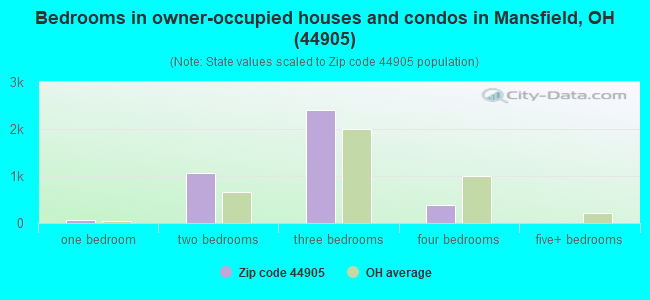
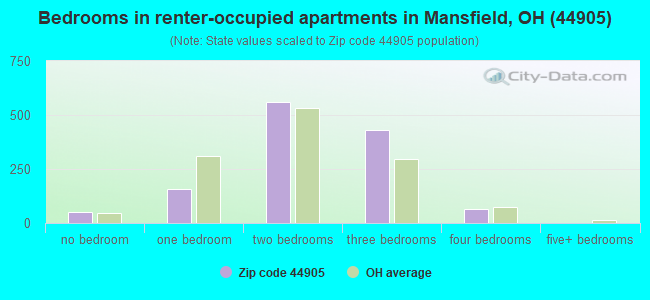


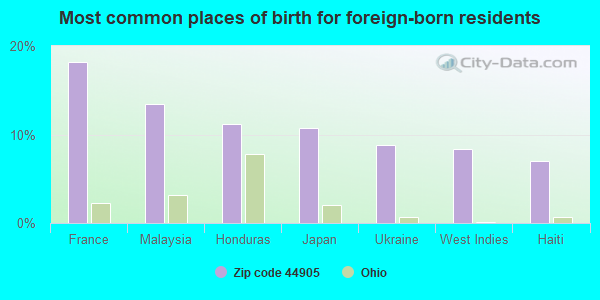
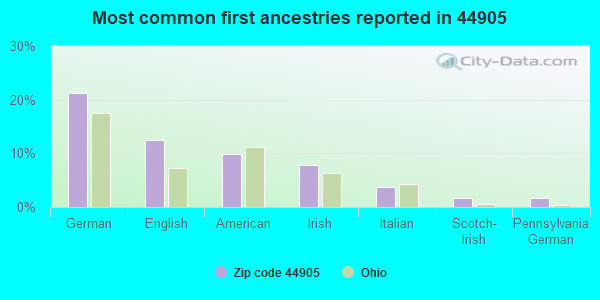
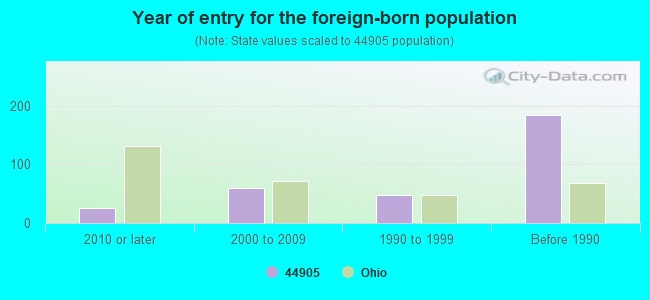

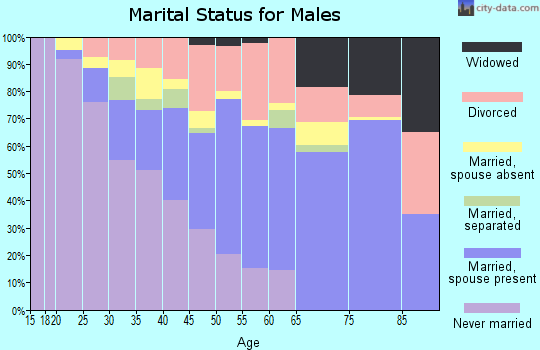
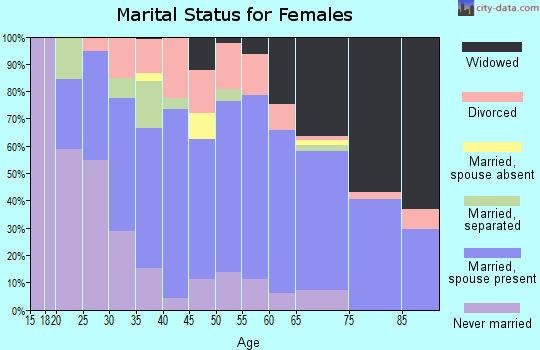
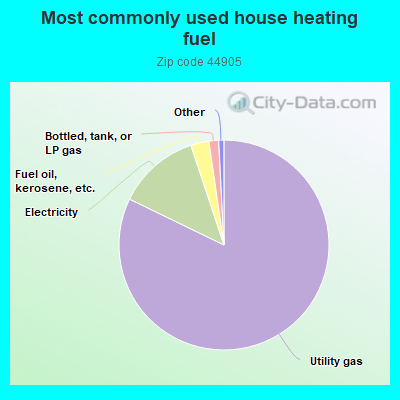
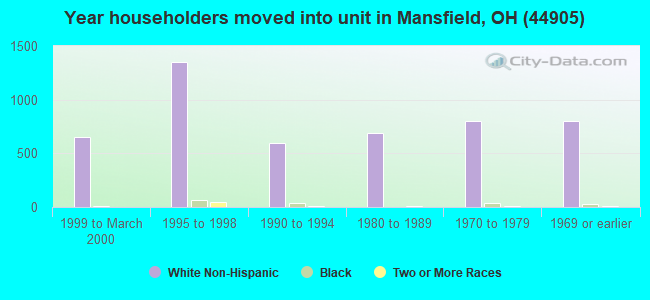
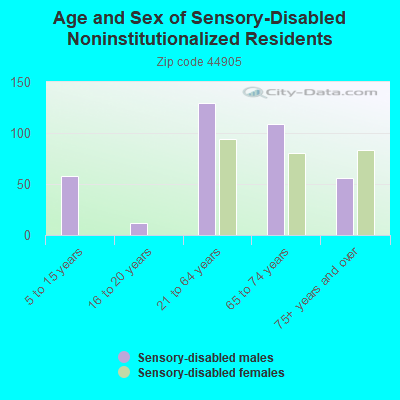
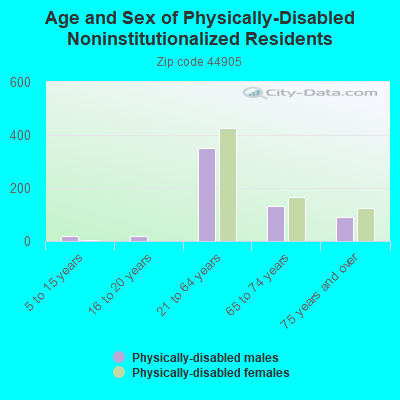
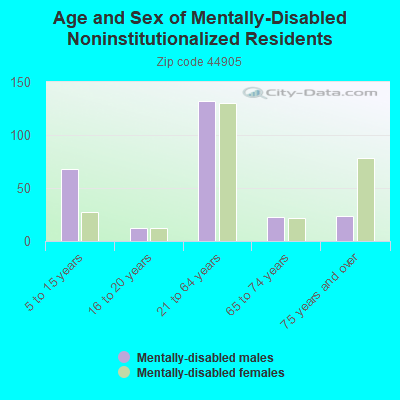
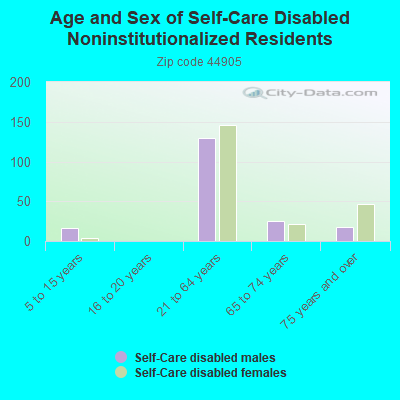
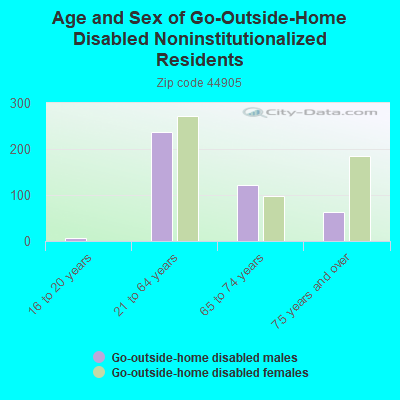
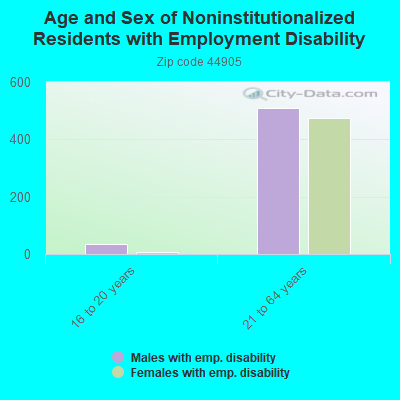
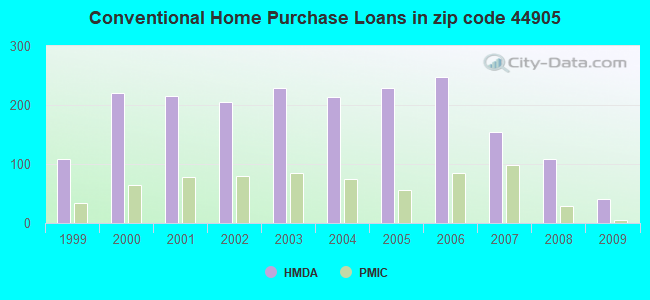
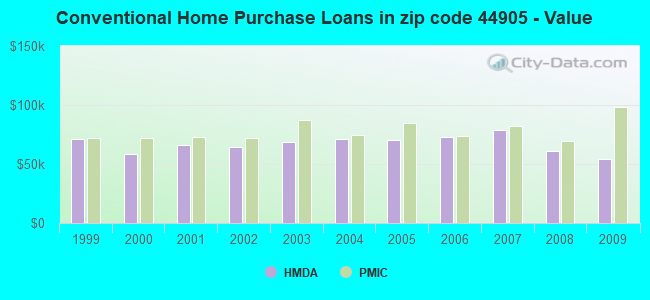
 According to the data from the years 2002 - 2018 the average number of fire incidents per year is 78. The highest number of fires - 108 took place in 2010, and the least - 41 in 2002. The data has an increasing trend.
 When looking into fire subcategories, the most incidents belonged to: Structure Fires (53.3%), and Outside Fires (33.4%).