Estimated zip code population in 2022: 2,811 Zip code population in 2010: 3,254 Zip code population in 2000: 3,276
Houses and condos: 1,761 Renter-occupied apartments: 732
% of renters here:
45%
State:
33%
March 2022 cost of living index in zip code 45780: 82.1 (low, U.S. average is 100)
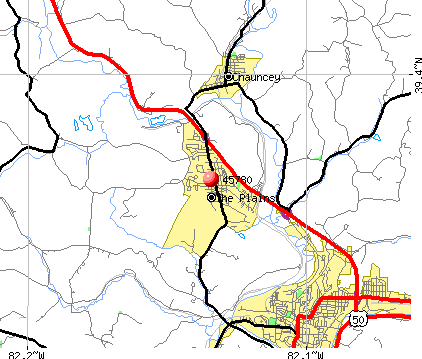
Land area: 2.5 sq. mi. Water area: 0.0 sq. mi.
Population density: 1,112 people per square mile
(low).
OSM Map
General Map
Google Map
MSN Map
OSM Map
General Map
Google Map
MSN Map
OSM Map
General Map
Google Map
MSN Map
OSM Map
General Map
Google Map
MSN Map
Please wait while loading the map...
Real estate property taxes paid for housing units in 2022:
This zip code:
1.2% ($3,014)
Ohio:
1.3% ($2,639)
Median real estate property taxes paid for housing units with mortgages in 2022: $2,424 (1.2%) Median real estate property taxes paid for housing units with no mortgage in 2022: $3,662 (1.2%)
Business Search- 14 Million verified businesses
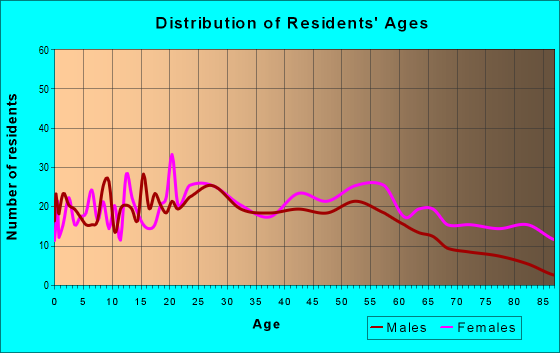
Males: 1,236
(44.0%)
Females: 1,575
(56.0%)
For population 25 years and over in 45780:
High school or higher: 91.7%
Bachelor's degree or higher: 35.6%
Graduate or professional degree: 19.2%
Unemployed: 3.9%
Mean travel time to work (commute): 19.7 minutes
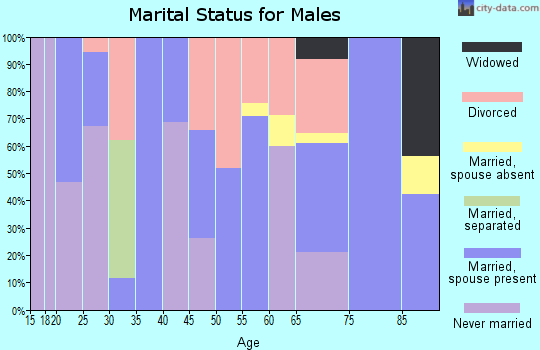
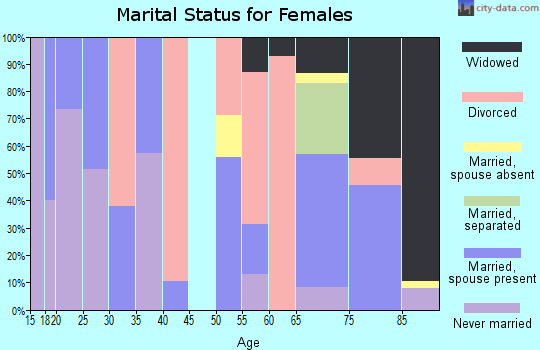
For population 15 years and over in 45780:
Never married: 32.3%
Now married: 38.7%
Separated: 0.1%
Widowed: 17.4%
Divorced: 11.5%
Zip code 45780 compared to state average:
Black race population percentage significantly below state average.
Hispanic race population percentage significantly below state average.
Median age significantly above state average.
Foreign-born population percentage significantly below state average.
Length of stay since moving in significantly above state average.
Estimated median house/condo value in 2022: $251,534
45780:
$251,534
Ohio:
$204,100
According to our research of Ohio and other state lists, there were 6 registered sex offenders living in 45780 zip code as of May 06, 2024. The ratio of all residents to sex offenders in zip code 45780 is 522 to 1. The ratio of registered sex offenders to all residents in this zip code is near the state average.
Median resident age:
This zip code:
58.9 years
Ohio median age:
39.9 years
Average household size:
This zip code:
1.7 people
Ohio:
2.4 people
Averages for the 2020 tax year for zip code 45780, filed in 2021:
Average Adjusted Gross Income (AGI) in 2020: $44,326 (Individual Income Tax Returns)
Here:
$44,326
State:
$67,288
Salary/wage: $36,072 (reported on 77.6% of returns)
Here:
$36,072
State:
$55,628
(% of AGI for various income ranges: 987.9% for AGIs below $25k, 3342.7% for AGIs $25k-50k, 5593.1% for AGIs $50k-75k, 8406.2% for AGIs $75k-100k, 13962.9% for AGIs $100k-200k)
Taxable interest for individuals: $1,153 (reported on 24.5% of returns)
This zip code:
$1,153
Ohio:
$1,518
(% of AGI for various income ranges: 5.5% for AGIs below $25k, 23.6% for AGIs $25k-50k, 25.0% for AGIs $50k-75k, 88.8% for AGIs $75k-100k, 285.7% for AGIs $100k-200k)
Ordinary dividends: $3,653 (reported on 12.9% of returns)
Here:
$3,653
State:
$7,167
(% of AGI for various income ranges: 6.0% for AGIs below $25k, 15.8% for AGIs $25k-50k, 51.2% for AGIs $50k-75k, 136.2% for AGIs $75k-100k, 604.3% for AGIs $100k-200k)
Net capital gain/loss in AGI: +$10,471 (reported on 11.6% of returns)
Here:
+$10,471
State:
+$18,919
(% of AGI for various income ranges: 1.1% for AGIs below $25k, 14.5% for AGIs $25k-50k, 58.1% for AGIs $50k-75k, 162.5% for AGIs $75k-100k, 2148.6% for AGIs $100k-200k)
Profit/loss from business: +$5,456 (reported on 12.2% of returns)
Here:
+$5,456
State:
+$13,744
(% of AGI for various income ranges: 54.7% for AGIs below $25k, 77.6% for AGIs $25k-50k, 63.7% for AGIs $50k-75k, 458.8% for AGIs $75k-100k)
Taxable individual retirement arrangement distribution: $10,958 (reported on 8.2% of returns)
45780:
$10,958
Ohio:
$18,876
(% of AGI for various income ranges: 38.3% for AGIs below $25k, 98.8% for AGIs $25k-50k, 345.0% for AGIs $75k-100k, 761.4% for AGIs $100k-200k)
Total itemized deductions: $36,900 (reported on 2.7% of returns)
Here:
$36,900
State:
$33,869
(% of AGI for various income ranges: 110.4% for AGIs below $25k, 1196.2% for AGIs $75k-100k)
Taxes paid: $5,275 (reported on 2.7% of returns)
45780:
$5,275
State:
$7,681
(% of AGI for various income ranges: 15.1% for AGIs below $25k, 175.0% for AGIs $75k-100k)
Earned income credit: $2,053 (reported on 21.8% of returns)
Here:
$2,053
State:
$2,304
(% of AGI for various income ranges: 103.6% for AGIs below $25k, 51.5% for AGIs $25k-50k)
Percentage of individuals using paid preparers for their 2020 taxes: 94.6%
Here:
95%
State:
94%
(% for various income ranges: 94.9% for AGIs below $25k, 97.6% for AGIs $25k-50k, 90.5% for AGIs $50k-75k, 91.7% for AGIs $75k-100k, 92.9% for AGIs $100k-200k)
Averages for the 2012 tax year for zip code 45780, filed in 2013:
Average Adjusted Gross Income (AGI) in 2012: $37,386 (Individual Income Tax Returns)
Here:
$37,386
State:
$54,926
Salary/wage: $31,921 (reported on 80.3% of returns)
Here:
$31,921
State:
$45,869
(% of AGI for various income ranges: 79.1% for AGIs below $25k, 76.5% for AGIs $25k-50k, 65.2% for AGIs $50k-75k, 61.1% for AGIs $75k-100k, 60.2% for AGIs $100k-200k)
Taxable interest for individuals: $1,419 (reported on 27.3% of returns)
This zip code:
$1,419
Ohio:
$1,297
(% of AGI for various income ranges: 1.2% for AGIs below $25k, 0.4% for AGIs $25k-50k, 2.4% for AGIs $50k-75k, 0.5% for AGIs $75k-100k, 0.8% for AGIs $100k-200k)
Ordinary dividends: $3,079 (reported on 14.4% of returns)
Here:
$3,079
State:
$5,821
(% of AGI for various income ranges: 0.6% for AGIs below $25k, 0.4% for AGIs $25k-50k, 1.1% for AGIs $50k-75k, 1.7% for AGIs $75k-100k, 2.2% for AGIs $100k-200k)
Net capital gain/loss in AGI: +$4,700 (reported on 9.1% of returns)
Here:
+$4,700
State:
+$11,232
(% of AGI for various income ranges: 0.2% for AGIs below $25k, 0.4% for AGIs $50k-75k, 4.6% for AGIs $100k-200k)
Profit/loss from business: +$4,660 (reported on 11.4% of returns)
Here:
+$4,660
State:
+$12,773
(% of AGI for various income ranges: 4.0% for AGIs below $25k, 1.8% for AGIs $25k-50k, 0.5% for AGIs $50k-75k, 1.5% for AGIs $75k-100k)
Taxable individual retirement arrangement distribution: $10,325 (reported on 9.1% of returns)
45780:
$10,325
Ohio:
$14,511
(% of AGI for various income ranges: 2.5% for AGIs below $25k, 1.3% for AGIs $25k-50k, 2.7% for AGIs $50k-75k, 8.5% for AGIs $75k-100k)
Total itemized deductions: $16,256 (21% of AGI, reported on 18.9% of returns)
Here:
$16,256
State:
$21,278
Here:
20.9% of AGI
State:
18.8% of AGI
(% of AGI for various income ranges: 3.4% for AGIs below $25k, 5.8% for AGIs $25k-50k, 9.2% for AGIs $50k-75k, 10.0% for AGIs $75k-100k, 12.3% for AGIs $100k-200k)
Charity contributions: $3,522 (reported on 13.6% of returns)
Here:
$3,522
State:
$3,943
(% of AGI for various income ranges: 0.9% for AGIs $25k-50k, 1.4% for AGIs $50k-75k, 1.8% for AGIs $75k-100k, 2.1% for AGIs $100k-200k)
Taxes paid: $6,144 (reported on 18.9% of returns)
45780:
$6,144
State:
$9,568
(% of AGI for various income ranges: 1.7% for AGIs $25k-50k, 3.0% for AGIs $50k-75k, 4.5% for AGIs $75k-100k, 5.9% for AGIs $100k-200k)
Earned income credit: $2,141 (reported on 24.2% of returns)
Here:
$2,141
State:
$2,285
(% of AGI for various income ranges: 7.5% for AGIs below $25k, 0.9% for AGIs $25k-50k)
Percentage of individuals using paid preparers for their 2012 taxes: 51.5%
Here:
52%
State:
51%
(% for various income ranges: 43.5% for AGIs below $25k, 52.8% for AGIs $25k-50k, 64.7% for AGIs $50k-75k, 62.5% for AGIs $75k-100k, 66.7% for AGIs $100k-200k)
Averages for the 2004 tax year for zip code 45780, filed in 2005:
Average Adjusted Gross Income (AGI) in 2004: $30,958 (Individual Income Tax Returns)
Here:
$30,958
State:
$44,480
Salary/wage: $27,030 (reported on 83.4% of returns)
Here:
$27,030
State:
$39,198
(% of AGI for various income ranges: 86.4% for AGIs below $10k, 77.8% for AGIs $10k-25k, 79.5% for AGIs $25k-50k, 75.3% for AGIs $50k-75k, 68.4% for AGIs $75k-100k, 51.3% for AGIs over 100k)
Taxable interest for individuals: $1,112 (reported on 41.0% of returns)
This zip code:
$1,112
Ohio:
$1,532
(% of AGI for various income ranges: 3.3% for AGIs below $10k, 2.1% for AGIs $10k-25k, 0.9% for AGIs $25k-50k, 1.0% for AGIs $50k-75k, 3.1% for AGIs $75k-100k, 0.8% for AGIs over 100k)
Taxable dividends: $1,508 (reported on 17.9% of returns)
Here:
$1,508
State:
$3,496
(% of AGI for various income ranges: 0.9% for AGIs below $10k, 0.8% for AGIs $10k-25k, 0.4% for AGIs $25k-50k, 1.3% for AGIs $50k-75k, 1.2% for AGIs $75k-100k, 0.8% for AGIs over 100k)
Net capital gain/loss: +$810 (reported on 12.8% of returns)
Here:
+$810
State:
+$8,582
(% of AGI for various income ranges: -0.8% for AGIs below $10k, -0.5% for AGIs $10k-25k, 0.1% for AGIs $25k-50k, 0.9% for AGIs $50k-75k, 0.3% for AGIs $75k-100k, 1.2% for AGIs over 100k)
Profit/loss from business: +$10,225 (reported on 11.8% of returns)
Here:
+$10,225
State:
+$10,813
(% of AGI for various income ranges: 6.4% for AGIs below $10k, 2.6% for AGIs $10k-25k, 1.6% for AGIs $25k-50k, 1.8% for AGIs $50k-75k, 15.3% for AGIs over 100k)
IRA payment deduction: $1,267 (reported on 1.0% of returns)
45780:
$1,267
Ohio:
$2,794
Total itemized deductions: $14,520 (23% of AGI, reported on 21.1% of returns)
Here:
$14,520
State:
$17,503
Here:
23.4% of AGI
State:
20.8% of AGI
(% of AGI for various income ranges: 8.9% for AGIs $10k-25k, 7.7% for AGIs $25k-50k, 11.5% for AGIs $50k-75k, 13.1% for AGIs $75k-100k, 12.2% for AGIs over 100k)
Charity contributions deductions: $2,285 (3% of AGI, reported on 17.2% of returns)
Here:
$2,285
State:
$3,087
Here:
3.4% of AGI
State:
3.4% of AGI
(% of AGI for various income ranges: 0.5% for AGIs $10k-25k, 1.1% for AGIs $25k-50k, 1.6% for AGIs $50k-75k, 1.8% for AGIs $75k-100k, 1.8% for AGIs over 100k)
Total tax: $3,975 (reported on 69.4% of returns)
45780:
$3,975
State:
$6,781
(% of AGI for various income ranges: 1.8% for AGIs below $10k, 3.9% for AGIs $10k-25k, 7.3% for AGIs $25k-50k, 9.2% for AGIs $50k-75k, 11.3% for AGIs $75k-100k, 16.7% for AGIs over 100k)
Earned income credit: $1,469 (reported on 20.4% of returns)
Here:
$1,469
State:
$1,696
Percentage of individuals using paid preparers for their 2004 taxes: 56.5%
Here:
56%
State:
55%
(% for various income ranges: 53.2% for AGIs below $10k, 55.5% for AGIs $10k-25k, 58.3% for AGIs $25k-50k, 63.6% for AGIs $50k-75k, 53.1% for AGIs $75k-100k, 54.3% for AGIs over 100k)
Household received Food Stamps/SNAP in the past 12 months: 314 Household did not receive Food Stamps/SNAP in the past 12 months: 1,307
Women who did not have a birth in the past 12 months: 370 (98 now married, 272 unmarried)
Housing units in zip code 45780 with a mortgage: 187 (11 second mortgage, 11 both second mortgage and home equity loan) Median monthly owner costs for units with a mortgage: $1,101 Median monthly owner costs for units without a mortgage: $726
Residents with income below the poverty level in 2022:
This zip code:
22.8%
Whole state:
13.4%
Residents with income below 50% of the poverty level in 2022:
This zip code:
12.5%
Whole state:
7.0%
Median number of rooms in houses and condos:
Here:
6.5
State:
6.7
Median number of rooms in apartments:
Here:
3.6
State:
4.4
Notable locations in this zip code not listed on our city pages
In group quarters: 90 (-1 institutionalized population)
Size of family households: 488 2-persons, 129 3-persons, 76 4-persons
Size of nonfamily households: 839 1-person, 95 2-persons
105 married couples with children.
126 single-parent households (126 women).
98.2% of residents of 45780 zip code speak English at home.
1.3% of residents speak Spanish at home (50% very well, 50% well).
0.6% of residents speak other Indo-European language at home (100% very well).
0.8% of residents speak other language at home (100% very well).
Foreign born population: 42 (1.5%) (100.0% of them are naturalized citizens)
This zip code:
1.5%
Whole state:
5.0%
51%Barbados
41%Azores Islands
2%Germany
27%Irish
14%German
14%American
13%English
9%Scottish
6%Scotch-Irish
2%Polish
Year of entry for the foreign-born population
02010 or later
232000 to 2009
01990 to 1999
15Before 1990
Facilities with environmental interests located in this zip code:
ATHENS HIGH SCHOOL (1 HIGH SCHOOL RD in THE PLAINS, OH)
(Geographic Names Information System) (National Center for Education Statistics) - STATE ID-001149 Organizations: ATHENS CITY SD (SCHOOL DISTRICT)
Housing units lacking complete plumbing facilities: 3.6% Housing units lacking complete kitchen facilities: 5.0%
56.1%Electricity
28.4%Utility gas
12.7%Bottled, tank, or LP gas
1.8%No fuel used
1.2%Fuel oil, kerosene, etc.
Population in 1990: 3,567.
Place of birth for U.S.-born residents:
This state: 1,877
Northeast: 197
Midwest: 236
South: 337
West: 116
42% of the 45780 zip code residents lived in the same house 5 years ago. Out of people who lived in different houses, 56% lived in this county. Out of people who lived in different counties, 50% lived in Ohio.
94% of the 45780 zip code residents lived in the same house 1 year ago. Out of people who lived in different houses, 76% moved from this county. Out of people who lived in different houses, 3% moved from different county within same state. Out of people who lived in different houses, 21% moved from different state.
Private vs. public school enrollment:
Students in private schools in grades 1 to 8 (elementary and middle school):
Here:
0.0%
Ohio:
16.0%
Students in private schools in grades 9 to 12 (high school):
Here:
0.0%
Ohio:
13.1%
Students in private undergraduate colleges:
Here:
0.0%
Ohio:
22.3%
Occupation by median earnings in the past 12 months ($)
76,972Management occupations
58,094Health technologists and technicians
57,063Education, training, and library occupations
52,584Office and administrative support occupations
52,413Community and social service occupations
12,632Sales and related occupations
Top industries in this zip code by the number of employees in 2005:
Health Care and Social Assistance: Nursing Care Facilities (100-249 employees: 2 establishments)
Educational Services: Elementary and Secondary Schools (10-19: 1)
Health Care and Social Assistance: Residential Mental Retardation Facilities (10-19: 1)
People in group quarters in 2010:
140 people in nursing facilities/skilled-nursing facilities
7 people in group homes intended for adults
People in group quarters in 2000:
180 people in nursing homes
9 people in homes for the mentally retarded
3 people in other noninstitutional group quarters
2002 - 2018 National Fire Incident Reporting System (NFIRS) incidents
According to the data from the years 2002 - 2018 the average number of fire incidents per year is 17. The highest number of fire incidents - 29 took place in 2005, and the least - 8 in 2002. The data has a rising trend.
When looking into fire subcategories, the most incidents belonged to: Outside Fires (45.1%), and Structure Fires (41.8%).
Fire incident types reported to NFIRS in Zip Code 45780


 Nearest zip codes: 45719, 45701, 45761, 45716, 45740, 45764.


 According to the data from the years 2002 - 2018 the average number of fire incidents per year is 17. The highest number of fire incidents - 29 took place in 2005, and the least - 8 in 2002. The data has a rising trend.
 When looking into fire subcategories, the most incidents belonged to: Outside Fires (45.1%), and Structure Fires (41.8%).