Estimated zip code population in 2022: 1,338 Zip code population in 2010: 1,351 Zip code population in 2000: 1,133
Houses and condos: 725 Renter-occupied apartments: 36
% of renters here:
7%
State:
27%
March 2022 cost of living index in zip code 48760: 90.5 (less than average, U.S. average is 100)
Land area: 27.4 sq. mi. Water area: 0.7 sq. mi.
Population density: 49 people per square mile
(very low).
OSM Map
General Map
Google Map
MSN Map
OSM Map
General Map
Google Map
MSN Map
OSM Map
General Map
Google Map
MSN Map
OSM Map
General Map
Google Map
MSN Map
Please wait while loading the map...
Real estate property taxes paid for housing units in 2022:
This zip code:
1.0% ($1,524)
Michigan:
1.2% ($2,746)
Median real estate property taxes paid for housing units with mortgages in 2022: $1,497 (0.8%) Median real estate property taxes paid for housing units with no mortgage in 2022: $1,588 (1.7%)
Business Search- 14 Million verified businesses
Males: 694
(51.9%)
Females: 643
(48.1%)
For population 25 years and over in 48760:
High school or higher: 86.0%
Bachelor's degree or higher: 12.8%
Graduate or professional degree: 5.0%
Unemployed: 9.6%
Mean travel time to work (commute): 38.5 minutes
For population 15 years and over in 48760:
Never married: 28.2%
Now married: 52.3%
Separated: 1.2%
Widowed: 8.8%
Divorced: 9.5%
Zip code 48760 compared to state average:
Unemployed percentage above state average.
Black race population percentage below state average.
Hispanic race population percentage significantly below state average.
Median age above state average.
Foreign-born population percentage significantly below state average.
Renting percentage significantly below state average.
Number of college students significantly below state average.
Percentage of population with a bachelor's degree or higher significantly below state average.
Averages for the 2020 tax year for zip code 48760, filed in 2021:
Average Adjusted Gross Income (AGI) in 2020: $42,941 (Individual Income Tax Returns)
Here:
$42,941
State:
$68,945
Salary/wage: $42,998 (reported on 75.9% of returns)
Here:
$42,998
State:
$57,142
(% of AGI for various income ranges: 925.3% for AGIs below $25k, 3309.1% for AGIs $25k-50k, 5982.9% for AGIs $50k-75k, 9035.0% for AGIs $75k-100k, 15996.7% for AGIs $100k-200k)
Taxable interest for individuals: $325 (reported on 22.2% of returns)
This zip code:
$325
Michigan:
$1,630
(% of AGI for various income ranges: 6.0% for AGIs below $25k, 13.6% for AGIs $25k-50k, 1.4% for AGIs $50k-75k, 35.0% for AGIs $75k-100k)
Ordinary dividends: $1,275 (reported on 7.4% of returns)
Here:
$1,275
State:
$6,972
(% of AGI for various income ranges: 46.4% for AGIs $25k-50k)
Net capital gain/loss in AGI: +$1,750 (reported on 7.4% of returns)
Here:
+$1,750
State:
+$20,064
(% of AGI for various income ranges: 2.0% for AGIs below $25k, 60.9% for AGIs $25k-50k)
Profit/loss from business: +$4,000 (reported on 13.0% of returns)
Here:
+$4,000
State:
+$11,172
(% of AGI for various income ranges: 161.3% for AGIs below $25k, 54.3% for AGIs $50k-75k)
Taxable individual retirement arrangement distribution: $9,267 (reported on 5.6% of returns)
48760:
$9,267
Michigan:
$19,803
(% of AGI for various income ranges: 185.3% for AGIs below $25k)
Earned income credit: $2,225 (reported on 14.8% of returns)
Here:
$2,225
State:
$2,251
(% of AGI for various income ranges: 72.0% for AGIs below $25k, 63.6% for AGIs $25k-50k)
Percentage of individuals using paid preparers for their 2020 taxes: 96.3%
Here:
96%
State:
93%
(% for various income ranges: 95.5% for AGIs below $25k, 92.9% for AGIs $25k-50k, 100.0% for AGIs $50k-75k, 100.0% for AGIs $75k-100k, 100.0% for AGIs $100k-200k)
Averages for the 2012 tax year for zip code 48760, filed in 2013:
Average Adjusted Gross Income (AGI) in 2012: $37,409 (Individual Income Tax Returns)
Here:
$37,409
State:
$55,609
Salary/wage: $32,282 (reported on 83.0% of returns)
Here:
$32,282
State:
$46,782
(% of AGI for various income ranges: 59.0% for AGIs below $25k, 68.0% for AGIs $25k-50k, 73.1% for AGIs $50k-75k, 73.3% for AGIs $75k-100k, 82.6% for AGIs $100k-200k)
Taxable interest for individuals: $686 (reported on 26.4% of returns)
This zip code:
$686
Michigan:
$1,491
(% of AGI for various income ranges: 0.8% for AGIs below $25k, 0.6% for AGIs $25k-50k, 0.7% for AGIs $50k-75k, 0.3% for AGIs $75k-100k)
Ordinary dividends: $667 (reported on 11.3% of returns)
Here:
$667
State:
$6,225
Net capital gain/loss in AGI: +$1,225 (reported on 7.5% of returns)
Here:
+$1,225
State:
+$9,326
Profit/loss from business: +$6,400 (reported on 13.2% of returns)
Here:
+$6,400
State:
+$11,523
Taxable individual retirement arrangement distribution: $6,400 (reported on 5.7% of returns)
48760:
$6,400
Michigan:
$15,298
Total itemized deductions: $17,591 (26% of AGI, reported on 20.8% of returns)
Here:
$17,591
State:
$21,628
Here:
26.4% of AGI
State:
18.4% of AGI
(% of AGI for various income ranges: 11.4% for AGIs $25k-50k, 9.6% for AGIs $50k-75k, 23.8% for AGIs $75k-100k)
Charity contributions: $4,467 (reported on 17.0% of returns)
Here:
$4,467
State:
$4,225
(% of AGI for various income ranges: 2.2% for AGIs below $25k, 2.0% for AGIs $50k-75k, 6.0% for AGIs $75k-100k)
Taxes paid: $4,727 (reported on 20.8% of returns)
48760:
$4,727
State:
$8,327
(% of AGI for various income ranges: 2.5% for AGIs $25k-50k, 2.5% for AGIs $50k-75k, 7.0% for AGIs $75k-100k)
Earned income credit: $2,125 (reported on 22.6% of returns)
Here:
$2,125
State:
$2,306
(% of AGI for various income ranges: 6.6% for AGIs below $25k, 1.4% for AGIs $25k-50k)
Percentage of individuals using paid preparers for their 2012 taxes: 66.0%
Here:
66%
State:
57%
(% for various income ranges: 62.5% for AGIs below $25k, 69.2% for AGIs $25k-50k, 75.0% for AGIs $50k-75k, 60.0% for AGIs $75k-100k, 66.7% for AGIs $100k-200k)
Averages for the 2004 tax year for zip code 48760, filed in 2005:
Average Adjusted Gross Income (AGI) in 2004: $35,115 (Individual Income Tax Returns)
Here:
$35,115
State:
$48,204
Salary/wage: $32,342 (reported on 84.7% of returns)
Here:
$32,342
State:
$42,791
(% of AGI for various income ranges: 70.8% for AGIs below $10k, 61.8% for AGIs $10k-25k, 76.4% for AGIs $25k-50k, 85.5% for AGIs $50k-75k, 92.2% for AGIs $75k-100k, 66.4% for AGIs over 100k)
Taxable interest for individuals: $749 (reported on 41.5% of returns)
This zip code:
$749
Michigan:
$1,725
(% of AGI for various income ranges: 4.9% for AGIs below $10k, 3.7% for AGIs $10k-25k, 0.3% for AGIs $25k-50k, 0.4% for AGIs $50k-75k, 0.3% for AGIs $75k-100k, 0.4% for AGIs over 100k)
Taxable dividends: $474 (reported on 14.0% of returns)
Here:
$474
State:
$3,420
(% of AGI for various income ranges: 0.6% for AGIs $10k-25k, 0.1% for AGIs $25k-50k, 0.1% for AGIs $50k-75k, 0.3% for AGIs $75k-100k)
Net capital gain/loss: +$619 (reported on 7.6% of returns)
Here:
+$619
State:
+$8,532
Profit/loss from business: +$2,937 (reported on 20.0% of returns)
Here:
+$2,937
State:
+$9,547
(% of AGI for various income ranges: 16.7% for AGIs below $10k, 8.4% for AGIs $10k-25k, 1.2% for AGIs $25k-50k, -0.4% for AGIs $50k-75k)
Total itemized deductions: $15,660 (25% of AGI, reported on 27.5% of returns)
Here:
$15,660
State:
$18,509
Here:
25.4% of AGI
State:
20.7% of AGI
(% of AGI for various income ranges: 11.0% for AGIs $10k-25k, 10.6% for AGIs $25k-50k, 14.4% for AGIs $50k-75k, 12.8% for AGIs $75k-100k, 13.9% for AGIs over 100k)
Charity contributions deductions: $2,712 (4% of AGI, reported on 22.5% of returns)
Here:
$2,712
State:
$3,365
Here:
4.3% of AGI
State:
3.6% of AGI
(% of AGI for various income ranges: 2.1% for AGIs $10k-25k, 1.1% for AGIs $25k-50k, 1.5% for AGIs $50k-75k, 1.0% for AGIs $75k-100k, 4.2% for AGIs over 100k)
Total tax: $3,913 (reported on 72.7% of returns)
48760:
$3,913
State:
$7,691
(% of AGI for various income ranges: 4.2% for AGIs below $10k, 4.6% for AGIs $10k-25k, 5.1% for AGIs $25k-50k, 7.8% for AGIs $50k-75k, 10.3% for AGIs $75k-100k, 15.1% for AGIs over 100k)
Earned income credit: $1,853 (reported on 18.3% of returns)
Here:
$1,853
State:
$1,737
Percentage of individuals using paid preparers for their 2004 taxes: 71.9%
Here:
72%
State:
60%
(% for various income ranges: 63.5% for AGIs below $10k, 74.0% for AGIs $10k-25k, 75.5% for AGIs $25k-50k, 67.5% for AGIs $50k-75k, 76.9% for AGIs $75k-100k, 86.4% for AGIs over 100k)
Household received Food Stamps/SNAP in the past 12 months: 49 Household did not receive Food Stamps/SNAP in the past 12 months: 503
Women who had a birth in the past 12 months: 3 (0 now married, 3 unmarried) Women who did not have a birth in the past 12 months: 249 (117 now married, 131 unmarried)
Housing units in zip code 48760 with a mortgage: 220 (33 second mortgage, 35 both second mortgage and home equity loan) Houses without a mortgage: 11
Median monthly owner costs for units with a mortgage: $1,314 Median monthly owner costs for units without a mortgage: $578
Residents with income below the poverty level in 2022:
This zip code:
10.4%
Whole state:
13.4%
Residents with income below 50% of the poverty level in 2022:
This zip code:
7.9%
Whole state:
6.9%
Median number of rooms in houses and condos:
Here:
6.4
State:
6.5
Median number of rooms in apartments:
Here:
5.0
State:
4.3
Notable locations in this zip code not listed on our city pages
Churches in zip code 48760 include: Dayton Center Church (A), Silverwood United Methodist Church (B), Rich Church (C). Display/hide their locations on the map
In group quarters: 1 (-1 institutionalized population)
Size of family households: 171 2-persons, 53 3-persons, 36 4-persons, 35 5-persons, 20 6-persons, 16 7-or-more-persons
Size of nonfamily households: 185 1-person, 38 2-persons
236 married couples with children.
16 single-parent households (4 men, 12 women).
99.1% of residents of 48760 zip code speak English at home.
0.2% of residents speak Spanish at home (100% not well).
0.8% of residents speak other Indo-European language at home (100% very well).
Foreign born population: 15 (1.1%) (87.3% of them are naturalized citizens)
This zip code:
1.1%
Whole state:
6.9%
53%Sweden
47%United Kingdom, excluding England and Scotland
28%German
16%English
10%American
8%Polish
3%Irish
1%Danish
1%Italian
Year of entry for the foreign-born population
02010 or later
02000 to 2009
01990 to 1999
15Before 1990
Housing units lacking complete plumbing facilities: 2.8% Housing units lacking complete kitchen facilities: 3.2%
59.1%Bottled, tank, or LP gas
23.5%Wood
6.1%Other fuel
5.7%Utility gas
3.1%Fuel oil, kerosene, etc.
2.2%Electricity
0.7%Solar energy
Population in 1990: 964. Population change in the 1990s: +169 (+17.5%).
Place of birth for U.S.-born residents:
This state: 1,030
Northeast: 81
Midwest: 40
South: 157
West: 11
65% of the 48760 zip code residents lived in the same house 5 years ago. Out of people who lived in different houses, 48% lived in this county. Out of people who lived in different counties, 50% lived in Michigan.
96% of the 48760 zip code residents lived in the same house 1 year ago. Out of people who lived in different houses, 5% moved from this county. Out of people who lived in different houses, 97% moved from different county within same state.
Private vs. public school enrollment:
Students in private schools in grades 1 to 8 (elementary and middle school): 12
Here:
10.1%
Michigan:
12.4%
Students in private schools in grades 9 to 12 (high school): 3
Here:
2.7%
Michigan:
9.8%
Students in private undergraduate colleges:
Here:
0.0%
Michigan:
14.9%
Occupation by median earnings in the past 12 months ($)
91,446Health diagnosing and treating practitioners and other technical occupations
71,547Transportation occupations
47,184Business and financial operations occupations
45,450Management occupations
41,932Building and grounds cleaning and maintenance occupations
41,547Construction and extraction occupations
Top industries in this zip code by the number of employees in 2005:
Other Services (except Public Administration): Religious Organizations (1-4 employees: 2 establishments)
Construction: Site Preparation Contractors (1-4: 1)
Professional, Scientific, and Technical Services: Veterinary Services (1-4: 1)
Health Care and Social Assistance: Child Day Care Services (1-4: 1)
People in group quarters in 2010:
3 people in group homes intended for adults
People in group quarters in 2000:
10 people in other group homes
Home Mortgage Disclosure Act Aggregated Statistics For Year 2009 (Based on 2 partial tracts)
A) FHA, FSA/RHS & VA Home Purchase Loans
B) Conventional Home Purchase Loans
C) Refinancings
D) Home Improvement Loans
F) Non-occupant Loans on < 5 Family Dwellings (A B C & D)
G) Loans On Manufactured Home Dwelling (A B C & D)
Number
Average Value
Number
Average Value
Number
Average Value
Number
Average Value
Number
Average Value
Number
Average Value
LOANS ORIGINATED
4
$87,158
2
$72,810
14
$113,606
2
$11,710
2
$36,110
1
$121,020
APPLICATIONS APPROVED, NOT ACCEPTED
0
$0
0
$0
2
$101,700
0
$0
0
$0
0
$0
APPLICATIONS DENIED
1
$43,330
0
$0
9
$129,657
2
$11,905
0
$0
1
$89,790
APPLICATIONS WITHDRAWN
0
$0
0
$0
4
$128,050
0
$0
0
$0
1
$37,870
FILES CLOSED FOR INCOMPLETENESS
0
$0
0
$0
0
$0
0
$0
0
$0
0
$0
Aggregated Statistics For Year 2008 (Based on 2 partial tracts)
A) FHA, FSA/RHS & VA Home Purchase Loans
B) Conventional Home Purchase Loans
C) Refinancings
D) Home Improvement Loans
F) Non-occupant Loans on < 5 Family Dwellings (A B C & D)
G) Loans On Manufactured Home Dwelling (A B C & D)
Number
Average Value
Number
Average Value
Number
Average Value
Number
Average Value
Number
Average Value
Number
Average Value
LOANS ORIGINATED
5
$99,552
2
$101,310
14
$115,586
3
$26,287
2
$32,015
2
$67,345
APPLICATIONS APPROVED, NOT ACCEPTED
0
$0
0
$0
2
$104,040
0
$0
0
$0
0
$0
APPLICATIONS DENIED
1
$80,810
2
$44,505
14
$130,672
4
$49,580
0
$0
1
$56,610
APPLICATIONS WITHDRAWN
0
$0
0
$0
5
$145,776
0
$0
0
$0
1
$114,780
FILES CLOSED FOR INCOMPLETENESS
1
$131,170
0
$0
0
$0
0
$0
0
$0
0
$0
Aggregated Statistics For Year 2007 (Based on 2 partial tracts)
A) FHA, FSA/RHS & VA Home Purchase Loans
B) Conventional Home Purchase Loans
C) Refinancings
D) Home Improvement Loans
F) Non-occupant Loans on < 5 Family Dwellings (A B C & D)
G) Loans On Manufactured Home Dwelling (A B C & D)
Number
Average Value
Number
Average Value
Number
Average Value
Number
Average Value
Number
Average Value
Number
Average Value
LOANS ORIGINATED
2
$147,765
5
$146,088
21
$106,951
4
$47,335
1
$117,510
4
$79,740
APPLICATIONS APPROVED, NOT ACCEPTED
0
$0
0
$0
7
$107,416
1
$27,720
0
$0
0
$0
APPLICATIONS DENIED
0
$0
2
$184,270
25
$122,102
5
$45,912
1
$95,260
4
$116,438
APPLICATIONS WITHDRAWN
1
$125,320
1
$92,130
6
$121,740
1
$110,480
0
$0
1
$62,850
FILES CLOSED FOR INCOMPLETENESS
0
$0
1
$93,310
1
$131,960
0
$0
0
$0
0
$0
Aggregated Statistics For Year 2006 (Based on 2 partial tracts)
A) FHA, FSA/RHS & VA Home Purchase Loans
B) Conventional Home Purchase Loans
C) Refinancings
D) Home Improvement Loans
F) Non-occupant Loans on < 5 Family Dwellings (A B C & D)
G) Loans On Manufactured Home Dwelling (A B C & D)
Number
Average Value
Number
Average Value
Number
Average Value
Number
Average Value
Number
Average Value
Number
Average Value
LOANS ORIGINATED
3
$128,703
9
$108,401
25
$107,735
7
$30,284
2
$74,565
4
$80,325
APPLICATIONS APPROVED, NOT ACCEPTED
0
$0
2
$57,000
5
$111,108
1
$21,860
0
$0
1
$96,040
APPLICATIONS DENIED
0
$0
4
$93,500
32
$113,704
7
$40,657
1
$91,740
5
$89,168
APPLICATIONS WITHDRAWN
0
$0
1
$58,950
11
$138,912
1
$121,020
0
$0
1
$112,440
FILES CLOSED FOR INCOMPLETENESS
0
$0
1
$80,810
2
$113,020
0
$0
0
$0
0
$0
Aggregated Statistics For Year 2005 (Based on 2 partial tracts)
A) FHA, FSA/RHS & VA Home Purchase Loans
B) Conventional Home Purchase Loans
C) Refinancings
D) Home Improvement Loans
F) Non-occupant Loans on < 5 Family Dwellings (A B C & D)
G) Loans On Manufactured Home Dwelling (A B C & D)
Number
Average Value
Number
Average Value
Number
Average Value
Number
Average Value
Number
Average Value
Number
Average Value
LOANS ORIGINATED
3
$131,433
16
$105,311
31
$118,732
8
$34,550
6
$90,052
7
$75,960
APPLICATIONS APPROVED, NOT ACCEPTED
1
$166,700
2
$68,905
11
$135,575
2
$10,345
1
$163,970
1
$71,830
APPLICATIONS DENIED
0
$0
5
$98,694
25
$137,920
4
$91,842
0
$0
2
$78,665
APPLICATIONS WITHDRAWN
1
$90,570
2
$133,710
15
$142,965
1
$46,850
0
$0
0
$0
FILES CLOSED FOR INCOMPLETENESS
0
$0
0
$0
8
$134,590
0
$0
0
$0
0
$0
Aggregated Statistics For Year 2004 (Based on 2 partial tracts)
A) FHA, FSA/RHS & VA Home Purchase Loans
B) Conventional Home Purchase Loans
C) Refinancings
D) Home Improvement Loans
F) Non-occupant Loans on < 5 Family Dwellings (A B C & D)
G) Loans On Manufactured Home Dwelling (A B C & D)
Number
Average Value
Number
Average Value
Number
Average Value
Number
Average Value
Number
Average Value
Number
Average Value
LOANS ORIGINATED
3
$101,503
20
$113,509
40
$118,272
7
$45,230
3
$84,587
7
$102,787
APPLICATIONS APPROVED, NOT ACCEPTED
0
$0
2
$121,025
9
$127,704
1
$46,460
1
$95,260
1
$54,270
APPLICATIONS DENIED
0
$0
7
$98,101
28
$125,444
7
$51,923
1
$58,560
5
$97,444
APPLICATIONS WITHDRAWN
0
$0
1
$206,130
12
$137,681
0
$0
0
$0
1
$164,750
FILES CLOSED FOR INCOMPLETENESS
0
$0
1
$111,650
8
$138,690
0
$0
0
$0
2
$108,335
Aggregated Statistics For Year 2003 (Based on 2 partial tracts)
A) FHA, FSA/RHS & VA Home Purchase Loans
B) Conventional Home Purchase Loans
C) Refinancings
D) Home Improvement Loans
F) Non-occupant Loans on < 5 Family Dwellings (A B C & D)
Number
Average Value
Number
Average Value
Number
Average Value
Number
Average Value
Number
Average Value
LOANS ORIGINATED
3
$109,443
16
$116,168
72
$112,641
7
$25,209
5
$62,386
APPLICATIONS APPROVED, NOT ACCEPTED
0
$0
1
$139,760
12
$121,740
1
$26,160
0
$0
APPLICATIONS DENIED
0
$0
3
$94,997
27
$116,411
2
$16,200
0
$0
APPLICATIONS WITHDRAWN
1
$121,410
1
$58,560
11
$134,191
1
$39,430
0
$0
FILES CLOSED FOR INCOMPLETENESS
0
$0
0
$0
4
$130,490
0
$0
0
$0
Aggregated Statistics For Year 1999 (Based on 1 partial tract)
A) FHA, FSA/RHS & VA Home Purchase Loans
B) Conventional Home Purchase Loans
C) Refinancings
D) Home Improvement Loans
F) Non-occupant Loans on < 5 Family Dwellings (A B C & D)

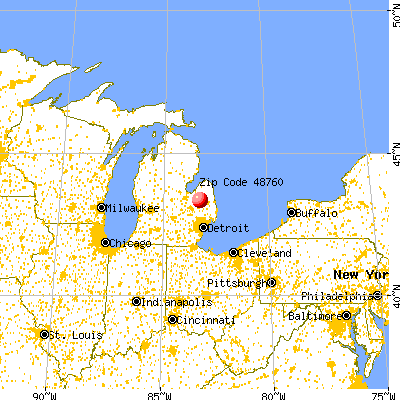


 Nearest zip codes: 48727, 48744, 48741, 48435, 48461, 48729.


