Estimated zip code population in 2022: 4,728 Zip code population in 2010: 4,382 Zip code population in 2000: 4,348
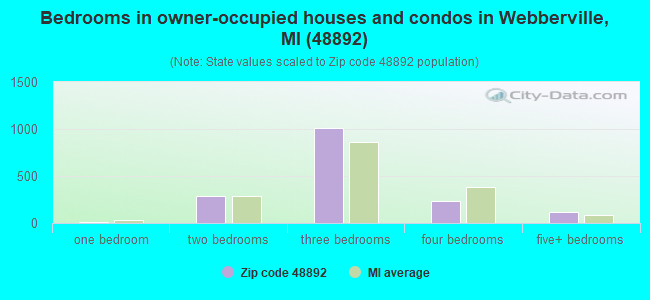
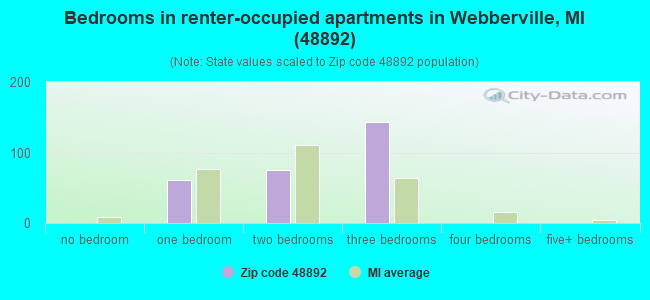
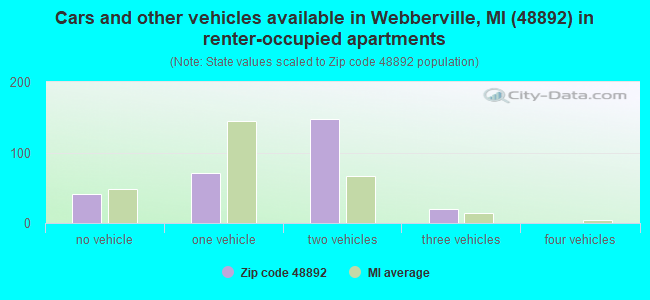
Houses and condos: 2,069 Renter-occupied apartments: 283
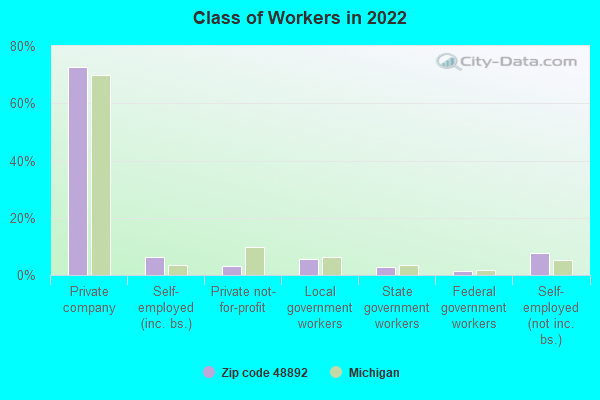
% of renters here:
15%
State:
27%
March 2022 cost of living index in zip code 48892: 80.7 (low, U.S. average is 100)
Land area: 54.3 sq. mi. Water area: 0.1 sq. mi.
Population density: 87 people per square mile
(very low).
OSM Map
General Map
Google Map
MSN Map
OSM Map
General Map
Google Map
MSN Map
OSM Map
General Map
Google Map
MSN Map
OSM Map
General Map
Google Map
MSN Map
Please wait while loading the map...
Real estate property taxes paid for housing units in 2022:
This zip code:
1.6% ($2,826)
Michigan:
1.2% ($2,746)
Median real estate property taxes paid for housing units with mortgages in 2022: $2,691 (1.4%) Median real estate property taxes paid for housing units with no mortgage in 2022: $3,305 (2.0%)
Business Search- 14 Million verified businesses
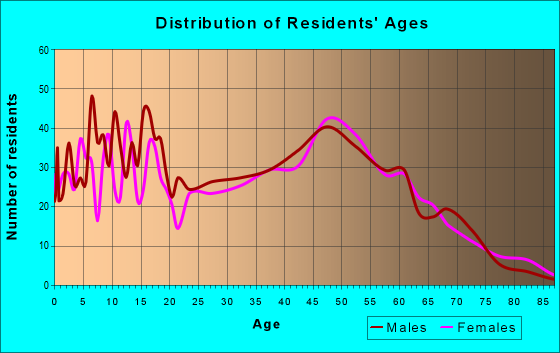
Males: 2,518
(53.3%)
Females: 2,209
(46.7%)
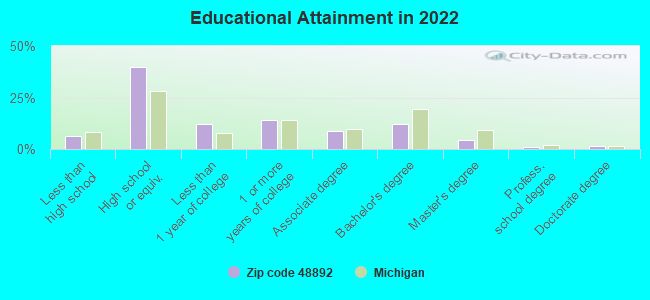
For population 25 years and over in 48892:
High school or higher: 93.0%
Bachelor's degree or higher: 18.7%
Graduate or professional degree: 6.8%
Unemployed: 4.5%
Mean travel time to work (commute): 32.8 minutes
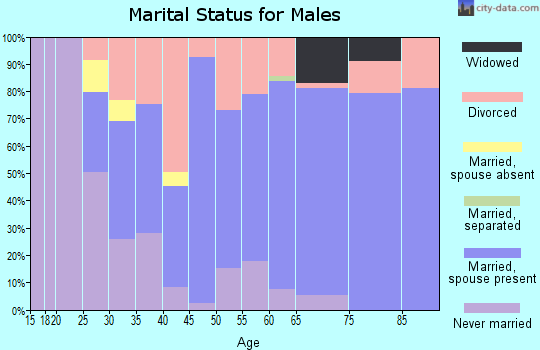
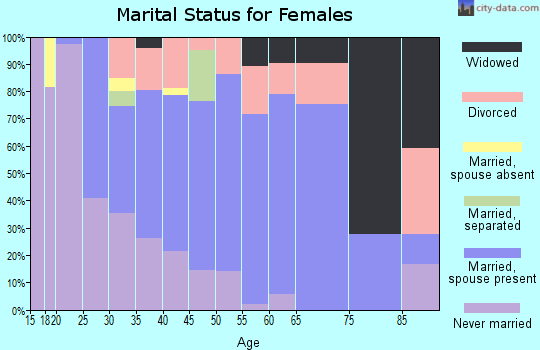
For population 15 years and over in 48892:
Never married: 24.7%
Now married: 58.0%
Separated: 1.1%
Widowed: 4.3%
Divorced: 12.0%
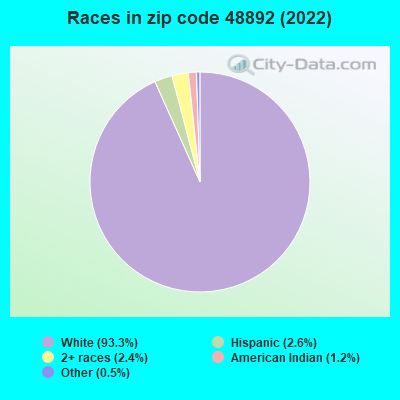
Zip code 48892 compared to state average:
Black race population percentage significantly below state average.
Hispanic race population percentage below state average.
Foreign-born population percentage significantly below state average.
Renting percentage below state average.
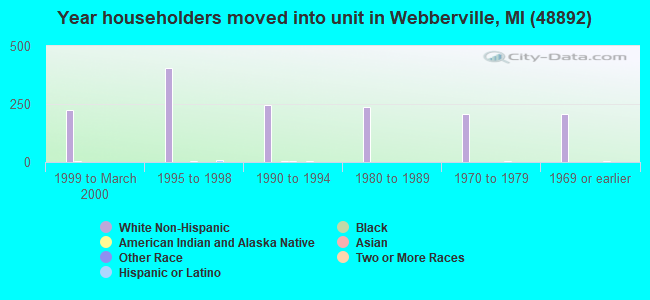
Length of stay since moving in significantly above state average.
Percentage of population with a bachelor's degree or higher below state average.
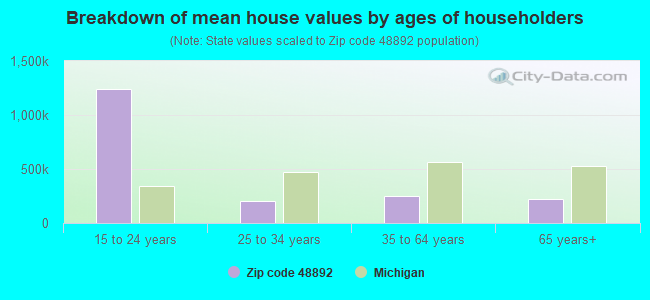
Estimated median house/condo value in 2022: $180,881
48892:
$180,881
Michigan:
$224,400
According to our research of Michigan and other state lists, there were 7 registered sex offenders living in 48892 zip code as of June 19, 2024. The ratio of all residents to sex offenders in zip code 48892 is 695 to 1. The ratio of registered sex offenders to all residents in this zip code is lower than the state average.
Median resident age:
This zip code:
43.0 years
Michigan median age:
40.3 years
Average household size:
This zip code:
2.4 people
Michigan:
2.4 people
Averages for the 2020 tax year for zip code 48892, filed in 2021:
Average Adjusted Gross Income (AGI) in 2020: $58,774 (Individual Income Tax Returns)
Here:
$58,774
State:
$68,945
Salary/wage: $52,163 (reported on 83.3% of returns)
Here:
$52,163
State:
$57,142
(% of AGI for various income ranges: 1005.9% for AGIs below $25k, 3359.1% for AGIs $25k-50k, 6131.9% for AGIs $50k-75k, 9158.2% for AGIs $75k-100k, 16168.3% for AGIs $100k-200k)
Taxable interest for individuals: $665 (reported on 26.4% of returns)
This zip code:
$665
Michigan:
$1,630
(% of AGI for various income ranges: 11.6% for AGIs below $25k, 20.9% for AGIs $25k-50k, 10.8% for AGIs $50k-75k, 38.8% for AGIs $75k-100k, 49.1% for AGIs $100k-200k)
Ordinary dividends: $1,507 (reported on 12.8% of returns)
Here:
$1,507
State:
$6,972
(% of AGI for various income ranges: 9.4% for AGIs below $25k, 18.5% for AGIs $25k-50k, 26.2% for AGIs $50k-75k, 53.5% for AGIs $75k-100k, 62.2% for AGIs $100k-200k)
Net capital gain/loss in AGI: +$8,065 (reported on 11.5% of returns)
Here:
+$8,065
State:
+$20,064
(% of AGI for various income ranges: 7.8% for AGIs below $25k, 37.2% for AGIs $25k-50k, 88.1% for AGIs $50k-75k, 156.5% for AGIs $75k-100k, 603.0% for AGIs $100k-200k)
Profit/loss from business: +$10,856 (reported on 14.1% of returns)
Here:
+$10,856
State:
+$11,172
(% of AGI for various income ranges: 92.0% for AGIs below $25k, 117.4% for AGIs $25k-50k, 166.5% for AGIs $50k-75k, 254.7% for AGIs $75k-100k, 690.0% for AGIs $100k-200k)
Taxable individual retirement arrangement distribution: $16,861 (reported on 7.9% of returns)
48892:
$16,861
Michigan:
$19,803
(% of AGI for various income ranges: 68.8% for AGIs below $25k, 64.9% for AGIs $25k-50k, 178.1% for AGIs $50k-75k, 384.1% for AGIs $75k-100k, 549.1% for AGIs $100k-200k)
Total itemized deductions: $24,889 (reported on 4.0% of returns)
Here:
$24,889
State:
$34,117
(% of AGI for various income ranges: 414.2% for AGIs $50k-75k, 505.7% for AGIs $100k-200k)
Charity contributions: $6,750 (reported on 2.6% of returns)
Here:
$6,750
State:
$13,548
(% of AGI for various income ranges: 50.0% for AGIs $50k-75k, 119.6% for AGIs $100k-200k)
Taxes paid: $7,300 (reported on 4.0% of returns)
48892:
$7,300
State:
$7,972
(% of AGI for various income ranges: 117.3% for AGIs $50k-75k, 153.0% for AGIs $100k-200k)
Earned income credit: $2,103 (reported on 14.5% of returns)
Here:
$2,103
State:
$2,251
(% of AGI for various income ranges: 70.2% for AGIs below $25k, 71.5% for AGIs $25k-50k)
Percentage of individuals using paid preparers for their 2020 taxes: 96.0%
Here:
96%
State:
93%
(% for various income ranges: 94.2% for AGIs below $25k, 98.3% for AGIs $25k-50k, 97.1% for AGIs $50k-75k, 95.8% for AGIs $75k-100k, 94.3% for AGIs $100k-200k, 100.0% for AGIs over 200k)
Averages for the 2012 tax year for zip code 48892, filed in 2013:
Average Adjusted Gross Income (AGI) in 2012: $48,290 (Individual Income Tax Returns)
Here:
$48,290
State:
$55,609
Salary/wage: $42,333 (reported on 87.9% of returns)
Here:
$42,333
State:
$46,782
(% of AGI for various income ranges: 71.1% for AGIs below $25k, 78.2% for AGIs $25k-50k, 80.0% for AGIs $50k-75k, 80.6% for AGIs $75k-100k, 74.7% for AGIs $100k-200k)
Taxable interest for individuals: $1,012 (reported on 26.5% of returns)
This zip code:
$1,012
Michigan:
$1,491
(% of AGI for various income ranges: 0.9% for AGIs below $25k, 0.8% for AGIs $25k-50k, 0.8% for AGIs $50k-75k, 0.2% for AGIs $75k-100k, 0.4% for AGIs $100k-200k)
Ordinary dividends: $1,800 (reported on 12.1% of returns)
Here:
$1,800
State:
$6,225
(% of AGI for various income ranges: 0.7% for AGIs below $25k, 0.6% for AGIs $25k-50k, 0.4% for AGIs $50k-75k, 0.2% for AGIs $75k-100k, 0.4% for AGIs $100k-200k)
Net capital gain/loss in AGI: +$2,889 (reported on 8.4% of returns)
Here:
+$2,889
State:
+$9,326
(% of AGI for various income ranges: 1.4% for AGIs $100k-200k)
Profit/loss from business: +$10,328 (reported on 13.5% of returns)
Here:
+$10,328
State:
+$11,523
(% of AGI for various income ranges: 6.6% for AGIs below $25k, 2.9% for AGIs $25k-50k, 3.1% for AGIs $50k-75k, 1.5% for AGIs $75k-100k, 2.4% for AGIs $100k-200k)
Taxable individual retirement arrangement distribution: $10,394 (reported on 7.9% of returns)
48892:
$10,394
Michigan:
$15,298
(% of AGI for various income ranges: 2.8% for AGIs below $25k, 1.5% for AGIs $25k-50k, 1.9% for AGIs $50k-75k, 4.4% for AGIs $75k-100k)
Total itemized deductions: $17,588 (22% of AGI, reported on 31.6% of returns)
Here:
$17,588
State:
$21,628
Here:
21.7% of AGI
State:
18.4% of AGI
(% of AGI for various income ranges: 9.3% for AGIs below $25k, 9.8% for AGIs $25k-50k, 11.6% for AGIs $50k-75k, 12.2% for AGIs $75k-100k, 12.7% for AGIs $100k-200k)
Charity contributions: $2,528 (reported on 23.3% of returns)
Here:
$2,528
State:
$4,225
(% of AGI for various income ranges: 0.7% for AGIs below $25k, 0.9% for AGIs $25k-50k, 1.0% for AGIs $50k-75k, 1.8% for AGIs $75k-100k, 1.4% for AGIs $100k-200k)
Taxes paid: $6,296 (reported on 31.6% of returns)
48892:
$6,296
State:
$8,327
(% of AGI for various income ranges: 2.1% for AGIs below $25k, 2.9% for AGIs $25k-50k, 3.7% for AGIs $50k-75k, 4.3% for AGIs $75k-100k, 5.5% for AGIs $100k-200k)
Earned income credit: $2,294 (reported on 16.3% of returns)
Here:
$2,294
State:
$2,306
(% of AGI for various income ranges: 5.1% for AGIs below $25k, 1.4% for AGIs $25k-50k)
Percentage of individuals using paid preparers for their 2012 taxes: 58.1%
Here:
58%
State:
57%
(% for various income ranges: 52.5% for AGIs below $25k, 60.7% for AGIs $25k-50k, 64.5% for AGIs $50k-75k, 59.1% for AGIs $75k-100k, 61.5% for AGIs $100k-200k)
Averages for the 2004 tax year for zip code 48892, filed in 2005:
Average Adjusted Gross Income (AGI) in 2004: $41,795 (Individual Income Tax Returns)
Here:
$41,795
State:
$48,204
Salary/wage: $38,761 (reported on 89.3% of returns)
Here:
$38,761
State:
$42,791
(% of AGI for various income ranges: 146.3% for AGIs below $10k, 73.7% for AGIs $10k-25k, 82.4% for AGIs $25k-50k, 85.7% for AGIs $50k-75k, 86.2% for AGIs $75k-100k, 75.6% for AGIs over 100k)
Taxable interest for individuals: $842 (reported on 42.4% of returns)
This zip code:
$842
Michigan:
$1,725
(% of AGI for various income ranges: 9.2% for AGIs below $10k, 2.2% for AGIs $10k-25k, 0.8% for AGIs $25k-50k, 0.7% for AGIs $50k-75k, 0.4% for AGIs $75k-100k, 0.4% for AGIs over 100k)
Taxable dividends: $918 (reported on 16.7% of returns)
Here:
$918
State:
$3,420
(% of AGI for various income ranges: 3.2% for AGIs below $10k, 0.6% for AGIs $10k-25k, 0.5% for AGIs $25k-50k, 0.3% for AGIs $50k-75k, 0.3% for AGIs $75k-100k, 0.2% for AGIs over 100k)
Net capital gain/loss: +$9,077 (reported on 12.6% of returns)
Here:
+$9,077
State:
+$8,532
(% of AGI for various income ranges: 0.9% for AGIs below $10k, 0.1% for AGIs $10k-25k, 0.9% for AGIs $25k-50k, 1.5% for AGIs $50k-75k, 4.5% for AGIs $75k-100k, 6.5% for AGIs over 100k)
Profit/loss from business: +$8,362 (reported on 14.8% of returns)
Here:
+$8,362
State:
+$9,547
(% of AGI for various income ranges: 1.2% for AGIs below $10k, 3.1% for AGIs $10k-25k, 2.9% for AGIs $25k-50k, 2.2% for AGIs $50k-75k, 1.5% for AGIs $75k-100k, 5.9% for AGIs over 100k)
IRA payment deduction: $1,973 (reported on 1.8% of returns)
48892:
$1,973
Michigan:
$2,875
Total itemized deductions: $16,057 (24% of AGI, reported on 40.4% of returns)
Here:
$16,057
State:
$18,509
Here:
24.0% of AGI
State:
20.7% of AGI
(% of AGI for various income ranges: 24.8% for AGIs below $10k, 10.8% for AGIs $10k-25k, 13.6% for AGIs $25k-50k, 18.1% for AGIs $50k-75k, 16.7% for AGIs $75k-100k, 14.2% for AGIs over 100k)
Charity contributions deductions: $2,044 (3% of AGI, reported on 32.0% of returns)
Here:
$2,044
State:
$3,365
Here:
3.0% of AGI
State:
3.6% of AGI
(% of AGI for various income ranges: 1.2% for AGIs below $10k, 0.7% for AGIs $10k-25k, 1.1% for AGIs $25k-50k, 1.9% for AGIs $50k-75k, 1.8% for AGIs $75k-100k, 1.8% for AGIs over 100k)
Total tax: $4,927 (reported on 78.5% of returns)
48892:
$4,927
State:
$7,691
(% of AGI for various income ranges: 4.0% for AGIs below $10k, 4.3% for AGIs $10k-25k, 6.8% for AGIs $25k-50k, 8.3% for AGIs $50k-75k, 9.6% for AGIs $75k-100k, 16.1% for AGIs over 100k)
Earned income credit: $1,589 (reported on 10.9% of returns)
Here:
$1,589
State:
$1,737
Percentage of individuals using paid preparers for their 2004 taxes: 56.3%
Here:
56%
State:
60%
(% for various income ranges: 45.5% for AGIs below $10k, 50.1% for AGIs $10k-25k, 61.1% for AGIs $25k-50k, 64.0% for AGIs $50k-75k, 55.1% for AGIs $75k-100k, 69.0% for AGIs over 100k)
Household received Food Stamps/SNAP in the past 12 months: 220 Household did not receive Food Stamps/SNAP in the past 12 months: 1,713
Women who had a birth in the past 12 months: 38 (30 now married, 8 unmarried) Women who did not have a birth in the past 12 months: 939 (435 now married, 502 unmarried)
Housing units in zip code 48892 with a mortgage: 1,056 (123 second mortgage, 109 both second mortgage and home equity loan) Houses without a mortgage: 33
Median monthly owner costs for units with a mortgage: $1,398 Median monthly owner costs for units without a mortgage: $616
Residents with income below the poverty level in 2022:
This zip code:
11.5%
Whole state:
13.4%
Residents with income below 50% of the poverty level in 2022:
This zip code:
6.6%
Whole state:
6.9%
Median number of rooms in houses and condos:
Here:
6.1
State:
6.5
Median number of rooms in apartments:
Here:
5.5
State:
4.3
Notable locations in this zip code not listed on our city pages
Notable locations in zip code 48892: Oak Lane Golf Club (A), Webberville Police Department (B), Webberville Library (C), Northeast Ingham Emergency Service Authority / Leroy Township Fire Department (D). Display/hide their locations on the map
Churches in zip code 48892 include: Wayside Tabernacle Church (A), Calvary Baptist Church (B), Webberville United Methodist Church (C), Church of Christ (D), Vantown Community Church (E). Display/hide their locations on the map
Parks in zip code 48892 include: LeRoy Township District Number Six School Historical Marker (1), White Oak Township Hall Historical Marker (2), Webberville Park (3). Display/hide their locations on the map
In group quarters: 4 (-1 institutionalized population)
Size of family households: 678 2-persons, 239 3-persons, 301 4-persons, 136 5-persons, 46 6-persons, 14 7-or-more-persons
Size of nonfamily households: 406 1-person, 107 2-persons
658 married couples with children.
283 single-parent households (89 men, 194 women).
97.2% of residents of 48892 zip code speak English at home.
0.1% of residents speak Spanish at home (100% very well).
1.9% of residents speak other Indo-European language at home (100% very well).
0.1% of residents speak Asian or Pacific Island language at home (100% very well).
0.3% of residents speak other language at home (100% very well).
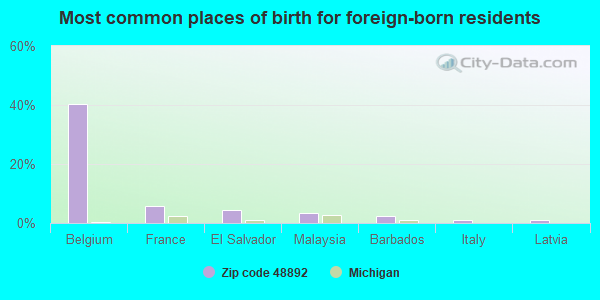
Foreign born population: 87 (1.9%) (26.8% of them are naturalized citizens)
This zip code:
1.9%
Whole state:
6.9%
40%Belgium
6%France
4%El Salvador
3%Malaysia
2%Barbados
1%Italy
1%Latvia
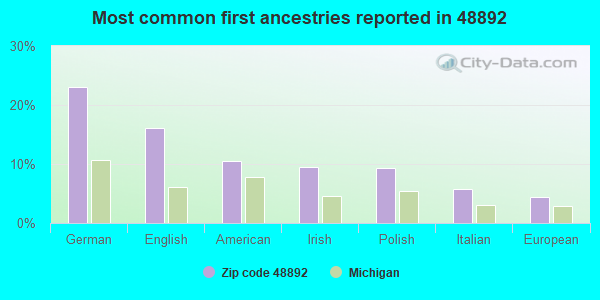
23%German
16%English
10%American
10%Irish
9%Polish
6%Italian
4%European
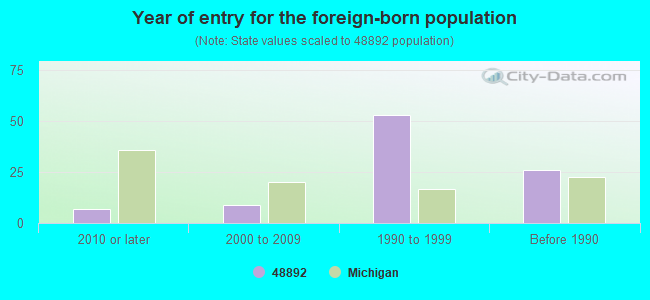
Year of entry for the foreign-born population
72010 or later
92000 to 2009
531990 to 1999
26Before 1990
Major facilities with environmental interests located in this zip code:
MI DEPT/TRANSPORTATION BRIDGE (I-96 OVER M-52 EB & WB in WEBBERVILLE, MI)
(Resource Conservation and Recovery Act (tracking hazardous waste)) Organizations: MICH DEPT OF TRANSPORTATION (CONTACT/OPERATOR)
Alternative names: MIDOT BRIDGE I-96 OVER M-52
ARCHER DANIELS MIDLAND (2700 N. STOCKBRIDGE ROAD in WEBBERVILLE, MI)
AIR MINOR (AIRS/AFS) CRITERIA AND HAZARDOUS AIR POLLUTANT INVENTORY (Inventory of air pollution sources) Conditionally Exempt Small Quantity Generators, less than 100 kg/month of hazardous waste (Resource Conservation and Recovery Act (tracking hazardous waste)) Business SIC classification: GRAIN AND FIELD BEANS Alternative names: ADM COUNTRYMARK LLC
GT USA LLC (1093 HIGHVIEW DRIVE in WEBBERVILLE, MI)
(Resource Conservation and Recovery Act (tracking hazardous waste)) Organizations: RAPHAEL DE RITIS (CONTACT/OPERATOR)
, VITTORIO AUDISIO (CONTACT/OWNER)
ALDI INC (2625 N M-52 in WEBBERVILLE, MI)
(Resource Conservation and Recovery Act (tracking hazardous waste))
MI DEPT/TRANSPORTATION BRIDGE B01-33051 (M-52 OVER RED CEDAR in WEBBERVILLE, MI)
(Resource Conservation and Recovery Act (tracking hazardous waste)) Organizations: MICH DEPT OF TRANSPORTATION (CONTACT/OPERATOR)
Alternative names: MIDOT BRIDGE M-52 OVER RED CEDAR RIVER
ACC TRANSPORT (M 52 & HASLETT RD in WEBBERVILLE, MI)
(Resource Conservation and Recovery Act (tracking hazardous waste)) Alternative names: ACC TRANSPORT (E)
Housing units lacking complete plumbing facilities: 4.1% Housing units lacking complete kitchen facilities: 1.7%
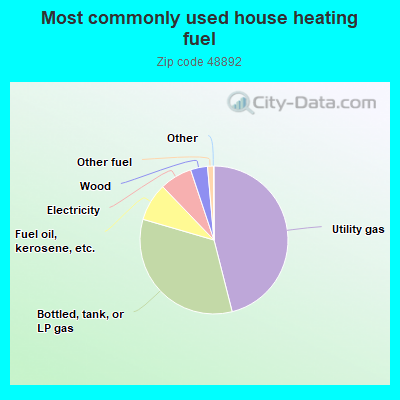
46.1%Utility gas
33.5%Bottled, tank, or LP gas
8.3%Fuel oil, kerosene, etc.
7.1%Electricity
3.7%Wood
1.3%Other fuel
Population in 1990: 4,561.
Place of birth for U.S.-born residents:
This state: 4,122
Northeast: 51
Midwest: 211
South: 174
West: 56
62% of the 48892 zip code residents lived in the same house 5 years ago. Out of people who lived in different houses, 47% lived in this county. Out of people who lived in different counties, 50% lived in Michigan.
95% of the 48892 zip code residents lived in the same house 1 year ago. Out of people who lived in different houses, 41% moved from this county. Out of people who lived in different houses, 58% moved from different county within same state. Out of people who lived in different houses, 2% moved from different state.
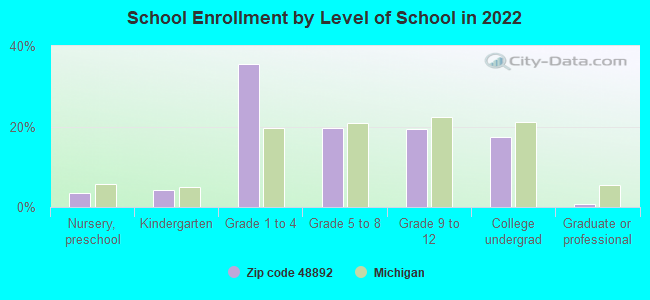
Private vs. public school enrollment:
Students in private schools in grades 1 to 8 (elementary and middle school): 18
Here:
3.5%
Michigan:
12.4%
Students in private schools in grades 9 to 12 (high school):
Here:
0.0%
Michigan:
9.8%
Students in private undergraduate colleges: 11
Here:
6.7%
Michigan:
14.9%
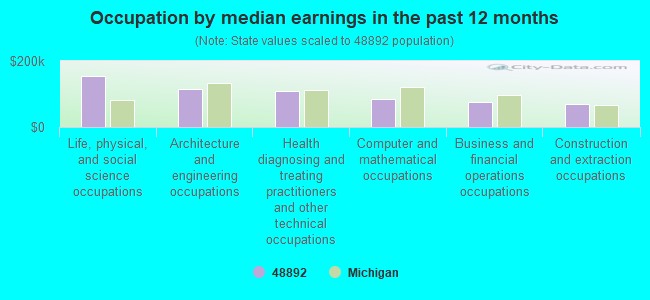
Occupation by median earnings in the past 12 months ($)
153,967Life, physical, and social science occupations
115,734Architecture and engineering occupations
108,655Health diagnosing and treating practitioners and other technical occupations
85,844Computer and mathematical occupations
75,270Business and financial operations occupations
70,407Construction and extraction occupations
Top industries in this zip code by the number of employees in 2005:
Wholesale Trade: Motor Vehicle Supplies and New Parts Merchant Wholesalers (100-249 employees: 1 establishment)
Wholesale Trade: Men's and Boys' Clothing and Furnishings Merchant Wholesalers (100-249: 1)
Construction: Plumbing, Heating, and Air-Conditioning Contractors (50-99: 1, 1-4: 2)
Accommodation and Food Services: Limited-Service Restaurants (20-49: 1)
People in group quarters in 2010:
6 people in group homes intended for adults
4 people in nursing facilities/skilled-nursing facilities
Fatal accident statistics in 2013:
Fatal accident count: 2
Vehicles involved in fatal accidents: 3
Fatal accidents caused by drunken drivers: 1
Fatalities: 2
Persons involved in fatal accidents: 3
Pedestrians involved in fatal accidents: 1
Fatal accident statistics in 2012:
Fatal accident count: 2
Vehicles involved in fatal accidents: 3
Fatal accidents caused by drunken drivers: 0
Fatalities: 3
Persons involved in fatal accidents: 5
Pedestrians involved in fatal accidents: 0
Home Mortgage Disclosure Act Aggregated Statistics For Year 2009 (Based on 8 partial tracts)
A) FHA, FSA/RHS & VA Home Purchase Loans
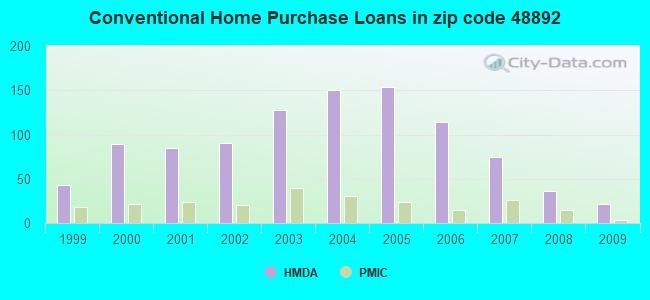
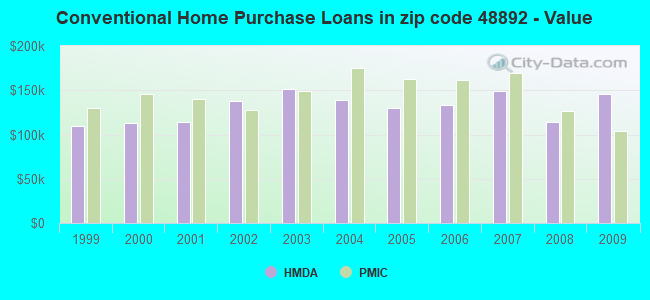
B) Conventional Home Purchase Loans
C) Refinancings
D) Home Improvement Loans
F) Non-occupant Loans on < 5 Family Dwellings (A B C & D)
G) Loans On Manufactured Home Dwelling (A B C & D)
Number
Average Value
Number
Average Value
Number
Average Value
Number
Average Value
Number
Average Value
Number
Average Value
LOANS ORIGINATED
42
$116,856
22
$145,711
143
$149,395
8
$43,682
9
$113,657
5
$52,584
APPLICATIONS APPROVED, NOT ACCEPTED
4
$101,315
4
$74,938
16
$195,631
1
$10,950
1
$72,650
2
$22,245
APPLICATIONS DENIED
8
$121,372
8
$70,105
60
$156,309
6
$13,477
2
$120,060
5
$44,942
APPLICATIONS WITHDRAWN
9
$116,690
1
$144,390
35
$147,949
1
$22,590
1
$88,580
0
$0
FILES CLOSED FOR INCOMPLETENESS
3
$85,163
2
$160,065
8
$148,441
0
$0
1
$84,260
0
$0
Aggregated Statistics For Year 2008 (Based on 8 partial tracts)
A) FHA, FSA/RHS & VA Home Purchase Loans
B) Conventional Home Purchase Loans
C) Refinancings
D) Home Improvement Loans
F) Non-occupant Loans on < 5 Family Dwellings (A B C & D)
G) Loans On Manufactured Home Dwelling (A B C & D)
Number
Average Value
Number
Average Value
Number
Average Value
Number
Average Value
Number
Average Value
Number
Average Value
LOANS ORIGINATED
33
$121,643
36
$114,300
111
$157,079
13
$34,115
8
$106,035
10
$48,048
APPLICATIONS APPROVED, NOT ACCEPTED
5
$130,474
5
$110,514
21
$142,761
2
$40,790
1
$32,600
3
$55,710
APPLICATIONS DENIED
8
$117,049
13
$86,042
103
$160,902
16
$99,732
8
$135,490
7
$58,527
APPLICATIONS WITHDRAWN
8
$113,781
3
$103,740
39
$168,640
2
$132,745
2
$129,915
2
$113,300
FILES CLOSED FOR INCOMPLETENESS
1
$123,600
1
$54,580
8
$121,594
1
$90,930
0
$0
0
$0
Aggregated Statistics For Year 2007 (Based on 8 partial tracts)
A) FHA, FSA/RHS & VA Home Purchase Loans
B) Conventional Home Purchase Loans
C) Refinancings
D) Home Improvement Loans
F) Non-occupant Loans on < 5 Family Dwellings (A B C & D)
G) Loans On Manufactured Home Dwelling (A B C & D)
Number
Average Value
Number
Average Value
Number
Average Value
Number
Average Value
Number
Average Value
Number
Average Value
LOANS ORIGINATED
10
$122,744
75
$149,208
184
$154,131
33
$56,548
11
$147,675
13
$91,137
APPLICATIONS APPROVED, NOT ACCEPTED
1
$191,730
11
$146,106
43
$152,940
4
$44,672
3
$103,907
4
$88,825
APPLICATIONS DENIED
4
$155,022
21
$144,930
170
$163,346
30
$53,536
7
$111,346
8
$98,089
APPLICATIONS WITHDRAWN
2
$115,390
9
$124,306
64
$172,865
4
$159,775
1
$84,860
2
$130,085
FILES CLOSED FOR INCOMPLETENESS
0
$0
3
$370,383
19
$183,227
2
$54,555
0
$0
0
$0
Aggregated Statistics For Year 2006 (Based on 8 partial tracts)
A) FHA, FSA/RHS & VA Home Purchase Loans
B) Conventional Home Purchase Loans
C) Refinancings
D) Home Improvement Loans
F) Non-occupant Loans on < 5 Family Dwellings (A B C & D)
G) Loans On Manufactured Home Dwelling (A B C & D)
Number
Average Value
Number
Average Value
Number
Average Value
Number
Average Value
Number
Average Value
Number
Average Value
LOANS ORIGINATED
10
$155,167
114
$133,351
295
$129,309
36
$45,678
13
$127,312
11
$80,696
APPLICATIONS APPROVED, NOT ACCEPTED
2
$134,955
21
$119,628
41
$117,037
10
$43,145
4
$92,608
1
$81,410
APPLICATIONS DENIED
1
$111,220
32
$143,478
173
$140,985
32
$64,860
9
$111,657
17
$64,268
APPLICATIONS WITHDRAWN
4
$117,895
21
$178,823
88
$151,586
7
$88,054
4
$114,932
5
$95,558
FILES CLOSED FOR INCOMPLETENESS
0
$0
3
$189,290
30
$161,423
1
$241,080
1
$170,740
0
$0
Aggregated Statistics For Year 2005 (Based on 8 partial tracts)
A) FHA, FSA/RHS & VA Home Purchase Loans
B) Conventional Home Purchase Loans
C) Refinancings
D) Home Improvement Loans
F) Non-occupant Loans on < 5 Family Dwellings (A B C & D)
G) Loans On Manufactured Home Dwelling (A B C & D)
Number
Average Value
Number
Average Value
Number
Average Value
Number
Average Value
Number
Average Value
Number
Average Value
LOANS ORIGINATED
9
$149,239
154
$130,007
333
$146,172
36
$50,491
16
$118,934
11
$80,972
APPLICATIONS APPROVED, NOT ACCEPTED
0
$0
25
$119,152
61
$158,393
5
$23,138
5
$117,828
5
$61,268
APPLICATIONS DENIED
1
$36,130
48
$122,794
199
$156,347
36
$72,450
10
$99,125
17
$58,546
APPLICATIONS WITHDRAWN
2
$109,405
27
$124,170
116
$152,362
12
$198,256
2
$130,950
2
$108,715
FILES CLOSED FOR INCOMPLETENESS
0
$0
5
$154,170
51
$184,675
1
$118,480
1
$127,940
0
$0
Aggregated Statistics For Year 2004 (Based on 8 partial tracts)
A) FHA, FSA/RHS & VA Home Purchase Loans
B) Conventional Home Purchase Loans
C) Refinancings
D) Home Improvement Loans
F) Non-occupant Loans on < 5 Family Dwellings (A B C & D)
G) Loans On Manufactured Home Dwelling (A B C & D)
Number
Average Value
Number
Average Value
Number
Average Value
Number
Average Value
Number
Average Value
Number
Average Value
LOANS ORIGINATED
9
$168,817
150
$139,052
374
$148,268
38
$58,708
18
$109,993
15
$97,953
APPLICATIONS APPROVED, NOT ACCEPTED
0
$0
16
$130,975
60
$152,348
6
$13,450
3
$73,737
6
$52,325
APPLICATIONS DENIED
1
$86,480
38
$116,254
192
$148,376
19
$78,204
9
$72,992
21
$76,029
APPLICATIONS WITHDRAWN
0
$0
11
$150,813
120
$154,650
6
$62,780
5
$104,526
3
$100,507
FILES CLOSED FOR INCOMPLETENESS
0
$0
6
$166,150
48
$161,708
3
$58,267
3
$110,380
2
$125,925
Aggregated Statistics For Year 2003 (Based on 8 partial tracts)
A) FHA, FSA/RHS & VA Home Purchase Loans
B) Conventional Home Purchase Loans
C) Refinancings
D) Home Improvement Loans
F) Non-occupant Loans on < 5 Family Dwellings (A B C & D)
Number
Average Value
Number
Average Value
Number
Average Value
Number
Average Value
Number
Average Value
LOANS ORIGINATED
17
$137,746
128
$150,923
753
$140,342
25
$41,587
12
$116,935
APPLICATIONS APPROVED, NOT ACCEPTED
2
$106,590
13
$128,609
85
$137,087
5
$30,088
2
$99,185
APPLICATIONS DENIED
4
$99,245
37
$111,554
218
$137,596
23
$25,437
2
$123,505
APPLICATIONS WITHDRAWN
0
$0
9
$98,269
108
$143,910
1
$151,590
1
$137,830
FILES CLOSED FOR INCOMPLETENESS
0
$0
6
$142,290
29
$150,794
2
$89,035
1
$140,020
Aggregated Statistics For Year 2002 (Based on 4 partial tracts)
A) FHA, FSA/RHS & VA Home Purchase Loans
B) Conventional Home Purchase Loans
C) Refinancings
D) Home Improvement Loans
F) Non-occupant Loans on < 5 Family Dwellings (A B C & D)
Number
Average Value
Number
Average Value
Number
Average Value
Number
Average Value
Number
Average Value
LOANS ORIGINATED
12
$109,390
90
$137,644
410
$129,944
19
$42,088
12
$87,022
APPLICATIONS APPROVED, NOT ACCEPTED
1
$140,710
12
$95,855
55
$126,281
2
$13,875
1
$62,770
APPLICATIONS DENIED
4
$126,632
29
$71,167
115
$116,578
15
$21,899
3
$125,143
APPLICATIONS WITHDRAWN
3
$109,810
5
$135,400
61
$124,961
2
$46,390
3
$141,947
FILES CLOSED FOR INCOMPLETENESS
2
$95,635
3
$95,773
32
$147,611
1
$46,340
1
$55,610
Aggregated Statistics For Year 2001 (Based on 4 partial tracts)
A) FHA, FSA/RHS & VA Home Purchase Loans
B) Conventional Home Purchase Loans
C) Refinancings
D) Home Improvement Loans
F) Non-occupant Loans on < 5 Family Dwellings (A B C & D)
Number
Average Value
Number
Average Value
Number
Average Value
Number
Average Value
Number
Average Value
LOANS ORIGINATED
16
$127,099
85
$113,763
359
$117,373
36
$27,401
8
$58,130
APPLICATIONS APPROVED, NOT ACCEPTED
1
$132,070
15
$67,407
42
$97,558
11
$14,671
0
$0
APPLICATIONS DENIED
4
$131,112
37
$83,038
120
$104,718
14
$17,261
1
$259,000
APPLICATIONS WITHDRAWN
2
$125,035
8
$120,659
63
$116,071
2
$51,210
1
$74,980
FILES CLOSED FOR INCOMPLETENESS
0
$0
0
$0
16
$110,596
0
$0
0
$0
Aggregated Statistics For Year 2000 (Based on 4 partial tracts)
A) FHA, FSA/RHS & VA Home Purchase Loans
B) Conventional Home Purchase Loans
C) Refinancings
D) Home Improvement Loans
F) Non-occupant Loans on < 5 Family Dwellings (A B C & D)
Number
Average Value
Number
Average Value
Number
Average Value
Number
Average Value
Number
Average Value
LOANS ORIGINATED
16
$114,442
89
$112,589
129
$96,914
33
$27,347
7
$53,521
APPLICATIONS APPROVED, NOT ACCEPTED
1
$35,290
25
$53,374
28
$84,564
16
$16,681
3
$22,113
APPLICATIONS DENIED
2
$111,190
66
$56,319
90
$102,052
15
$14,825
4
$48,192
APPLICATIONS WITHDRAWN
3
$93,247
8
$99,320
43
$77,445
4
$35,000
1
$78,360
FILES CLOSED FOR INCOMPLETENESS
2
$83,415
3
$125,057
9
$101,497
1
$16,850
0
$0
Aggregated Statistics For Year 1999 (Based on 2 partial tracts)
A) FHA, FSA/RHS & VA Home Purchase Loans
B) Conventional Home Purchase Loans
C) Refinancings
D) Home Improvement Loans
F) Non-occupant Loans on < 5 Family Dwellings (A B C & D)
2002 - 2018 National Fire Incident Reporting System (NFIRS) incidents
Based on the data from the years 2002 - 2018 the average number of fires per year is 20. The highest number of fire incidents - 37 took place in 2012, and the least - 12 in 2003. The data has a decreasing trend.
When looking into fire subcategories, the most reports belonged to: Structure Fires (56.6%), and Outside Fires (24.6%).
Fire incident types reported to NFIRS in Zip Code 48892
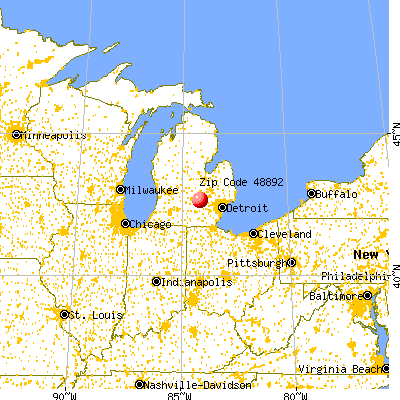


 Nearest zip codes: 48836, 48895, 48819, 49285, 48872, 48137.


 Based on the data from the years 2002 - 2018 the average number of fires per year is 20. The highest number of fire incidents - 37 took place in 2012, and the least - 12 in 2003. The data has a decreasing trend.
 When looking into fire subcategories, the most reports belonged to: Structure Fires (56.6%), and Outside Fires (24.6%).