Estimated zip code population in 2022: 4,972 Zip code population in 2010: 5,446 Zip code population in 2000: 4,581
Houses and condos: 3,181 Renter-occupied apartments: 186
% of renters here:
8%
State:
27%
March 2022 cost of living index in zip code 49346: 81.5 (low, U.S. average is 100)
Land area: 64.4 sq. mi. Water area: 2.7 sq. mi.
Population density: 77 people per square mile
(very low).
OSM Map
General Map
Google Map
MSN Map
OSM Map
General Map
Google Map
MSN Map
OSM Map
General Map
Google Map
MSN Map
OSM Map
General Map
Google Map
MSN Map
Please wait while loading the map...
Real estate property taxes paid for housing units in 2022:
This zip code:
0.9% ($2,029)
Michigan:
1.2% ($2,746)
Median real estate property taxes paid for housing units with mortgages in 2022: $1,866 (0.8%) Median real estate property taxes paid for housing units with no mortgage in 2022: $2,217 (0.9%)
Estimated median house/condo value in 2022: $233,550
49346:
$233,550
Michigan:
$224,400
According to our research of Michigan and other state lists, there were 19 registered sex offenders living in 49346 zip code as of May 09, 2024. The ratio of all residents to sex offenders in zip code 49346 is 279 to 1. The ratio of registered sex offenders to all residents in this zip code is near the state average.
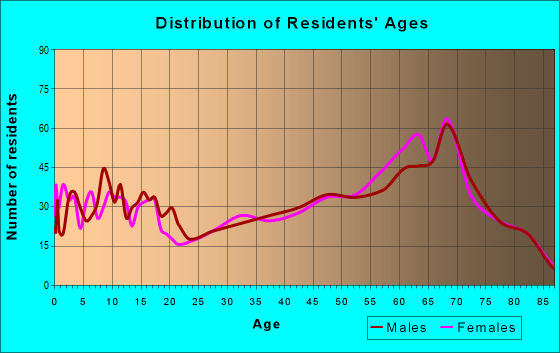
Median resident age:
This zip code:
56.1 years
Michigan median age:
40.3 years
Average household size:
This zip code:
2.3 people
Michigan:
2.4 people
Averages for the 2020 tax year for zip code 49346, filed in 2021:
Average Adjusted Gross Income (AGI) in 2020: $67,255 (Individual Income Tax Returns)
Here:
$67,255
State:
$68,945
Salary/wage: $55,668 (reported on 65.3% of returns)
Here:
$55,668
State:
$57,142
(% of AGI for various income ranges: 906.4% for AGIs below $25k, 2728.0% for AGIs $25k-50k, 4567.4% for AGIs $50k-75k, 6773.3% for AGIs $75k-100k, 12771.8% for AGIs $100k-200k, 59412.5% for AGIs over 200k)
Taxable interest for individuals: $1,154 (reported on 38.4% of returns)
This zip code:
$1,154
Michigan:
$1,630
(% of AGI for various income ranges: 25.7% for AGIs below $25k, 29.2% for AGIs $25k-50k, 51.5% for AGIs $50k-75k, 98.6% for AGIs $75k-100k, 136.1% for AGIs $100k-200k, 670.0% for AGIs over 200k)
Ordinary dividends: $5,228 (reported on 24.9% of returns)
Here:
$5,228
State:
$6,972
(% of AGI for various income ranges: 37.4% for AGIs below $25k, 70.8% for AGIs $25k-50k, 157.4% for AGIs $50k-75k, 192.9% for AGIs $75k-100k, 325.0% for AGIs $100k-200k, 3650.0% for AGIs over 200k)
Net capital gain/loss in AGI: +$9,421 (reported on 24.2% of returns)
Here:
+$9,421
State:
+$20,064
(% of AGI for various income ranges: 14.9% for AGIs below $25k, 47.3% for AGIs $25k-50k, 123.8% for AGIs $50k-75k, 297.6% for AGIs $75k-100k, 594.3% for AGIs $100k-200k, 9382.5% for AGIs over 200k)
Profit/loss from business: +$10,815 (reported on 16.2% of returns)
Here:
+$10,815
State:
+$11,172
(% of AGI for various income ranges: 216.8% for AGIs below $25k, 173.5% for AGIs $25k-50k, 202.4% for AGIs $50k-75k, 210.0% for AGIs $75k-100k, 530.4% for AGIs $100k-200k, 1357.5% for AGIs over 200k)
Taxable individual retirement arrangement distribution: $23,192 (reported on 19.9% of returns)
49346:
$23,192
Michigan:
$19,803
(% of AGI for various income ranges: 139.4% for AGIs below $25k, 289.8% for AGIs $25k-50k, 652.9% for AGIs $50k-75k, 979.5% for AGIs $75k-100k, 1636.8% for AGIs $100k-200k, 6515.0% for AGIs over 200k)
Total itemized deductions: $32,667 (reported on 5.1% of returns)
Here:
$32,667
State:
$34,117
(% of AGI for various income ranges: 108.3% for AGIs below $25k, 162.4% for AGIs $50k-75k, 278.6% for AGIs $75k-100k, 441.1% for AGIs $100k-200k, 4885.0% for AGIs over 200k)
Charity contributions: $12,300 (reported on 4.0% of returns)
Here:
$12,300
State:
$13,548
(% of AGI for various income ranges: 72.1% for AGIs $50k-75k, 90.0% for AGIs $100k-200k, 2447.5% for AGIs over 200k)
Taxes paid: $6,927 (reported on 5.1% of returns)
49346:
$6,927
State:
$7,972
(% of AGI for various income ranges: 23.6% for AGIs below $25k, 60.3% for AGIs $50k-75k, 111.4% for AGIs $100k-200k, 992.5% for AGIs over 200k)
Earned income credit: $2,020 (reported on 10.1% of returns)
Here:
$2,020
State:
$2,251
(% of AGI for various income ranges: 65.8% for AGIs below $25k, 50.4% for AGIs $25k-50k)
Percentage of individuals using paid preparers for their 2020 taxes: 92.6%
Here:
93%
State:
93%
(% for various income ranges: 89.9% for AGIs below $25k, 92.5% for AGIs $25k-50k, 93.9% for AGIs $50k-75k, 93.9% for AGIs $75k-100k, 95.7% for AGIs $100k-200k, 92.3% for AGIs over 200k)
Averages for the 2012 tax year for zip code 49346, filed in 2013:
Average Adjusted Gross Income (AGI) in 2012: $52,219 (Individual Income Tax Returns)
Here:
$52,219
State:
$55,609
Salary/wage: $40,117 (reported on 65.6% of returns)
Here:
$40,117
State:
$46,782
(% of AGI for various income ranges: 51.7% for AGIs below $25k, 51.1% for AGIs $25k-50k, 46.6% for AGIs $50k-75k, 51.5% for AGIs $75k-100k, 51.9% for AGIs $100k-200k, 49.0% for AGIs over 200k)
Taxable interest for individuals: $1,110 (reported on 44.4% of returns)
This zip code:
$1,110
Michigan:
$1,491
(% of AGI for various income ranges: 2.2% for AGIs below $25k, 0.9% for AGIs $25k-50k, 0.9% for AGIs $50k-75k, 0.6% for AGIs $75k-100k, 0.9% for AGIs $100k-200k, 0.8% for AGIs over 200k)
Ordinary dividends: $3,872 (reported on 27.6% of returns)
Here:
$3,872
State:
$6,225
(% of AGI for various income ranges: 1.8% for AGIs below $25k, 2.0% for AGIs $25k-50k, 2.1% for AGIs $50k-75k, 2.3% for AGIs $75k-100k, 1.7% for AGIs $100k-200k, 2.7% for AGIs over 200k)
Net capital gain/loss in AGI: +$2,703 (reported on 24.0% of returns)
Here:
+$2,703
State:
+$9,326
(% of AGI for various income ranges: 0.3% for AGIs below $25k, 0.3% for AGIs $25k-50k, 1.1% for AGIs $75k-100k, 2.1% for AGIs $100k-200k, 3.6% for AGIs over 200k)
Profit/loss from business: +$8,602 (reported on 17.2% of returns)
Here:
+$8,602
State:
+$11,523
(% of AGI for various income ranges: 6.6% for AGIs below $25k, 2.1% for AGIs $25k-50k, 1.2% for AGIs $50k-75k, 3.5% for AGIs $75k-100k, 3.8% for AGIs $100k-200k)
Taxable individual retirement arrangement distribution: $15,394 (reported on 25.6% of returns)
49346:
$15,394
Michigan:
$15,298
(% of AGI for various income ranges: 7.0% for AGIs below $25k, 7.6% for AGIs $25k-50k, 7.7% for AGIs $50k-75k, 7.6% for AGIs $75k-100k, 10.6% for AGIs $100k-200k)
Total itemized deductions: $19,705 (22% of AGI, reported on 29.2% of returns)
Here:
$19,705
State:
$21,628
Here:
22.1% of AGI
State:
18.4% of AGI
(% of AGI for various income ranges: 11.8% for AGIs below $25k, 10.3% for AGIs $25k-50k, 10.2% for AGIs $50k-75k, 10.0% for AGIs $75k-100k, 12.0% for AGIs $100k-200k, 12.2% for AGIs over 200k)
Charity contributions: $3,512 (reported on 24.0% of returns)
Here:
$3,512
State:
$4,225
(% of AGI for various income ranges: 1.3% for AGIs below $25k, 1.0% for AGIs $25k-50k, 1.4% for AGIs $50k-75k, 1.4% for AGIs $75k-100k, 2.3% for AGIs $100k-200k, 1.8% for AGIs over 200k)
Taxes paid: $6,297 (reported on 28.8% of returns)
49346:
$6,297
State:
$8,327
(% of AGI for various income ranges: 1.9% for AGIs below $25k, 2.3% for AGIs $25k-50k, 2.6% for AGIs $50k-75k, 3.2% for AGIs $75k-100k, 4.8% for AGIs $100k-200k, 5.4% for AGIs over 200k)
Earned income credit: $2,103 (reported on 12.8% of returns)
Here:
$2,103
State:
$2,306
(% of AGI for various income ranges: 4.5% for AGIs below $25k, 0.7% for AGIs $25k-50k)
Percentage of individuals using paid preparers for their 2012 taxes: 53.6%
Here:
54%
State:
57%
(% for various income ranges: 46.2% for AGIs below $25k, 52.5% for AGIs $25k-50k, 56.4% for AGIs $50k-75k, 62.1% for AGIs $75k-100k, 61.5% for AGIs $100k-200k, 100.0% for AGIs over 200k)
Averages for the 2004 tax year for zip code 49346, filed in 2005:
Average Adjusted Gross Income (AGI) in 2004: $44,504 (Individual Income Tax Returns)
Here:
$44,504
State:
$48,204
Salary/wage: $32,529 (reported on 71.3% of returns)
Here:
$32,529
State:
$42,791
(% of AGI for various income ranges: 84.3% for AGIs below $10k, 51.8% for AGIs $10k-25k, 57.7% for AGIs $25k-50k, 53.5% for AGIs $50k-75k, 51.1% for AGIs $75k-100k, 45.3% for AGIs over 100k)
Taxable interest for individuals: $1,767 (reported on 57.2% of returns)
This zip code:
$1,767
Michigan:
$1,725
(% of AGI for various income ranges: 9.5% for AGIs below $10k, 4.1% for AGIs $10k-25k, 1.7% for AGIs $25k-50k, 1.7% for AGIs $50k-75k, 2.2% for AGIs $75k-100k, 2.3% for AGIs over 100k)
Taxable dividends: $3,317 (reported on 35.5% of returns)
Here:
$3,317
State:
$3,420
(% of AGI for various income ranges: 5.3% for AGIs below $10k, 3.9% for AGIs $10k-25k, 1.8% for AGIs $25k-50k, 2.7% for AGIs $50k-75k, 2.4% for AGIs $75k-100k, 3.0% for AGIs over 100k)
Net capital gain/loss: +$6,687 (reported on 30.2% of returns)
Here:
+$6,687
State:
+$8,532
(% of AGI for various income ranges: -1.9% for AGIs below $10k, 1.1% for AGIs $10k-25k, 0.5% for AGIs $25k-50k, 1.3% for AGIs $50k-75k, 2.5% for AGIs $75k-100k, 14.0% for AGIs over 100k)
Profit/loss from business: +$8,314 (reported on 17.6% of returns)
Here:
+$8,314
State:
+$9,547
(% of AGI for various income ranges: 8.0% for AGIs below $10k, 4.8% for AGIs $10k-25k, 2.5% for AGIs $25k-50k, 2.1% for AGIs $50k-75k, 3.8% for AGIs $75k-100k, 3.9% for AGIs over 100k)
IRA payment deduction: $3,079 (reported on 3.2% of returns)
49346:
$3,079
Michigan:
$2,875
(% of AGI for various income ranges: 0.3% for AGIs $10k-25k, 0.2% for AGIs $25k-50k, 0.3% for AGIs $50k-75k, 0.1% for AGIs $75k-100k, 0.2% for AGIs over 100k)
Self-employed pension: $11,133 (reported on 0.6% of returns)
Here:
$11,133
Michigan:
$13,826
Total itemized deductions: $16,141 (22% of AGI, reported on 35.8% of returns)
Here:
$16,141
State:
$18,509
Here:
22.3% of AGI
State:
20.7% of AGI
(% of AGI for various income ranges: 22.8% for AGIs below $10k, 14.1% for AGIs $10k-25k, 12.1% for AGIs $25k-50k, 12.6% for AGIs $50k-75k, 14.2% for AGIs $75k-100k, 12.2% for AGIs over 100k)
Charity contributions deductions: $2,879 (4% of AGI, reported on 30.3% of returns)
Here:
$2,879
State:
$3,365
Here:
3.7% of AGI
State:
3.6% of AGI
(% of AGI for various income ranges: 1.2% for AGIs below $10k, 1.3% for AGIs $10k-25k, 1.3% for AGIs $25k-50k, 1.8% for AGIs $50k-75k, 2.6% for AGIs $75k-100k, 2.4% for AGIs over 100k)
Total tax: $5,798 (reported on 77.5% of returns)
49346:
$5,798
State:
$7,691
(% of AGI for various income ranges: 3.9% for AGIs below $10k, 3.3% for AGIs $10k-25k, 6.3% for AGIs $25k-50k, 8.8% for AGIs $50k-75k, 10.5% for AGIs $75k-100k, 16.7% for AGIs over 100k)
Earned income credit: $1,557 (reported on 10.3% of returns)
Here:
$1,557
State:
$1,737
Percentage of individuals using paid preparers for their 2004 taxes: 61.0%
Here:
61%
State:
60%
(% for various income ranges: 59.4% for AGIs below $10k, 58.4% for AGIs $10k-25k, 60.9% for AGIs $25k-50k, 62.3% for AGIs $50k-75k, 62.5% for AGIs $75k-100k, 68.1% for AGIs over 100k)
Likely homosexual households (counted as self-reported same-sex unmarried-partner households)
Lesbian couples: 0.0% of all households
Gay men: 0.1% of all households
Household received Food Stamps/SNAP in the past 12 months: 270 Household did not receive Food Stamps/SNAP in the past 12 months: 1,919
Women who had a birth in the past 12 months: 42 (41 now married, 2 unmarried) Women who did not have a birth in the past 12 months: 752 (317 now married, 434 unmarried)
Housing units in zip code 49346 with a mortgage: 1,050 (89 second mortgage, 65 both second mortgage and home equity loan) Houses without a mortgage: 8
Median monthly owner costs for units with a mortgage: $1,140 Median monthly owner costs for units without a mortgage: $481
Residents with income below the poverty level in 2022:
This zip code:
11.9%
Whole state:
13.4%
Residents with income below 50% of the poverty level in 2022:
This zip code:
9.4%
Whole state:
6.9%
Median number of rooms in houses and condos:
Here:
6.7
State:
6.5
Median number of rooms in apartments:
Here:
5.4
State:
4.3
Notable locations in this zip code not listed on our city pages
Notable locations in zip code 49346: Canadian Lakes Country Club (A), Tullymore Golf Course (B), Saint Ives Golf Club (C), Mecosta - Austin Fire Department (D), Morton Township Fire and Rescue Canadian Lakes Station (E). Display/hide their locations on the map
Churches in zip code 49346 include: Stanwood Free Methodist Church (A), Northland United Methodist Church (B), Saint Thomas Lutheran Church (C), Austin Church (D). Display/hide their locations on the map
Lakes and reservoirs: Canadian Lakes (A), Lost Canyon Lake (B), Ranger Lake (C), Lake of the Clouds (D), Lost Lake (E), West Canadian Lake (F), East Canadian Lake (G), Dukes Lake (H). Display/hide their locations on the map
Rivers and creeks: West Branch Little Muskegon River (A), Betts Creek (B), Bennett Creek (C), Hodgers Creek (D), Cedar Creek (E), Macks Creek (F), Laverne Creek (G), Little Bear Creek (H), East Branch Little Muskegon River (I). Display/hide their locations on the map
Size of family households: 1,073 2-persons, 199 3-persons, 149 4-persons, 82 5-persons, 32 6-persons, 58 7-or-more-persons
Size of nonfamily households: 553 1-person, 51 2-persons
642 married couples with children.
153 single-parent households (24 men, 129 women).
94.4% of residents of 49346 zip code speak English at home.
0.7% of residents speak Spanish at home (68% very well, 32% not well).
5.4% of residents speak other Indo-European language at home (89% very well, 11% well).
0.3% of residents speak other language at home (100% very well).
Foreign born population: 51 (1.0%) (67.8% of them are naturalized citizens)
This zip code:
1.0%
Whole state:
6.9%
22%Belgium
22%France
8%Sweden
4%Australia
21%German
18%English
15%Polish
11%Dutch
8%American
6%Irish
3%French
Year of entry for the foreign-born population
222010 or later
62000 to 2009
01990 to 1999
40Before 1990
Facilities with environmental interests located in this zip code:
GREAT SPRING WATERS OF AMERICA (ICE MOUNTAIN BOTTLING PLANT in STANWOOD, MI)
National Pollutant Discharge Elimination System NON-MAJOR (Tracking pollutant discharge elimination systems) - permit Business SIC classification: BOTTLED AND CANNED SOFT DRINKS AND CARBONATED WATERS Alternative names: GREAT SPRING WATERS-ICE MT PLT, ICE MOUNTAIN BOTTLING PLANT
ADVENTURE ISLAND (9747 90TH AVENUE in STANWOOD, MI)
ENFORCEMENT/COMPLIANCE ACTIVITY (Integrated Compliance Information System)
Housing units lacking complete plumbing facilities: 3.2% Housing units lacking complete kitchen facilities: 1.7%
67.2%Utility gas
17.2%Bottled, tank, or LP gas
11.2%Wood
2.6%Electricity
1.3%Other fuel
0.7%Fuel oil, kerosene, etc.
Population in 1990: 3,068. Population change in the 1990s: +1,513 (+49.3%).
Place of birth for U.S.-born residents:
This state: 4,076
Northeast: 152
Midwest: 373
South: 178
West: 124
53% of the 49346 zip code residents lived in the same house 5 years ago. Out of people who lived in different houses, 36% lived in this county. Out of people who lived in different counties, 50% lived in Michigan.
95% of the 49346 zip code residents lived in the same house 1 year ago. Out of people who lived in different houses, 27% moved from this county. Out of people who lived in different houses, 53% moved from different county within same state. Out of people who lived in different houses, 26% moved from different state.
Private vs. public school enrollment:
Students in private schools in grades 1 to 8 (elementary and middle school): 95
Here:
26.0%
Michigan:
12.4%
Students in private schools in grades 9 to 12 (high school): 8
Here:
4.0%
Michigan:
9.8%
Students in private undergraduate colleges: 11
Here:
11.6%
Michigan:
14.9%
Occupation by median earnings in the past 12 months ($)
106,074Health diagnosing and treating practitioners and other technical occupations
101,429Architecture and engineering occupations
66,658Computer and mathematical occupations
61,402Sales and related occupations
59,687Material moving occupations
51,742Management occupations
Top industries in this zip code by the number of employees in 2005:
Administrative and Support and Waste Management and Remediation Services: Office Administrative Services (50-99: 1)
Wholesale Trade: Petroleum Bulk Stations and Terminals (50-99: 1)
Accommodation and Food Services: Full-Service Restaurants (20-49: 1)
Other Services (except Public Administration): Other Similar Organizations (except Business, Professional, Labor, and Political Organizations) (20-49: 1)
Health Care and Social Assistance: Offices of Physicians (except Mental Health Specialists) (10-19: 1, 5-9: 1, 1-4: 1)
Construction: New Single-Family Housing Construction (except Operative Builders) (5-9: 1, 1-4: 5)
People in group quarters in 2000:
12 people in other noninstitutional group quarters
Fatal accident statistics in 2014:
Fatal accident count: 1
Vehicles involved in fatal accidents: 2
Fatal accidents caused by drunken drivers: 0
Fatalities: 2
Persons involved in fatal accidents: 4
Pedestrians involved in fatal accidents: 0
Fatal accident statistics in 2013:
Fatal accident count: 1
Vehicles involved in fatal accidents: 1
Fatal accidents caused by drunken drivers: 0
Fatalities: 1
Persons involved in fatal accidents: 3
Pedestrians involved in fatal accidents: 0
2002 - 2018 National Fire Incident Reporting System (NFIRS) incidents
According to the data from the years 2002 - 2018 the average number of fires per year is 20. The highest number of fire incidents - 40 took place in 2003, and the least - 0 in 2006. The data has a rising trend.
When looking into fire subcategories, the most incidents belonged to: Structure Fires (48.7%), and Outside Fires (36.4%).
Fire incident types reported to NFIRS in Zip Code 49346


 Nearest zip codes: 49336, 49307, 49342, 49332, 49329, 49320.


 According to the data from the years 2002 - 2018 the average number of fires per year is 20. The highest number of fire incidents - 40 took place in 2003, and the least - 0 in 2006. The data has a rising trend.
 When looking into fire subcategories, the most incidents belonged to: Structure Fires (48.7%), and Outside Fires (36.4%).