Estimated zip code population in 2022: 7,248 Zip code population in 2010: 6,987 Zip code population in 2000: 6,185
Houses and condos: 3,365 Renter-occupied apartments: 974
% of renters here:
35%
State:
27%
March 2022 cost of living index in zip code 49930: 77.9 (low, U.S. average is 100)
Land area: 48.9 sq. mi. Water area: 4.7 sq. mi.
Population density: 148 people per square mile
(very low).
OSM Map
General Map
Google Map
MSN Map
OSM Map
General Map
Google Map
MSN Map
OSM Map
General Map
Google Map
MSN Map
OSM Map
General Map
Google Map
MSN Map
Please wait while loading the map...
Real estate property taxes paid for housing units in 2022:
This zip code:
1.3% ($2,644)
Michigan:
1.2% ($2,746)
Median real estate property taxes paid for housing units with mortgages in 2022: $2,943 (1.2%) Median real estate property taxes paid for housing units with no mortgage in 2022: $2,376 (1.4%)
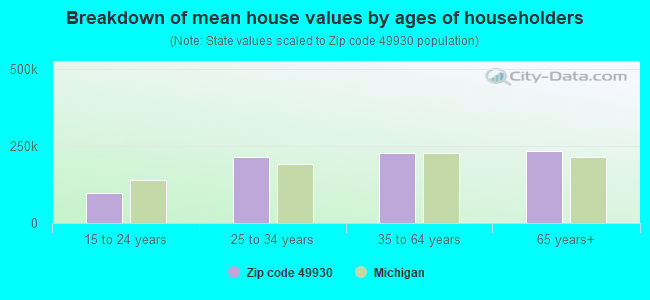
Estimated median house/condo value in 2022: $206,546
49930:
$206,546
Michigan:
$224,400
According to our research of Michigan and other state lists, there were 11 registered sex offenders living in 49930 zip code as of June 04, 2024. The ratio of all residents to sex offenders in zip code 49930 is 652 to 1. The ratio of registered sex offenders to all residents in this zip code is lower than the state average.
Median resident age:
This zip code:
30.8 years
Michigan median age:
40.3 years
Average household size:
This zip code:
2.4 people
Michigan:
2.4 people
Averages for the 2020 tax year for zip code 49930, filed in 2021:
Average Adjusted Gross Income (AGI) in 2020: $58,019 (Individual Income Tax Returns)
Here:
$58,019
State:
$68,945
Salary/wage: $48,295 (reported on 81.4% of returns)
Here:
$48,295
State:
$57,142
(% of AGI for various income ranges: 1159.9% for AGIs below $25k, 3385.3% for AGIs $25k-50k, 6015.6% for AGIs $50k-75k, 8915.7% for AGIs $75k-100k, 15651.8% for AGIs $100k-200k, 54527.5% for AGIs over 200k)
Taxable interest for individuals: $1,313 (reported on 32.2% of returns)
This zip code:
$1,313
Michigan:
$1,630
(% of AGI for various income ranges: 12.2% for AGIs below $25k, 25.5% for AGIs $25k-50k, 50.9% for AGIs $50k-75k, 44.8% for AGIs $75k-100k, 88.2% for AGIs $100k-200k, 1577.5% for AGIs over 200k)
Ordinary dividends: $4,395 (reported on 23.3% of returns)
Here:
$4,395
State:
$6,972
(% of AGI for various income ranges: 22.5% for AGIs below $25k, 48.4% for AGIs $25k-50k, 116.6% for AGIs $50k-75k, 197.1% for AGIs $75k-100k, 461.4% for AGIs $100k-200k, 2420.0% for AGIs over 200k)
Net capital gain/loss in AGI: +$9,474 (reported on 20.5% of returns)
Here:
+$9,474
State:
+$20,064
(% of AGI for various income ranges: 13.8% for AGIs below $25k, 14.0% for AGIs $25k-50k, 139.7% for AGIs $50k-75k, 299.5% for AGIs $75k-100k, 585.5% for AGIs $100k-200k, 8987.5% for AGIs over 200k)
Profit/loss from business: +$14,126 (reported on 13.2% of returns)
Here:
+$14,126
State:
+$11,172
(% of AGI for various income ranges: 44.1% for AGIs below $25k, 86.5% for AGIs $25k-50k, 174.1% for AGIs $50k-75k, 576.2% for AGIs $75k-100k, 692.7% for AGIs $100k-200k, 4372.5% for AGIs over 200k)
Taxable individual retirement arrangement distribution: $17,194 (reported on 11.4% of returns)
49930:
$17,194
Michigan:
$19,803
(% of AGI for various income ranges: 81.4% for AGIs below $25k, 105.2% for AGIs $25k-50k, 252.5% for AGIs $50k-75k, 430.5% for AGIs $75k-100k, 1042.7% for AGIs $100k-200k, 2182.5% for AGIs over 200k)
Total itemized deductions: $31,982 (reported on 3.5% of returns)
Here:
$31,982
State:
$34,117
(% of AGI for various income ranges: 382.5% for AGIs $50k-75k, 385.0% for AGIs $100k-200k, 3617.5% for AGIs over 200k)
Charity contributions: $13,871 (reported on 2.2% of returns)
Here:
$13,871
State:
$13,548
(% of AGI for various income ranges: 141.0% for AGIs $75k-100k, 1687.5% for AGIs over 200k)
Taxes paid: $7,091 (reported on 3.5% of returns)
49930:
$7,091
State:
$7,972
(% of AGI for various income ranges: 70.6% for AGIs $50k-75k, 99.1% for AGIs $100k-200k, 840.0% for AGIs over 200k)
Earned income credit: $1,819 (reported on 11.4% of returns)
Here:
$1,819
State:
$2,251
(% of AGI for various income ranges: 43.7% for AGIs below $25k, 48.5% for AGIs $25k-50k)
Percentage of individuals using paid preparers for their 2020 taxes: 91.2%
Here:
91%
State:
93%
(% for various income ranges: 90.5% for AGIs below $25k, 93.6% for AGIs $25k-50k, 90.9% for AGIs $50k-75k, 90.3% for AGIs $75k-100k, 89.2% for AGIs $100k-200k, 90.9% for AGIs over 200k)
Averages for the 2012 tax year for zip code 49930, filed in 2013:
Average Adjusted Gross Income (AGI) in 2012: $46,098 (Individual Income Tax Returns)
Here:
$46,098
State:
$55,609
Salary/wage: $38,708 (reported on 82.6% of returns)
Here:
$38,708
State:
$46,782
(% of AGI for various income ranges: 75.9% for AGIs below $25k, 76.1% for AGIs $25k-50k, 70.3% for AGIs $50k-75k, 73.4% for AGIs $75k-100k, 70.4% for AGIs $100k-200k, 49.5% for AGIs over 200k)
Taxable interest for individuals: $1,266 (reported on 42.9% of returns)
This zip code:
$1,266
Michigan:
$1,491
(% of AGI for various income ranges: 1.6% for AGIs below $25k, 1.2% for AGIs $25k-50k, 1.0% for AGIs $50k-75k, 0.5% for AGIs $75k-100k, 1.2% for AGIs $100k-200k, 1.7% for AGIs over 200k)
Ordinary dividends: $4,175 (reported on 24.0% of returns)
Here:
$4,175
State:
$6,225
(% of AGI for various income ranges: 1.4% for AGIs below $25k, 1.8% for AGIs $25k-50k, 2.0% for AGIs $50k-75k, 1.7% for AGIs $75k-100k, 2.9% for AGIs $100k-200k, 2.9% for AGIs over 200k)
Net capital gain/loss in AGI: +$4,663 (reported on 17.1% of returns)
Here:
+$4,663
State:
+$9,326
(% of AGI for various income ranges: 0.7% for AGIs $25k-50k, 1.2% for AGIs $50k-75k, 1.4% for AGIs $75k-100k, 3.1% for AGIs $100k-200k, 3.5% for AGIs over 200k)
Profit/loss from business: +$11,388 (reported on 14.3% of returns)
Here:
+$11,388
State:
+$11,523
(% of AGI for various income ranges: 1.8% for AGIs below $25k, 2.9% for AGIs $25k-50k, 3.8% for AGIs $50k-75k, 4.5% for AGIs $75k-100k, 2.6% for AGIs $100k-200k, 5.3% for AGIs over 200k)
Taxable individual retirement arrangement distribution: $13,060 (reported on 12.2% of returns)
49930:
$13,060
Michigan:
$15,298
(% of AGI for various income ranges: 4.1% for AGIs below $25k, 2.9% for AGIs $25k-50k, 3.1% for AGIs $50k-75k, 2.4% for AGIs $75k-100k, 7.6% for AGIs $100k-200k)
Total itemized deductions: $20,557 (19% of AGI, reported on 18.8% of returns)
Here:
$20,557
State:
$21,628
Here:
19.3% of AGI
State:
18.4% of AGI
(% of AGI for various income ranges: 5.4% for AGIs below $25k, 4.9% for AGIs $25k-50k, 7.1% for AGIs $50k-75k, 8.7% for AGIs $75k-100k, 12.8% for AGIs $100k-200k, 10.3% for AGIs over 200k)
Charity contributions: $3,668 (reported on 14.3% of returns)
Here:
$3,668
State:
$4,225
(% of AGI for various income ranges: 0.3% for AGIs below $25k, 0.4% for AGIs $25k-50k, 1.0% for AGIs $50k-75k, 1.3% for AGIs $75k-100k, 2.1% for AGIs $100k-200k, 1.4% for AGIs over 200k)
Taxes paid: $7,815 (reported on 18.8% of returns)
49930:
$7,815
State:
$8,327
(% of AGI for various income ranges: 0.9% for AGIs below $25k, 1.4% for AGIs $25k-50k, 2.3% for AGIs $50k-75k, 3.0% for AGIs $75k-100k, 5.2% for AGIs $100k-200k, 5.7% for AGIs over 200k)
Earned income credit: $1,650 (reported on 16.0% of returns)
Here:
$1,650
State:
$2,306
(% of AGI for various income ranges: 3.5% for AGIs below $25k, 0.9% for AGIs $25k-50k)
Percentage of individuals using paid preparers for their 2012 taxes: 46.3%
Here:
46%
State:
57%
(% for various income ranges: 39.2% for AGIs below $25k, 47.8% for AGIs $25k-50k, 52.6% for AGIs $50k-75k, 52.0% for AGIs $75k-100k, 60.0% for AGIs $100k-200k, 80.0% for AGIs over 200k)
Averages for the 2004 tax year for zip code 49930, filed in 2005:
Average Adjusted Gross Income (AGI) in 2004: $35,154 (Individual Income Tax Returns)
Here:
$35,154
State:
$48,204
Salary/wage: $30,651 (reported on 84.5% of returns)
Here:
$30,651
State:
$42,791
(% of AGI for various income ranges: 103.6% for AGIs below $10k, 73.8% for AGIs $10k-25k, 78.4% for AGIs $25k-50k, 78.2% for AGIs $50k-75k, 69.8% for AGIs $75k-100k, 63.0% for AGIs over 100k)
Taxable interest for individuals: $1,497 (reported on 52.1% of returns)
This zip code:
$1,497
Michigan:
$1,725
(% of AGI for various income ranges: 7.0% for AGIs below $10k, 3.1% for AGIs $10k-25k, 1.5% for AGIs $25k-50k, 1.7% for AGIs $50k-75k, 2.3% for AGIs $75k-100k, 2.5% for AGIs over 100k)
Taxable dividends: $3,125 (reported on 27.9% of returns)
Here:
$3,125
State:
$3,420
(% of AGI for various income ranges: 4.1% for AGIs below $10k, 1.7% for AGIs $10k-25k, 1.3% for AGIs $25k-50k, 1.8% for AGIs $50k-75k, 2.8% for AGIs $75k-100k, 4.4% for AGIs over 100k)
Net capital gain/loss: +$4,520 (reported on 19.4% of returns)
Here:
+$4,520
State:
+$8,532
(% of AGI for various income ranges: -1.7% for AGIs below $10k, 0.2% for AGIs $10k-25k, 1.0% for AGIs $25k-50k, 1.0% for AGIs $50k-75k, 2.8% for AGIs $75k-100k, 7.0% for AGIs over 100k)
Profit/loss from business: +$8,156 (reported on 13.9% of returns)
Here:
+$8,156
State:
+$9,547
(% of AGI for various income ranges: 3.0% for AGIs below $10k, 2.8% for AGIs $10k-25k, 2.8% for AGIs $25k-50k, 3.1% for AGIs $50k-75k, 2.9% for AGIs $75k-100k, 4.4% for AGIs over 100k)
IRA payment deduction: $3,084 (reported on 3.5% of returns)
49930:
$3,084
Michigan:
$2,875
(% of AGI for various income ranges: 0.3% for AGIs $10k-25k, 0.4% for AGIs $25k-50k, 0.3% for AGIs $50k-75k, 0.3% for AGIs $75k-100k, 0.2% for AGIs over 100k)
Self-employed pension: $6,800 (reported on 0.6% of returns)
Here:
$6,800
Michigan:
$13,826
Total itemized deductions: $16,149 (20% of AGI, reported on 17.8% of returns)
Here:
$16,149
State:
$18,509
Here:
20.4% of AGI
State:
20.7% of AGI
(% of AGI for various income ranges: 6.0% for AGIs below $10k, 3.8% for AGIs $10k-25k, 6.4% for AGIs $25k-50k, 8.3% for AGIs $50k-75k, 11.0% for AGIs $75k-100k, 10.7% for AGIs over 100k)
Charity contributions deductions: $3,392 (4% of AGI, reported on 15.6% of returns)
Here:
$3,392
State:
$3,365
Here:
4.1% of AGI
State:
3.6% of AGI
(% of AGI for various income ranges: 0.5% for AGIs $10k-25k, 0.9% for AGIs $25k-50k, 1.3% for AGIs $50k-75k, 1.6% for AGIs $75k-100k, 3.0% for AGIs over 100k)
Total tax: $4,719 (reported on 70.9% of returns)
49930:
$4,719
State:
$7,691
(% of AGI for various income ranges: 2.2% for AGIs below $10k, 4.1% for AGIs $10k-25k, 6.6% for AGIs $25k-50k, 8.4% for AGIs $50k-75k, 10.2% for AGIs $75k-100k, 17.0% for AGIs over 100k)
Earned income credit: $1,418 (reported on 14.1% of returns)
Here:
$1,418
State:
$1,737
Percentage of individuals using paid preparers for their 2004 taxes: 46.1%
Here:
46%
State:
60%
(% for various income ranges: 33.9% for AGIs below $10k, 44.6% for AGIs $10k-25k, 48.6% for AGIs $25k-50k, 55.7% for AGIs $50k-75k, 57.2% for AGIs $75k-100k, 67.6% for AGIs over 100k)
Likely homosexual households (counted as self-reported same-sex unmarried-partner households)
Lesbian couples: 0.0% of all households
Gay men: 0.0% of all households
Household received Food Stamps/SNAP in the past 12 months: 181 Household did not receive Food Stamps/SNAP in the past 12 months: 2,598
Women who had a birth in the past 12 months: 67 (43 now married, 24 unmarried) Women who did not have a birth in the past 12 months: 1,544 (518 now married, 1,028 unmarried)
Housing units in zip code 49930 with a mortgage: 861 (107 second mortgage, 6 home equity loan, 105 both second mortgage and home equity loan) Houses without a mortgage: 58
Median monthly owner costs for units with a mortgage: $1,326 Median monthly owner costs for units without a mortgage: $528
Residents with income below the poverty level in 2022:
This zip code:
15.0%
Whole state:
13.4%
Residents with income below 50% of the poverty level in 2022:
This zip code:
6.1%
Whole state:
6.9%
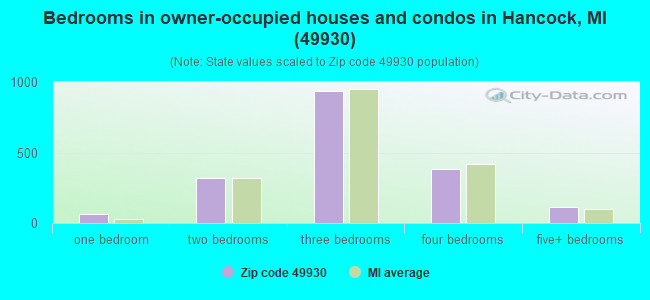
Median number of rooms in houses and condos:
Here:
6.9
State:
6.5
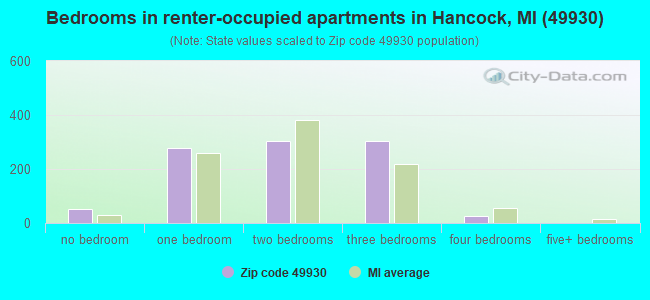
Median number of rooms in apartments:
Here:
4.2
State:
4.3
Notable locations in this zip code not listed on our city pages
Notable locations in zip code 49930: Madern Contractors Incorporated (A), Osceola Point Light (B), Maki Oil Company (C), Portage Lake Marina (D), Quincy Mining Company (E), Clairmont Transfer Company (F), Range Oil and Gas Company (G), Yalmer Mattila Contracting Company (H), Copper Country Concrete Company (I), Lily Pond Leading Light (J), Arens Fuel Company (K), Lily Pond North Light (L), Mount Ripley Ski Area (M), Hancock County Fairgrounds (N), Hancock Campgrounds (O), Lily Pond South Light (P), Quincy - Franklin - Hancock Township Volunteer Fire Department (Q), Houghton County Memorial Airport (R), Old Main (S), Finnish-American Heritage Center (T). Display/hide their locations on the map
Churches in zip code 49930 include: Chapel of Saint Matthew (A), First United Methodist Church (B), Saints Peter and Paul Lutheran Church (C), Salvation Army Church (D), Church of the Resurrection (E), Gloria Dei Lutheran Church (F), Church of Christ (G), Glad Tidings Assembly of God Church (H), Copper Country Church of the Nazarene (I). Display/hide their locations on the map
Creeks: Swedetown Creek (A), Spring Creek (B), Boston Creek (C), Lily Creek (D), Lovell Creek (E), Saint Johns Creek (F), Quincy Creek (G). Display/hide their locations on the map
Parks in zip code 49930 include: Keweenaw National Historical Park (1), Terrace Park (2), Town Hall and Fire Hall Historical Marker (3), Hancock Historical Marker (4), Suomi College Historical Marker (5), Old Main Historical Marker (6), McLain State Park (7). Display/hide their locations on the map
1,128 married couples with children.
266 single-parent households (122 men, 144 women).
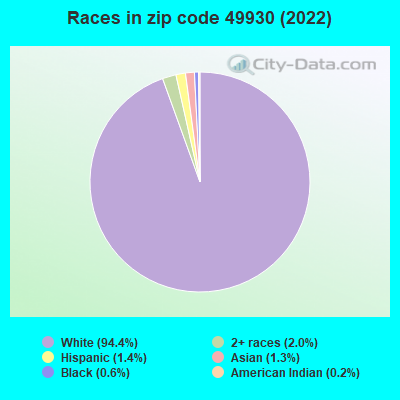
94.1% of residents of 49930 zip code speak English at home.
0.7% of residents speak Spanish at home (81% very well, 12% well, 8% not well).
2.6% of residents speak other Indo-European language at home (100% very well).
0.6% of residents speak Asian or Pacific Island language at home (69% very well, 12% well, 19% not well).
2.0% of residents speak other language at home (38% very well, 11% well, 33% not well, 18% not at all).
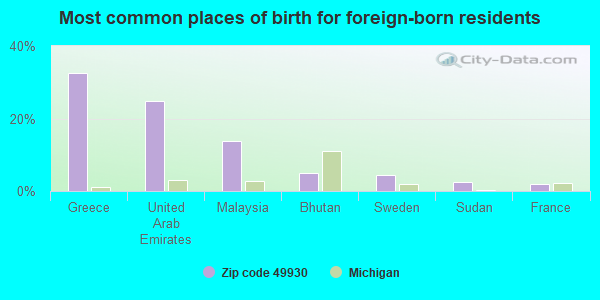
Foreign born population: 341 (4.7%) (33.9% of them are naturalized citizens)
This zip code:
4.7%
Whole state:
6.9%
32%Greece
25%United Arab Emirates
14%Malaysia
5%Bhutan
4%Sweden
3%Sudan
2%France
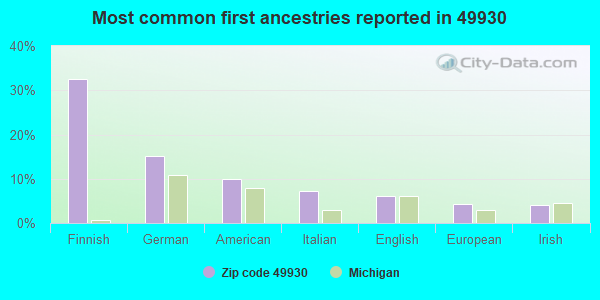
33%Finnish
15%German
10%American
7%Italian
6%English
4%European
4%Irish
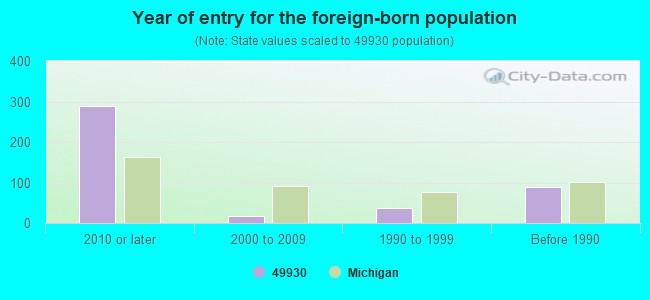
Year of entry for the foreign-born population
2902010 or later
172000 to 2009
361990 to 1999
90Before 1990
Facilities with environmental interests located in this zip code:
MI DEPT/TRANSPORTATION BRIDGE C01-31031 (M-203 OVER SWEDE TOWN CREEK in HANCOCK, MI)
(Resource Conservation and Recovery Act (tracking hazardous waste)) Organizations: MICH DEPT OF TRANSPORTATION (CONTACT/OWNER)
Alternative names: MIDOT BRIDGE M-203 OVER SWEDE TOWN CRK
MI DEPT/AGRICULTURE (U.P. PESTICIDE CLEANUP in HANCOCK, MI)
(Resource Conservation and Recovery Act (tracking hazardous waste))
ED HOYER (1107 SUMMIT in HANCOCK, MI)
(Resource Conservation and Recovery Act (tracking hazardous waste))
FINE LINE TIRE INC (634 HANCOCK ST in HANCOCK, MI)
Conditionally Exempt Small Quantity Generators, less than 100 kg/month of hazardous waste (Resource Conservation and Recovery Act (tracking hazardous waste)) Organizations: CLARK D KORPELA (CONTACT/OPERATOR)
Alternative names: GOODYEAR FINE LINE TIRE
EVERT MOTOOR SLS INC (315 DAKOTA ST in HANCOCK, MI)
Conditionally Exempt Small Quantity Generators, less than 100 kg/month of hazardous waste (Resource Conservation and Recovery Act (tracking hazardous waste)) - notification Organizations: EVERT JAMES (CONTACT/OWNER)
Housing units lacking complete plumbing facilities: 2.2% Housing units lacking complete kitchen facilities: 1.5%
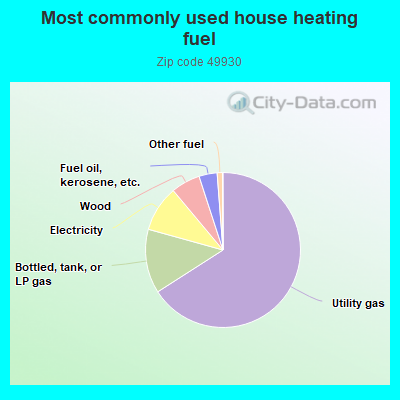
66.0%Utility gas
13.4%Bottled, tank, or LP gas
9.6%Electricity
6.1%Wood
3.8%Fuel oil, kerosene, etc.
1.1%Other fuel
Population in 1990: 7,683.
Place of birth for U.S.-born residents:
This state: 5,123
Northeast: 180
Midwest: 1,022
South: 261
West: 269
58% of the 49930 zip code residents lived in the same house 5 years ago. Out of people who lived in different houses, 48% lived in this county. Out of people who lived in different counties, 50% lived in Michigan.
87% of the 49930 zip code residents lived in the same house 1 year ago. Out of people who lived in different houses, 50% moved from this county. Out of people who lived in different houses, 34% moved from different county within same state. Out of people who lived in different houses, 14% moved from different state.
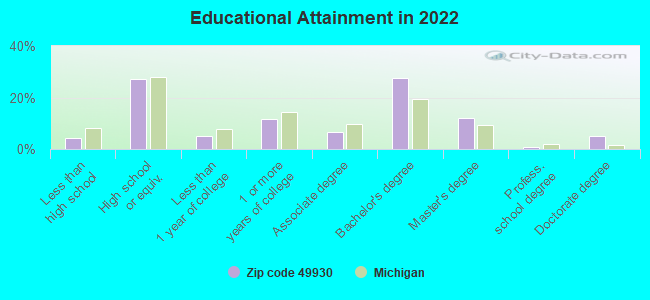
Private vs. public school enrollment:
Students in private schools in grades 1 to 8 (elementary and middle school): 56
Here:
8.6%
Michigan:
12.4%
Students in private schools in grades 9 to 12 (high school): 24
Here:
5.7%
Michigan:
9.8%
Students in private undergraduate colleges: 128
Here:
16.2%
Michigan:
14.9%
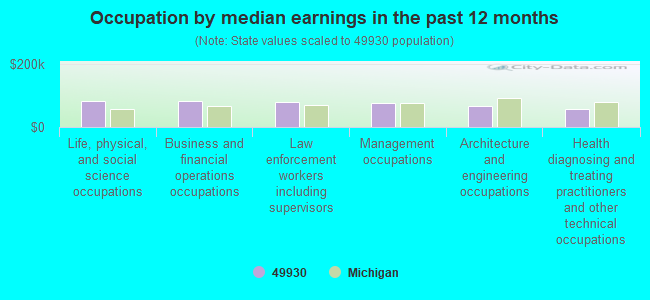
Occupation by median earnings in the past 12 months ($)
83,522Life, physical, and social science occupations
83,278Business and financial operations occupations
79,625Law enforcement workers including supervisors
75,100Management occupations
65,619Architecture and engineering occupations
56,107Health diagnosing and treating practitioners and other technical occupations
Companies with federal contracts located in this zip code:
SUPERIOR COACHES & DELIVERY, I (51003 PONTIAC ROAD in HANCOCK, MI; small business)
$7,646 with Army for Passenger Motor Charter Service. Signed on 2002-06-10. Completion date: 2002-06-21.
WAUBIK INC (801 N LINCOLN DR STE 305 in HANCOCK, MI; small business) : -$40,176 in 2 contractsin 1999
$0 with Navy for Miscellaneous Defense Hard Goods -- Management and Support (R&D). Signed on 1999-10-01. Completion date: 2000-09-30.
-$40,176, same as above.Signed on 1999-10-01. Completion date: 2000-09-30.
Top industries in this zip code by the number of employees in 2005:
Finance and Insurance: Commercial Banking (50-99: 2, 1-4: 1)
Health Care and Social Assistance: Nursing Care Facilities (50-99: 2, 1-4: 1)
Health Care and Social Assistance: Other Individual and Family Services (50-99: 1, 10-19: 1, 5-9: 1)
Health Care and Social Assistance: Services for the Elderly and Persons with Disabilities (50-99: 1, 5-9: 1)
Health Care and Social Assistance: Offices of Dentists (20-49: 1, 5-9: 3, 1-4: 2)
People in group quarters in 2010:
313 people in nursing facilities/skilled-nursing facilities
162 people in college/university student housing
20 people in group homes intended for adults
People in group quarters in 2000:
295 people in nursing homes
88 people in college dormitories (includes college quarters off campus)
12 people in homes for the mentally retarded
10 people in other group homes
Fatal accident statistics in 2014:
Fatal accident count: 1
Vehicles involved in fatal accidents: 1
Fatal accidents caused by drunken drivers: 0
Fatalities: 1
Persons involved in fatal accidents: 1
Pedestrians involved in fatal accidents: 0
Fatal accident statistics in 2011:
Fatal accident count: 1
Vehicles involved in fatal accidents: 1
Fatal accidents caused by drunken drivers: 1
Fatalities: 1
Persons involved in fatal accidents: 1
Pedestrians involved in fatal accidents: 0
2002 - 2018 National Fire Incident Reporting System (NFIRS) incidents
According to the data from the years 2002 - 2018 the average number of fire incidents per year is 15. The highest number of fire incidents - 32 took place in 2003, and the least - 0 in 2014. The data has a dropping trend.
When looking into fire subcategories, the most incidents belonged to: Structure Fires (50.2%), and Outside Fires (26.3%).
Fire incident types reported to NFIRS in Zip Code 49930

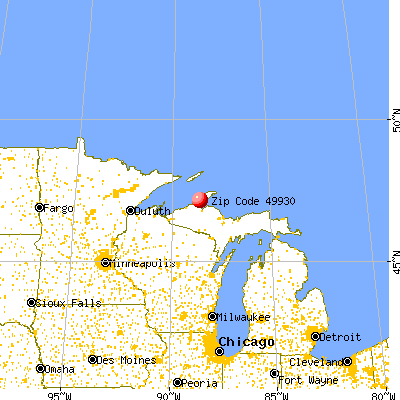


 Nearest zip codes: 49921, 49922, 49931, 49934, 49913, 49942.


 According to the data from the years 2002 - 2018 the average number of fire incidents per year is 15. The highest number of fire incidents - 32 took place in 2003, and the least - 0 in 2014. The data has a dropping trend.
 When looking into fire subcategories, the most incidents belonged to: Structure Fires (50.2%), and Outside Fires (26.3%).