Estimated zip code population in 2022: 1,103 Zip code population in 2010: 1,093 Zip code population in 2000: 1,208
Houses and condos: 457 Renter-occupied apartments: 66
% of renters here:
16%
State:
28%
March 2022 cost of living index in zip code 51573: 81.2 (low, U.S. average is 100)
Land area: 60.3 sq. mi. Water area: 0.0 sq. mi.
Population density: 18 people per square mile
(very low).
OSM Map
General Map
Google Map
MSN Map
OSM Map
General Map
Google Map
MSN Map
OSM Map
General Map
Google Map
MSN Map
OSM Map
General Map
Google Map
MSN Map
Please wait while loading the map...
Real estate property taxes paid for housing units in 2022:
This zip code:
1.5% ($1,734)
Iowa:
1.4% ($2,724)
Median real estate property taxes paid for housing units with mortgages in 2022: $1,846 (1.7%) Median real estate property taxes paid for housing units with no mortgage in 2022: $1,528 (1.1%)
Business Search- 14 Million verified businesses
Males: 569
(51.6%)
Females: 533
(48.4%)
For population 25 years and over in 51573:
High school or higher: 98.4%
Bachelor's degree or higher: 32.3%
Graduate or professional degree: 6.3%
Mean travel time to work (commute): 18.2 minutes
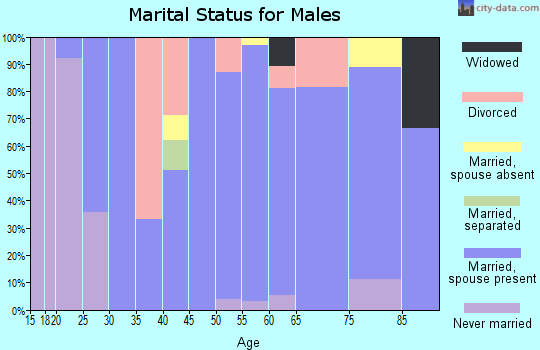
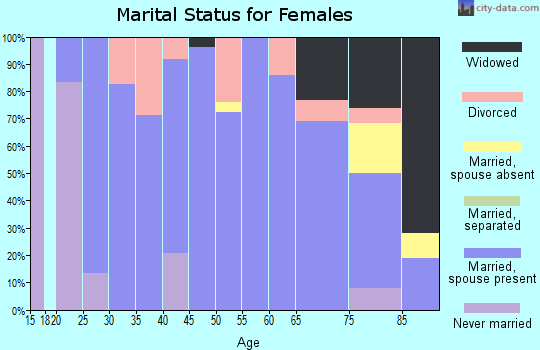
For population 15 years and over in 51573:
Never married: 15.0%
Now married: 68.1%
Separated: 1.3%
Widowed: 6.1%
Divorced: 9.4%
Zip code 51573 compared to state average:
Median house value below state average.
Unemployed percentage significantly below state average.
Black race population percentage significantly below state average.
Hispanic race population percentage significantly below state average.
Median age significantly above state average.
Foreign-born population percentage significantly below state average.
Renting percentage below state average.
Length of stay since moving in significantly above state average.
Estimated median house/condo value in 2022: $114,017
51573:
$114,017
Iowa:
$194,600
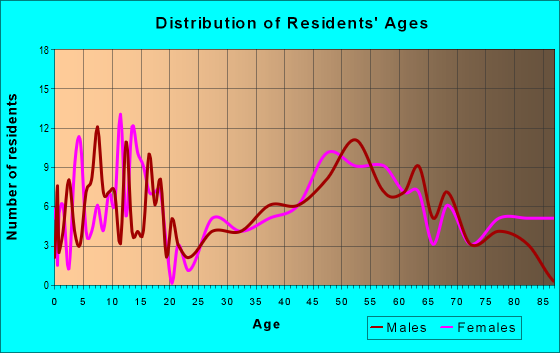
Median resident age:
This zip code:
47.9 years
Iowa median age:
38.9 years
Average household size:
This zip code:
2.5 people
Iowa:
2.3 people
Averages for the 2020 tax year for zip code 51573, filed in 2021:
Average Adjusted Gross Income (AGI) in 2020: $65,547 (Individual Income Tax Returns)
Here:
$65,547
State:
$71,087
Salary/wage: $48,288 (reported on 82.4% of returns)
Here:
$48,288
State:
$57,361
(% of AGI for various income ranges: 1318.9% for AGIs below $25k, 3907.5% for AGIs $25k-50k, 6108.3% for AGIs $50k-75k, 9645.0% for AGIs $75k-100k, 21112.5% for AGIs $100k-200k)
Taxable interest for individuals: $987 (reported on 29.4% of returns)
This zip code:
$987
Iowa:
$1,633
(% of AGI for various income ranges: 43.3% for AGIs below $25k, 61.3% for AGIs $25k-50k, 25.0% for AGIs $50k-75k, 47.5% for AGIs $75k-100k, 65.0% for AGIs $100k-200k)
Ordinary dividends: $2,029 (reported on 27.5% of returns)
Here:
$2,029
State:
$5,432
(% of AGI for various income ranges: 30.0% for AGIs below $25k, 56.2% for AGIs $25k-50k, 40.0% for AGIs $50k-75k, 125.0% for AGIs $75k-100k, 345.0% for AGIs $100k-200k)
Net capital gain/loss in AGI: +$5,178 (reported on 17.6% of returns)
Here:
+$5,178
State:
+$15,243
(% of AGI for various income ranges: 76.7% for AGIs below $25k, 206.7% for AGIs $50k-75k, 682.5% for AGIs $100k-200k)
Profit/loss from business: +$10,130 (reported on 19.6% of returns)
Here:
+$10,130
State:
+$11,763
(% of AGI for various income ranges: 130.0% for AGIs below $25k, 333.8% for AGIs $25k-50k, 870.0% for AGIs $50k-75k, 267.5% for AGIs $100k-200k)
Taxable individual retirement arrangement distribution: $11,550 (reported on 11.8% of returns)
51573:
$11,550
Iowa:
$17,324
(% of AGI for various income ranges: 465.0% for AGIs $25k-50k, 802.5% for AGIs $75k-100k)
Earned income credit: $2,417 (reported on 11.8% of returns)
Here:
$2,417
State:
$2,195
(% of AGI for various income ranges: 84.4% for AGIs below $25k, 86.2% for AGIs $25k-50k)
Percentage of individuals using paid preparers for their 2020 taxes: 98.0%
Here:
98%
State:
95%
(% for various income ranges: 100.0% for AGIs below $25k, 91.7% for AGIs $25k-50k, 100.0% for AGIs $50k-75k, 100.0% for AGIs $75k-100k, 100.0% for AGIs $100k-200k)
Averages for the 2012 tax year for zip code 51573, filed in 2013:
Average Adjusted Gross Income (AGI) in 2012: $58,625 (Individual Income Tax Returns)
Here:
$58,625
State:
$58,860
Salary/wage: $43,012 (reported on 83.3% of returns)
Here:
$43,012
State:
$46,659
(% of AGI for various income ranges: 70.3% for AGIs below $25k, 68.0% for AGIs $25k-50k, 79.1% for AGIs $50k-75k, 70.7% for AGIs $75k-100k, 41.5% for AGIs $100k-200k)
Taxable interest for individuals: $739 (reported on 37.5% of returns)
This zip code:
$739
Iowa:
$1,537
(% of AGI for various income ranges: 0.6% for AGIs below $25k, 0.9% for AGIs $25k-50k, 0.3% for AGIs $50k-75k, 0.5% for AGIs $75k-100k, 0.4% for AGIs $100k-200k)
Ordinary dividends: $846 (reported on 27.1% of returns)
Here:
$846
State:
$4,542
(% of AGI for various income ranges: 0.9% for AGIs $25k-50k, 0.2% for AGIs $50k-75k, 0.4% for AGIs $75k-100k, 0.3% for AGIs $100k-200k)
Net capital gain/loss in AGI: +$12,438 (reported on 16.7% of returns)
Here:
+$12,438
State:
+$11,802
(% of AGI for various income ranges: 1.1% for AGIs $75k-100k, 9.0% for AGIs $100k-200k)
Profit/loss from business: +$4,978 (reported on 18.8% of returns)
Here:
+$4,978
State:
+$10,509
(% of AGI for various income ranges: 3.8% for AGIs $25k-50k, 1.2% for AGIs $50k-75k, 3.4% for AGIs $75k-100k)
Taxable individual retirement arrangement distribution: $6,983 (reported on 12.5% of returns)
51573:
$6,983
Iowa:
$11,773
Total itemized deductions: $19,992 (19% of AGI, reported on 25.0% of returns)
Here:
$19,992
State:
$21,278
Here:
18.6% of AGI
State:
18.9% of AGI
(% of AGI for various income ranges: 20.0% for AGIs $25k-50k, 8.2% for AGIs $75k-100k, 9.9% for AGIs $100k-200k)
Charity contributions: $3,850 (reported on 20.8% of returns)
Here:
$3,850
State:
$4,044
(% of AGI for various income ranges: 1.3% for AGIs $25k-50k, 1.9% for AGIs $75k-100k, 2.0% for AGIs $100k-200k)
Taxes paid: $6,792 (reported on 25.0% of returns)
51573:
$6,792
State:
$8,846
(% of AGI for various income ranges: 3.7% for AGIs $25k-50k, 2.7% for AGIs $75k-100k, 4.7% for AGIs $100k-200k)
Earned income credit: $1,800 (reported on 10.4% of returns)
Here:
$1,800
State:
$2,098
(% of AGI for various income ranges: 3.4% for AGIs below $25k, 0.9% for AGIs $25k-50k)
Percentage of individuals using paid preparers for their 2012 taxes: 75.0%
Here:
75%
State:
65%
(% for various income ranges: 69.2% for AGIs below $25k, 75.0% for AGIs $25k-50k, 77.8% for AGIs $50k-75k, 75.0% for AGIs $75k-100k, 83.3% for AGIs $100k-200k)
Averages for the 2004 tax year for zip code 51573, filed in 2005:
Average Adjusted Gross Income (AGI) in 2004: $38,054 (Individual Income Tax Returns)
Here:
$38,054
State:
$43,875
Salary/wage: $34,935 (reported on 83.1% of returns)
Here:
$34,935
State:
$38,265
(% of AGI for various income ranges: 96.3% for AGIs below $10k, 60.4% for AGIs $10k-25k, 78.0% for AGIs $25k-50k, 84.2% for AGIs $50k-75k, 80.9% for AGIs $75k-100k, 59.5% for AGIs over 100k)
Taxable interest for individuals: $1,411 (reported on 54.8% of returns)
This zip code:
$1,411
Iowa:
$1,768
(% of AGI for various income ranges: 9.0% for AGIs below $10k, 4.2% for AGIs $10k-25k, 2.9% for AGIs $25k-50k, 0.4% for AGIs $50k-75k, 0.8% for AGIs $75k-100k, 2.9% for AGIs over 100k)
Taxable dividends: $913 (reported on 35.7% of returns)
Here:
$913
State:
$2,510
(% of AGI for various income ranges: 2.4% for AGIs below $10k, 1.7% for AGIs $10k-25k, 0.8% for AGIs $25k-50k, 0.4% for AGIs $50k-75k, 0.0% for AGIs $75k-100k, 2.0% for AGIs over 100k)
Net capital gain/loss: +$1,991 (reported on 22.7% of returns)
Here:
+$1,991
State:
+$6,139
(% of AGI for various income ranges: -2.9% for AGIs below $10k, 1.6% for AGIs $10k-25k, 1.0% for AGIs $25k-50k, 0.2% for AGIs $50k-75k, 2.4% for AGIs $75k-100k, 3.1% for AGIs over 100k)
Profit/loss from business: +$5,009 (reported on 21.4% of returns)
Here:
+$5,009
State:
+$8,574
(% of AGI for various income ranges: 8.8% for AGIs $10k-25k, 1.2% for AGIs $25k-50k, 3.9% for AGIs $50k-75k, 2.1% for AGIs $75k-100k)
IRA payment deduction: $2,923 (reported on 2.5% of returns)
51573:
$2,923
Iowa:
$2,970
Total itemized deductions: $14,792 (25% of AGI, reported on 20.6% of returns)
Here:
$14,792
State:
$16,976
Here:
24.5% of AGI
State:
20.8% of AGI
(% of AGI for various income ranges: 17.6% for AGIs $10k-25k, 6.6% for AGIs $25k-50k, 5.7% for AGIs $50k-75k, 8.5% for AGIs $75k-100k, 10.0% for AGIs over 100k)
Charity contributions deductions: $2,907 (5% of AGI, reported on 16.7% of returns)
Here:
$2,907
State:
$3,089
Here:
4.6% of AGI
State:
3.6% of AGI
(% of AGI for various income ranges: 2.0% for AGIs $10k-25k, 1.4% for AGIs $25k-50k, 0.9% for AGIs $50k-75k, 2.1% for AGIs $75k-100k, 1.0% for AGIs over 100k)
Total tax: $4,438 (reported on 75.0% of returns)
51573:
$4,438
State:
$6,177
(% of AGI for various income ranges: 1.9% for AGIs below $10k, 4.7% for AGIs $10k-25k, 6.3% for AGIs $25k-50k, 8.3% for AGIs $50k-75k, 9.2% for AGIs $75k-100k, 16.7% for AGIs over 100k)
Earned income credit: $1,302 (reported on 10.3% of returns)
Here:
$1,302
State:
$1,540
Percentage of individuals using paid preparers for their 2004 taxes: 77.3%
Here:
77%
State:
70%
(% for various income ranges: 62.4% for AGIs below $10k, 84.2% for AGIs $10k-25k, 82.2% for AGIs $25k-50k, 78.6% for AGIs $50k-75k, 76.7% for AGIs $75k-100k, 81.0% for AGIs over 100k)
Household received Food Stamps/SNAP in the past 12 months: 30 Household did not receive Food Stamps/SNAP in the past 12 months: 395
Women who had a birth in the past 12 months: 3 (3 now married, 0 unmarried) Women who did not have a birth in the past 12 months: 145 (105 now married, 40 unmarried)
Housing units in zip code 51573 with a mortgage: 200 (32 second mortgage, 33 both second mortgage and home equity loan) Houses without a mortgage: 11
Median monthly owner costs for units with a mortgage: $1,087 Median monthly owner costs for units without a mortgage: $500
Residents with income below the poverty level in 2022:
This zip code:
4.1%
Whole state:
11.0%
Residents with income below 50% of the poverty level in 2022:
This zip code:
2.6%
Whole state:
5.5%
Median number of rooms in houses and condos:
Here:
7.4
State:
6.8
Median number of rooms in apartments:
Here:
5.6
State:
4.2
Notable locations in this zip code not listed on our city pages
Notable locations in zip code 51573: United Farmers Mercantile Coop Elevator (A), Stanton (B), Stanton Fire Department (C), Stanton Community Library (D), Swedish Heritage and Cultural Center (E). Display/hide their locations on the map
Churches in zip code 51573 include: Tabor Church (A), Evangelical Covenant Church (B), Mamrelund Lutheran Church (C). Display/hide their locations on the map
Cemeteries: Arlington Cemetery (1), Mamrelund Cemetery (2), Tabor Cemetery (3), Mamre Cemetery (4), Mission Cemetery (5). Display/hide their locations on the map
In group quarters: 37 (-1 institutionalized population)
Size of family households: 190 2-persons, 50 3-persons, 45 4-persons, 23 5-persons, 18 6-persons, 4 7-or-more-persons
Size of nonfamily households: 81 1-person, 11 2-persons
223 married couples with children.
35 single-parent households (19 men, 16 women).
98.4% of residents of 51573 zip code speak English at home.
1.5% of residents speak Spanish at home (40% very well, 47% well, 13% not well).
Foreign born population: 16 (1.5%) (67.4% of them are naturalized citizens)
This zip code:
1.5%
Whole state:
6.0%
53%Guatemala
33%Swedish
26%German
7%American
6%English
4%Irish
3%Italian
2%European
Year of entry for the foreign-born population
02010 or later
12000 to 2009
21990 to 1999
15Before 1990
Facilities with environmental interests located in this zip code:
STANTON CITY OF (513 BROAD AVE in STANTON, IA)
(Integrated Compliance Information System) - ICIS-07-1991-0164, FORMAL ENFORCEMENT ACTION COMPLIANCE ACTIVITY (Tracking inspections of insecticide, fungicide, and rodenticide, and toxic substances) Business SIC classification: ELECTRIC SERVICES Alternative names: STANTON ELEC DIST SYSTEM, STANTON ELEC DISTRIBUTION SYSTEM
STANTON COM SCH DIST (605 ELLIOTT in STANTON, IA)
(Integrated Compliance Information System) - ICIS-07-1986-0187, FORMAL ENFORCEMENT ACTION COMPLIANCE ACTIVITY (Tracking inspections of insecticide, fungicide, and rodenticide, and toxic substances) Business SIC classification: ELEMENTARY AND SECONDARY SCHOOLS Alternative names: STANTON C S D, STANTON COMM $, STANTON COMM SCHOOL DIST
STANTON ELEMENTARY SCHOOL (605 ELLIOTT STREET in STANTON, IA)
(National Center for Education Statistics) - STATE ID-696165 409 Organizations: STANTON COMM SCHOOL DISTRICT (SCHOOL DISTRICT)
STANTON HIGH SCHOOL (605 ELLIOTT STREE in STANTON, IA)
(National Center for Education Statistics) - STATE ID-696165 109 Organizations: STANTON COMM SCHOOL DISTRICT (SCHOOL DISTRICT)
STANTON CITY OF STP (INTERSECTION OF HARVARD AND EL in STANTON, IA)
National Pollutant Discharge Elimination System NON-MAJOR (Tracking pollutant discharge elimination systems) - permit Business SIC classification: SEWERAGE SYSTEMS Organizations: CITY OF STANTON (CONTACT/OWNER)
STANTON ELEMENTARY (412 HILLTOP AVE in STANTON, IA)
(Resource Conservation and Recovery Act (tracking hazardous waste)) Organizations: SCHOOL DISTRICT (CONTACT/OWNER)
UNITED FARMERS MERCHANTILE COOP (408 JAMES STREET in STANTON, IA)
COMPLIANCE ACTIVITY (Tracking inspections of insecticide, fungicide, and rodenticide, and toxic substances) Alternative names: UNITED FARMERS MERCANTILE COOP
STANTON CITY OF (415 BROAD AVENUE in STANTON, IA)
COMPLIANCE ACTIVITY (Tracking inspections of insecticide, fungicide, and rodenticide, and toxic substances) Business SIC classification: ELECTRIC SERVICES
Housing units lacking complete plumbing facilities: 4.2% Housing units lacking complete kitchen facilities: 1.5%
41.4%Utility gas
29.2%Electricity
26.5%Bottled, tank, or LP gas
2.2%Fuel oil, kerosene, etc.
1.0%No fuel used
Population in 1990: 1,315.
Place of birth for U.S.-born residents:
This state: 662
Northeast: 6
Midwest: 356
South: 31
West: 16
68% of the 51573 zip code residents lived in the same house 5 years ago. Out of people who lived in different houses, 47% lived in this county. Out of people who lived in different counties, 50% lived in Iowa.
96% of the 51573 zip code residents lived in the same house 1 year ago. Out of people who lived in different houses, 56% moved from this county. Out of people who lived in different houses, 47% moved from different county within same state.
Private vs. public school enrollment:
Students in private schools in grades 1 to 8 (elementary and middle school):
Here:
0.0%
Iowa:
10.6%
Students in private schools in grades 9 to 12 (high school):
Here:
0.0%
Iowa:
7.9%
Students in private undergraduate colleges:
Here:
0.0%
Iowa:
23.9%
Occupation by median earnings in the past 12 months ($)
103,119Transportation occupations
76,299Healthcare support occupations
63,607Construction and extraction occupations
63,330Installation, maintenance, and repair occupations
55,995Management occupations
46,640Education, training, and library occupations
Top industries in this zip code by the number of employees in 2005:
Health Care and Social Assistance: Nursing Care Facilities (50-99 employees: 1 establishment)


 Nearest zip codes: 50864, 51566, 51532, 50847, 50857, 51638.