Estimated zip code population in 2022: 1,271 Zip code population in 2010: 1,152 Zip code population in 2000: 997
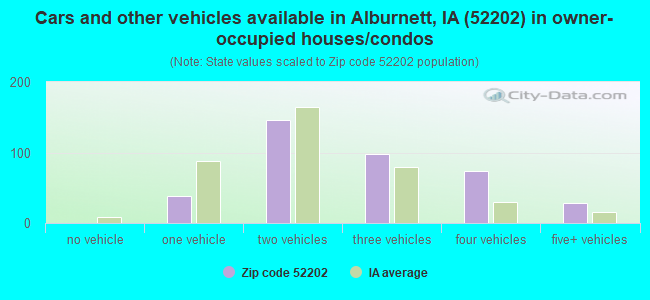
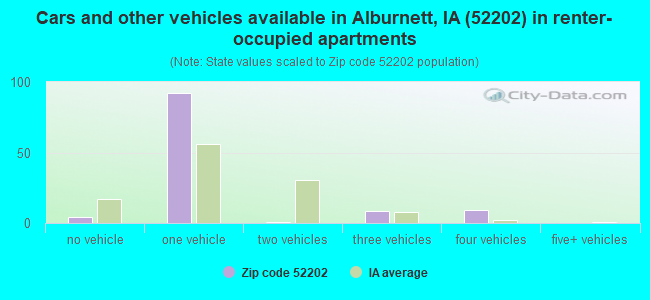
Houses and condos: 515 Renter-occupied apartments: 114
% of renters here:
23%
State:
28%
March 2022 cost of living index in zip code 52202: 82.5 (low, U.S. average is 100)
Land area: 25.2 sq. mi. Water area: 0.0 sq. mi.
Population density: 50 people per square mile
(very low).
OSM Map
General Map
Google Map
MSN Map
OSM Map
General Map
Google Map
MSN Map
OSM Map
General Map
Google Map
MSN Map
OSM Map
General Map
Google Map
MSN Map
Please wait while loading the map...
Real estate property taxes paid for housing units in 2022:
This zip code:
1.2% ($2,872)
Iowa:
1.4% ($2,724)
Median real estate property taxes paid for housing units with mortgages in 2022: $2,923 (1.1%) Median real estate property taxes paid for housing units with no mortgage in 2022: $2,784 (1.4%)
Business Search- 14 Million verified businesses
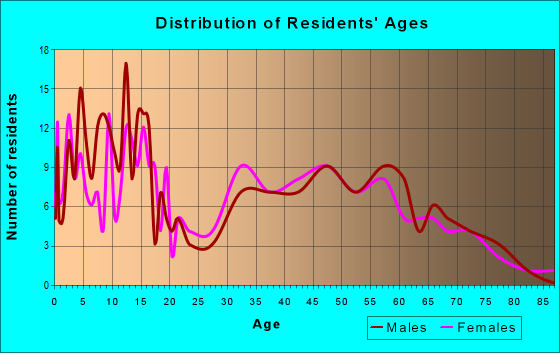
Males: 624
(49.1%)
Females: 647
(50.9%)
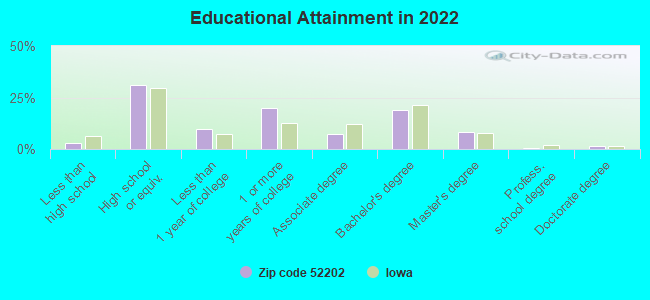
For population 25 years and over in 52202:
High school or higher: 97.1%
Bachelor's degree or higher: 29.1%
Graduate or professional degree: 10.3%
Unemployed: 2.1%
Mean travel time to work (commute): 21.2 minutes
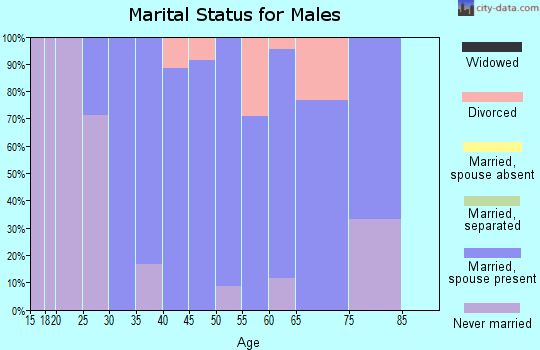
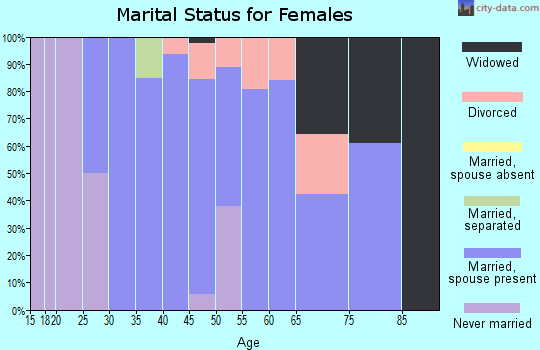
For population 15 years and over in 52202:
Never married: 24.4%
Now married: 64.7%
Separated: 0.6%
Widowed: 3.1%
Divorced: 7.1%
Zip code 52202 compared to state average:
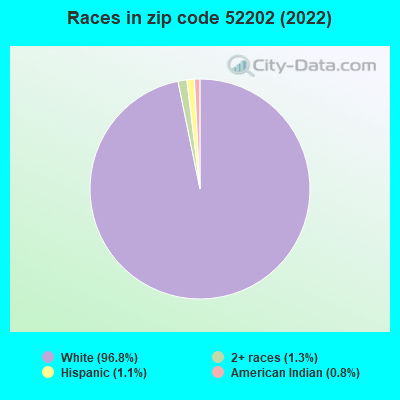
Black race population percentage significantly below state average.
Hispanic race population percentage significantly below state average.
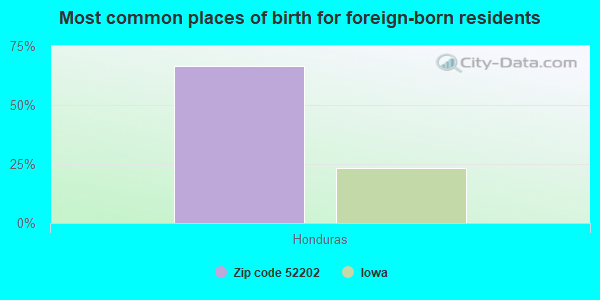
Foreign-born population percentage significantly below state average.
Length of stay since moving in significantly above state average.
Averages for the 2020 tax year for zip code 52202, filed in 2021:
Average Adjusted Gross Income (AGI) in 2020: $75,142 (Individual Income Tax Returns)
Here:
$75,142
State:
$71,087
Salary/wage: $64,180 (reported on 83.0% of returns)
Here:
$64,180
State:
$57,361
(% of AGI for various income ranges: 1250.0% for AGIs below $25k, 3693.8% for AGIs $25k-50k, 7534.0% for AGIs $50k-75k, 9562.0% for AGIs $75k-100k, 19670.0% for AGIs $100k-200k)
Taxable interest for individuals: $1,158 (reported on 45.3% of returns)
This zip code:
$1,158
Iowa:
$1,633
(% of AGI for various income ranges: 16.2% for AGIs below $25k, 35.0% for AGIs $25k-50k, 72.0% for AGIs $50k-75k, 62.0% for AGIs $75k-100k, 212.5% for AGIs $100k-200k)
Ordinary dividends: $2,458 (reported on 22.6% of returns)
Here:
$2,458
State:
$5,432
(% of AGI for various income ranges: 38.8% for AGIs below $25k, 122.0% for AGIs $50k-75k, 72.0% for AGIs $75k-100k, 208.8% for AGIs $100k-200k)
Net capital gain/loss in AGI: +$7,682 (reported on 20.8% of returns)
Here:
+$7,682
State:
+$15,243
(% of AGI for various income ranges: 33.8% for AGIs below $25k, 312.0% for AGIs $50k-75k, 827.5% for AGIs $100k-200k)
Profit/loss from business: +$15,712 (reported on 15.1% of returns)
Here:
+$15,712
State:
+$11,763
(% of AGI for various income ranges: 343.8% for AGIs below $25k, 742.0% for AGIs $50k-75k, 763.8% for AGIs $100k-200k)
Taxable individual retirement arrangement distribution: $18,067 (reported on 11.3% of returns)
52202:
$18,067
Iowa:
$17,324
(% of AGI for various income ranges: 822.0% for AGIs $50k-75k, 841.2% for AGIs $100k-200k)
Total itemized deductions: $31,060 (reported on 9.4% of returns)
Here:
$31,060
State:
$33,775
(% of AGI for various income ranges: 3106.0% for AGIs $75k-100k)
Charity contributions: $3,850 (reported on 3.8% of returns)
Here:
$3,850
State:
$13,075
(% of AGI for various income ranges: 96.2% for AGIs $25k-50k)
Taxes paid: $6,633 (reported on 5.7% of returns)
52202:
$6,633
State:
$7,704
(% of AGI for various income ranges: 398.0% for AGIs $50k-75k)
Earned income credit: $2,025 (reported on 7.5% of returns)
Here:
$2,025
State:
$2,195
(% of AGI for various income ranges: 101.2% for AGIs $25k-50k)
Percentage of individuals using paid preparers for their 2020 taxes: 94.3%
Here:
94%
State:
95%
(% for various income ranges: 100.0% for AGIs below $25k, 90.9% for AGIs $25k-50k, 88.9% for AGIs $50k-75k, 100.0% for AGIs $75k-100k, 93.3% for AGIs $100k-200k)
Averages for the 2012 tax year for zip code 52202, filed in 2013:
Average Adjusted Gross Income (AGI) in 2012: $58,638 (Individual Income Tax Returns)
Here:
$58,638
State:
$58,860
Salary/wage: $51,088 (reported on 81.1% of returns)
Here:
$51,088
State:
$46,659
(% of AGI for various income ranges: 78.0% for AGIs below $25k, 75.7% for AGIs $25k-50k, 76.0% for AGIs $50k-75k, 77.6% for AGIs $75k-100k, 63.2% for AGIs $100k-200k)
Taxable interest for individuals: $1,172 (reported on 47.2% of returns)
This zip code:
$1,172
Iowa:
$1,537
(% of AGI for various income ranges: 1.6% for AGIs below $25k, 1.2% for AGIs $25k-50k, 0.7% for AGIs $50k-75k, 0.5% for AGIs $75k-100k, 1.0% for AGIs $100k-200k)
Ordinary dividends: $2,064 (reported on 20.8% of returns)
Here:
$2,064
State:
$4,542
(% of AGI for various income ranges: 5.3% for AGIs below $25k, 0.7% for AGIs $50k-75k, 0.7% for AGIs $100k-200k)
Net capital gain/loss in AGI: +$2,156 (reported on 17.0% of returns)
Here:
+$2,156
State:
+$11,802
(% of AGI for various income ranges: 1.4% for AGIs $75k-100k, 0.9% for AGIs $100k-200k)
Profit/loss from business: +$5,875 (reported on 15.1% of returns)
Here:
+$5,875
State:
+$10,509
(% of AGI for various income ranges: 6.4% for AGIs below $25k, 5.3% for AGIs $25k-50k, 2.0% for AGIs $75k-100k)
Taxable individual retirement arrangement distribution: $7,920 (reported on 9.4% of returns)
52202:
$7,920
Iowa:
$11,773
Total itemized deductions: $18,733 (19% of AGI, reported on 34.0% of returns)
Here:
$18,733
State:
$21,278
Here:
19.0% of AGI
State:
18.9% of AGI
(% of AGI for various income ranges: 14.2% for AGIs $25k-50k, 10.4% for AGIs $50k-75k, 11.7% for AGIs $75k-100k, 10.9% for AGIs $100k-200k)
Charity contributions: $2,714 (reported on 26.4% of returns)
Here:
$2,714
State:
$4,044
(% of AGI for various income ranges: 0.8% for AGIs $25k-50k, 0.9% for AGIs $50k-75k, 1.6% for AGIs $75k-100k, 1.4% for AGIs $100k-200k)
Taxes paid: $7,417 (reported on 34.0% of returns)
52202:
$7,417
State:
$8,846
(% of AGI for various income ranges: 3.5% for AGIs $25k-50k, 3.3% for AGIs $50k-75k, 5.2% for AGIs $75k-100k, 5.1% for AGIs $100k-200k)
Earned income credit: $1,729 (reported on 13.2% of returns)
Here:
$1,729
State:
$2,098
(% of AGI for various income ranges: 4.8% for AGIs below $25k, 0.8% for AGIs $25k-50k)
Percentage of individuals using paid preparers for their 2012 taxes: 62.3%
Here:
62%
State:
65%
(% for various income ranges: 56.2% for AGIs below $25k, 61.5% for AGIs $25k-50k, 62.5% for AGIs $50k-75k, 71.4% for AGIs $75k-100k, 66.7% for AGIs $100k-200k)
Averages for the 2004 tax year for zip code 52202, filed in 2005:
Average Adjusted Gross Income (AGI) in 2004: $45,182 (Individual Income Tax Returns)
Here:
$45,182
State:
$43,875
Salary/wage: $41,147 (reported on 85.7% of returns)
Here:
$41,147
State:
$38,265
(% of AGI for various income ranges: 92.5% for AGIs below $10k, 68.9% for AGIs $10k-25k, 82.9% for AGIs $25k-50k, 82.0% for AGIs $50k-75k, 84.3% for AGIs $75k-100k, 66.7% for AGIs over 100k)
Taxable interest for individuals: $1,340 (reported on 54.9% of returns)
This zip code:
$1,340
Iowa:
$1,768
(% of AGI for various income ranges: 4.2% for AGIs below $10k, 2.9% for AGIs $10k-25k, 0.8% for AGIs $25k-50k, 1.1% for AGIs $50k-75k, 1.3% for AGIs $75k-100k, 2.7% for AGIs over 100k)
Taxable dividends: $903 (reported on 26.9% of returns)
Here:
$903
State:
$2,510
(% of AGI for various income ranges: 1.5% for AGIs $10k-25k, 0.5% for AGIs $25k-50k, 0.2% for AGIs $50k-75k, 1.0% for AGIs $75k-100k, 0.5% for AGIs over 100k)
Net capital gain/loss: +$2,829 (reported on 16.5% of returns)
Here:
+$2,829
State:
+$6,139
(% of AGI for various income ranges: 0.5% for AGIs $10k-25k, -0.3% for AGIs $25k-50k, 0.1% for AGIs $50k-75k, -0.1% for AGIs $75k-100k, 4.4% for AGIs over 100k)
Profit/loss from business: +$6,149 (reported on 14.5% of returns)
Here:
+$6,149
State:
+$8,574
Total itemized deductions: $14,007 (19% of AGI, reported on 32.3% of returns)
Here:
$14,007
State:
$16,976
Here:
19.2% of AGI
State:
20.8% of AGI
(% of AGI for various income ranges: 10.4% for AGIs $10k-25k, 8.0% for AGIs $25k-50k, 10.2% for AGIs $50k-75k, 9.9% for AGIs $75k-100k, 12.4% for AGIs over 100k)
Charity contributions deductions: $2,163 (3% of AGI, reported on 28.0% of returns)
Here:
$2,163
State:
$3,089
Here:
2.8% of AGI
State:
3.6% of AGI
(% of AGI for various income ranges: 0.6% for AGIs $10k-25k, 0.8% for AGIs $25k-50k, 1.4% for AGIs $50k-75k, 1.4% for AGIs $75k-100k, 2.1% for AGIs over 100k)
Total tax: $5,289 (reported on 82.4% of returns)
52202:
$5,289
State:
$6,177
(% of AGI for various income ranges: 2.4% for AGIs below $10k, 5.1% for AGIs $10k-25k, 6.5% for AGIs $25k-50k, 7.7% for AGIs $50k-75k, 10.1% for AGIs $75k-100k, 16.6% for AGIs over 100k)
Earned income credit: $1,543 (reported on 7.6% of returns)
Here:
$1,543
State:
$1,540
Percentage of individuals using paid preparers for their 2004 taxes: 68.3%
Here:
68%
State:
70%
(% for various income ranges: 51.4% for AGIs below $10k, 62.5% for AGIs $10k-25k, 74.5% for AGIs $25k-50k, 78.3% for AGIs $50k-75k, 65.7% for AGIs $75k-100k, 71.4% for AGIs over 100k)
Household received Food Stamps/SNAP in the past 12 months: 30 Household did not receive Food Stamps/SNAP in the past 12 months: 470
Women who had a birth in the past 12 months: 34 (35 now married, 0 unmarried) Women who did not have a birth in the past 12 months: 270 (134 now married, 136 unmarried)
Housing units in zip code 52202 with a mortgage: 260 (43 second mortgage, 1 home equity loan, 26 both second mortgage and home equity loan) Houses without a mortgage: 21
Median monthly owner costs for units with a mortgage: $1,617 Median monthly owner costs for units without a mortgage: $676
Residents with income below the poverty level in 2022:
This zip code:
4.6%
Whole state:
11.0%
Residents with income below 50% of the poverty level in 2022:
This zip code:
1.2%
Whole state:
5.5%
Median number of rooms in houses and condos:
Here:
6.5
State:
6.8
Median number of rooms in apartments:
Here:
4.1
State:
4.2
Notable locations in this zip code not listed on our city pages
Notable locations in zip code 52202: Alburnett (A), Alburnett City Hall (B), Alburnett - Otter Creek Fire Department (C). Display/hide their locations on the map
Churches in zip code 52202 include: Prairie Chapel Methodist Church (A), Alburnett United Methodist Church (B), Christian Church (C), Salem Church (D). Display/hide their locations on the map
Size of family households: 186 2-persons, 51 3-persons, 100 4-persons, 6 5-persons, 12 6-persons, 5 7-or-more-persons
Size of nonfamily households: 113 1-person, 13 2-persons, 6 3-persons
272 married couples with children.
50 single-parent households (5 men, 45 women).
99.4% of residents of 52202 zip code speak English at home.
0.3% of residents speak Spanish at home (100% not well).
Foreign born population: 3 (0.2%) (0.0% of them are naturalized citizens)
:
0.2%
Whole state:
6.0%
67%Honduras
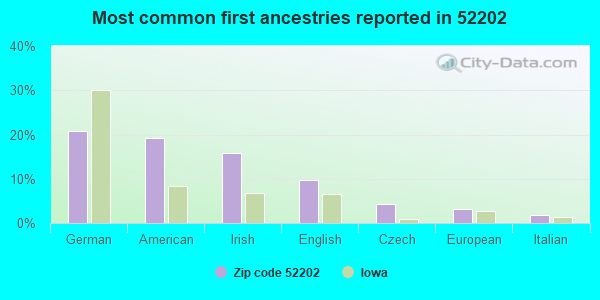
21%German
19%American
16%Irish
10%English
4%Czech
3%European
2%Italian
Year of entry for the foreign-born population
32010 or later
02000 to 2009
01990 to 1999
3Before 1990
Facilities with environmental interests located in this zip code:
ALBURNETT JUNIOR-SENIOR HIGH SCHOOL (131 ROOSEVELT STREET in ALBURNETT, IA)
COMPLIANCE ACTIVITY (Tracking inspections of insecticide, fungicide, and rodenticide, and toxic substances) (National Center for Education Statistics) - STATE ID-570099 172 (Resource Conservation and Recovery Act (tracking hazardous waste)) Organizations: ALBURNETT COMM SCHOOL DISTRICT (SCHOOL DISTRICT)
Alternative names: ALBURNETT C S D, ALBURNETT COMM SCHOOL DIST, ALBURNETT HIGH SCHOOL
ALBURNETT ELEMENTARY SCHOOL (131 ROOSEVELT STREET in ALBURNETT, IA)
(National Center for Education Statistics) - STATE ID-570099 409 Organizations: ALBURNETT COMM SCHOOL DISTRICT (SCHOOL DISTRICT)
ALBURNETT CITY OF STP (CITY CLERK in ALBURNETT, IA)
National Pollutant Discharge Elimination System NON-MAJOR (Tracking pollutant discharge elimination systems) - permit Business SIC classification: SEWERAGE SYSTEMS Organizations: CITY OF ALBURNETT (CONTACT/OWNER)
ALBURNETT VETERINARY SERVICE (412 SOUTH MAIN AVENUE in ALBURNETT, IA)
AIR MINOR (AIRS/AFS)
DAVES SERVICE (121 SOUTH MAIN AVENUE in ALBURNETT, IA)
AIR MINOR (AIRS/AFS) Business SIC classification: NONCLASSIFIABLE ESTABLISHMENTS
NEW HORIZON FS INCORPORATED (2686 OLD QUAAS RD in ALBURNETT, IA)
(Resource Conservation and Recovery Act (tracking hazardous waste)) Business NAICS classification: FARM MANAGEMENT SERVICES.; FERTILIZER (MIXING ONLY) MANUFACTURING. Alternative names: LINN JONES FS INC
D & D AUTO (322 SOUTH MAIN AVENUE in ALBURNETT, IA)
AIR SYNTHETIC MINOR (AIRS/AFS) Business SIC classification: NONCLASSIFIABLE ESTABLISHMENTS Alternative names: D&D AUTO SALES
PAINT BOOTH, THE (115 1ST ST. in ALBURNETT, IA)
AIR SYNTHETIC MINOR (AIRS/AFS) Business SIC classification: TOP, BODY, AND UPHOLSTERY REPAIR SHOPS AND PAINT SHOPS
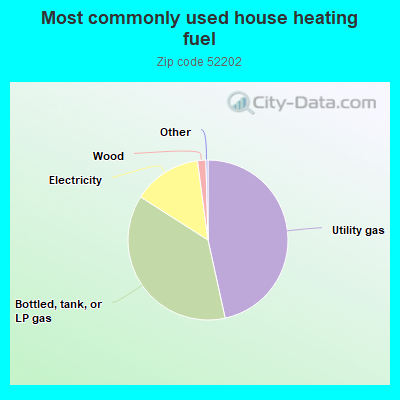
46.7%Utility gas
37.6%Bottled, tank, or LP gas
13.9%Electricity
1.7%Wood
Population in 1990: 1,038.
Place of birth for U.S.-born residents:
This state: 1,122
Northeast: 3
Midwest: 99
South: 21
West: 17
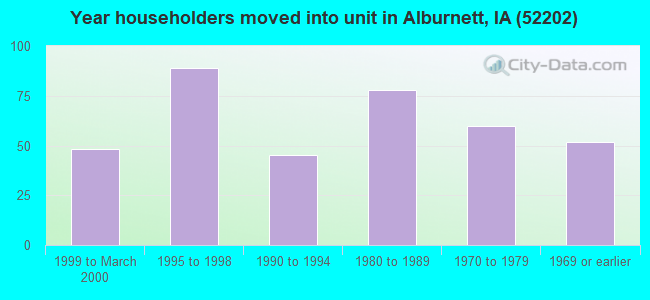
67% of the 52202 zip code residents lived in the same house 5 years ago. Out of people who lived in different houses, 82% lived in this county. Out of people who lived in different counties, 50% lived in Iowa.
96% of the 52202 zip code residents lived in the same house 1 year ago. Out of people who lived in different houses, 89% moved from this county. Out of people who lived in different houses, 14% moved from different county within same state.
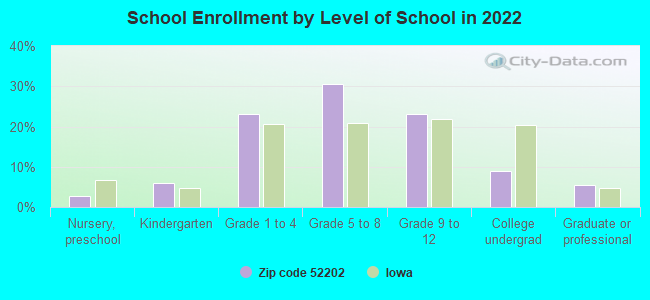
Private vs. public school enrollment:
Students in private schools in grades 1 to 8 (elementary and middle school): 12
Here:
8.3%
Iowa:
10.6%
Students in private schools in grades 9 to 12 (high school):
Here:
0.0%
Iowa:
7.9%
Students in private undergraduate colleges: 7
Here:
29.0%
Iowa:
23.9%
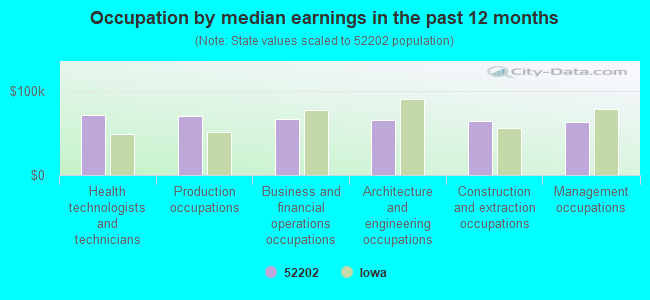
Occupation by median earnings in the past 12 months ($)
70,872Health technologists and technicians
70,592Production occupations
66,614Business and financial operations occupations
65,110Architecture and engineering occupations
64,237Construction and extraction occupations
63,170Management occupations
Top industries in this zip code by the number of employees in 2005:
Finance and Insurance: Insurance Agencies and Brokerages (10-19 employees: 1 establishment)
Other Services (except Public Administration): Labor Unions and Similar Labor Organizations (10-19: 1)
Wholesale Trade: Grain and Field Bean Merchant Wholesalers (5-9: 1)
Accommodation and Food Services: Full-Service Restaurants (5-9: 1)
Construction: Plumbing, Heating, and Air-Conditioning Contractors (5-9: 1)
Professional, Scientific, and Technical Services: Veterinary Services (5-9: 1)
Other Services (except Public Administration): Religious Organizations (1-4: 2)
Other Services (except Public Administration): General Automotive Repair (1-4: 1)
Fatal accident statistics in 2010:
Fatal accident count: 1
Vehicles involved in fatal accidents: 1
Fatal accidents caused by drunken drivers: 0
Fatalities: 1
Persons involved in fatal accidents: 2
Pedestrians involved in fatal accidents: 0
Home Mortgage Disclosure Act Aggregated Statistics For Year 2009 (Based on 2 partial tracts)
A) FHA, FSA/RHS & VA Home Purchase Loans
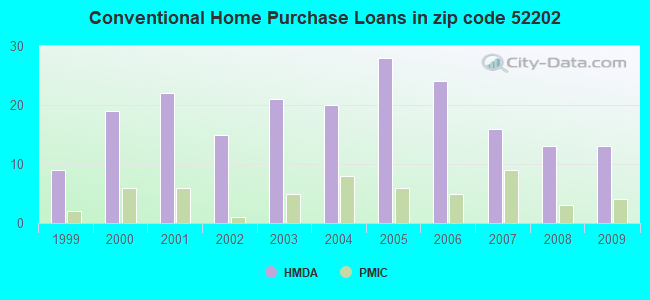
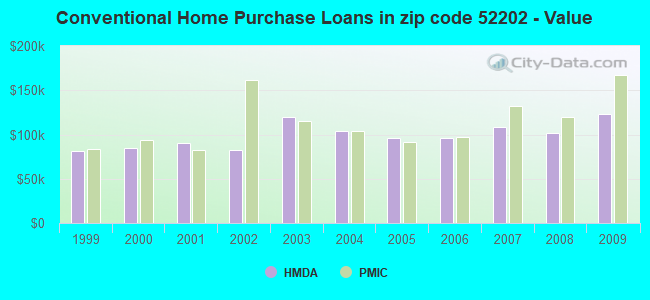
B) Conventional Home Purchase Loans
C) Refinancings
D) Home Improvement Loans
F) Non-occupant Loans on < 5 Family Dwellings (A B C & D)
Number
Average Value
Number
Average Value
Number
Average Value
Number
Average Value
Number
Average Value
LOANS ORIGINATED
6
$120,413
13
$122,985
43
$126,513
9
$30,820
5
$61,976
APPLICATIONS APPROVED, NOT ACCEPTED
1
$61,540
0
$0
3
$145,043
0
$0
0
$0
APPLICATIONS DENIED
0
$0
0
$0
13
$114,018
1
$31,640
0
$0
APPLICATIONS WITHDRAWN
1
$161,660
0
$0
9
$128,046
1
$74,980
0
$0
FILES CLOSED FOR INCOMPLETENESS
1
$83,650
1
$98,380
3
$125,973
0
$0
0
$0
Aggregated Statistics For Year 2008 (Based on 2 partial tracts)
A) FHA, FSA/RHS & VA Home Purchase Loans
B) Conventional Home Purchase Loans
C) Refinancings
D) Home Improvement Loans
F) Non-occupant Loans on < 5 Family Dwellings (A B C & D)
Number
Average Value
Number
Average Value
Number
Average Value
Number
Average Value
Number
Average Value
LOANS ORIGINATED
3
$127,853
13
$101,882
29
$147,744
4
$25,355
3
$48,253
APPLICATIONS APPROVED, NOT ACCEPTED
0
$0
1
$149,960
4
$125,360
0
$0
0
$0
APPLICATIONS DENIED
0
$0
2
$62,195
9
$150,004
4
$39,872
1
$18,200
APPLICATIONS WITHDRAWN
0
$0
1
$113,980
4
$130,562
1
$87,110
0
$0
FILES CLOSED FOR INCOMPLETENESS
0
$0
0
$0
1
$269,140
0
$0
0
$0
Aggregated Statistics For Year 2007 (Based on 2 partial tracts)
A) FHA, FSA/RHS & VA Home Purchase Loans
B) Conventional Home Purchase Loans
C) Refinancings
D) Home Improvement Loans
F) Non-occupant Loans on < 5 Family Dwellings (A B C & D)
G) Loans On Manufactured Home Dwelling (A B C & D)
Number
Average Value
Number
Average Value
Number
Average Value
Number
Average Value
Number
Average Value
Number
Average Value
LOANS ORIGINATED
2
$101,415
16
$108,161
30
$125,585
9
$36,453
4
$77,470
1
$70,640
APPLICATIONS APPROVED, NOT ACCEPTED
0
$0
1
$133,920
6
$153,207
1
$81,480
0
$0
0
$0
APPLICATIONS DENIED
0
$0
7
$76,960
18
$88,462
5
$33,026
1
$92,310
0
$0
APPLICATIONS WITHDRAWN
0
$0
1
$124,820
7
$135,283
0
$0
1
$103,150
0
$0
FILES CLOSED FOR INCOMPLETENESS
0
$0
1
$82,350
2
$167,940
0
$0
0
$0
0
$0
Aggregated Statistics For Year 2006 (Based on 2 partial tracts)
A) FHA, FSA/RHS & VA Home Purchase Loans
B) Conventional Home Purchase Loans
C) Refinancings
D) Home Improvement Loans
F) Non-occupant Loans on < 5 Family Dwellings (A B C & D)
G) Loans On Manufactured Home Dwelling (A B C & D)
Number
Average Value
Number
Average Value
Number
Average Value
Number
Average Value
Number
Average Value
Number
Average Value
LOANS ORIGINATED
3
$95,060
24
$96,486
38
$88,357
11
$27,619
3
$58,943
1
$65,010
APPLICATIONS APPROVED, NOT ACCEPTED
0
$0
2
$82,565
6
$73,388
2
$38,790
0
$0
1
$11,700
APPLICATIONS DENIED
0
$0
3
$100,837
15
$94,308
5
$32,244
1
$45,070
2
$40,740
APPLICATIONS WITHDRAWN
0
$0
3
$95,637
10
$113,074
1
$62,840
0
$0
0
$0
FILES CLOSED FOR INCOMPLETENESS
0
$0
0
$0
2
$136,955
1
$31,200
0
$0
0
$0
Aggregated Statistics For Year 2005 (Based on 2 partial tracts)
B) Conventional Home Purchase Loans
C) Refinancings
D) Home Improvement Loans
F) Non-occupant Loans on < 5 Family Dwellings (A B C & D)
G) Loans On Manufactured Home Dwelling (A B C & D)
Number
Average Value
Number
Average Value
Number
Average Value
Number
Average Value
Number
Average Value
LOANS ORIGINATED
28
$95,720
35
$101,985
12
$19,575
4
$48,975
1
$68,910
APPLICATIONS APPROVED, NOT ACCEPTED
2
$81,045
4
$98,165
0
$0
0
$0
0
$0
APPLICATIONS DENIED
3
$48,830
13
$87,113
2
$77,360
0
$0
0
$0
APPLICATIONS WITHDRAWN
4
$107,482
11
$93,181
1
$20,800
0
$0
0
$0
FILES CLOSED FOR INCOMPLETENESS
2
$71,080
7
$103,334
0
$0
0
$0
0
$0
Aggregated Statistics For Year 2004 (Based on 2 partial tracts)
A) FHA, FSA/RHS & VA Home Purchase Loans
B) Conventional Home Purchase Loans
C) Refinancings
D) Home Improvement Loans
F) Non-occupant Loans on < 5 Family Dwellings (A B C & D)
Number
Average Value
Number
Average Value
Number
Average Value
Number
Average Value
Number
Average Value
LOANS ORIGINATED
1
$106,180
20
$103,474
44
$87,261
10
$20,760
4
$69,995
APPLICATIONS APPROVED, NOT ACCEPTED
1
$71,510
4
$93,290
6
$89,353
1
$99,680
0
$0
APPLICATIONS DENIED
0
$0
1
$125,690
14
$106,307
2
$52,660
0
$0
APPLICATIONS WITHDRAWN
0
$0
3
$86,823
6
$124,892
2
$70,645
0
$0
FILES CLOSED FOR INCOMPLETENESS
0
$0
1
$161,220
5
$100,288
0
$0
0
$0
Aggregated Statistics For Year 2003 (Based on 2 partial tracts)
A) FHA, FSA/RHS & VA Home Purchase Loans
B) Conventional Home Purchase Loans
C) Refinancings
D) Home Improvement Loans
F) Non-occupant Loans on < 5 Family Dwellings (A B C & D)
Number
Average Value
Number
Average Value
Number
Average Value
Number
Average Value
Number
Average Value
LOANS ORIGINATED
2
$85,815
21
$120,114
72
$99,688
13
$25,704
4
$175,635
APPLICATIONS APPROVED, NOT ACCEPTED
0
$0
2
$113,335
8
$120,106
0
$0
0
$0
APPLICATIONS DENIED
0
$0
5
$104,362
16
$89,903
1
$33,810
0
$0
APPLICATIONS WITHDRAWN
1
$119,190
4
$136,412
10
$86,160
0
$0
0
$0
FILES CLOSED FOR INCOMPLETENESS
0
$0
1
$155,590
1
$148,660
0
$0
0
$0
Aggregated Statistics For Year 2002 (Based on 2 partial tracts)
A) FHA, FSA/RHS & VA Home Purchase Loans
B) Conventional Home Purchase Loans
C) Refinancings
D) Home Improvement Loans
F) Non-occupant Loans on < 5 Family Dwellings (A B C & D)
Number
Average Value
Number
Average Value
Number
Average Value
Number
Average Value
Number
Average Value
LOANS ORIGINATED
1
$92,310
15
$82,086
48
$98,246
13
$23,970
2
$57,860
APPLICATIONS APPROVED, NOT ACCEPTED
0
$0
1
$43,340
7
$91,881
0
$0
0
$0
APPLICATIONS DENIED
0
$0
6
$55,547
11
$78,366
2
$78,445
1
$32,510
APPLICATIONS WITHDRAWN
0
$0
1
$104,020
10
$113,507
1
$189,830
1
$55,910
FILES CLOSED FOR INCOMPLETENESS
0
$0
0
$0
4
$99,465
0
$0
0
$0
Aggregated Statistics For Year 2001 (Based on 2 partial tracts)
A) FHA, FSA/RHS & VA Home Purchase Loans
B) Conventional Home Purchase Loans
C) Refinancings
D) Home Improvement Loans
F) Non-occupant Loans on < 5 Family Dwellings (A B C & D)
Number
Average Value
Number
Average Value
Number
Average Value
Number
Average Value
Number
Average Value
LOANS ORIGINATED
3
$122,653
22
$90,384
49
$88,997
9
$18,251
3
$69,490
APPLICATIONS APPROVED, NOT ACCEPTED
0
$0
1
$52,440
4
$82,780
0
$0
0
$0
APPLICATIONS DENIED
0
$0
7
$70,954
14
$77,362
0
$0
0
$0
APPLICATIONS WITHDRAWN
0
$0
2
$110,300
10
$99,855
0
$0
0
$0
FILES CLOSED FOR INCOMPLETENESS
0
$0
1
$99,250
2
$61,110
0
$0
0
$0
Aggregated Statistics For Year 2000 (Based on 2 partial tracts)
A) FHA, FSA/RHS & VA Home Purchase Loans
B) Conventional Home Purchase Loans
C) Refinancings
D) Home Improvement Loans
F) Non-occupant Loans on < 5 Family Dwellings (A B C & D)
Number
Average Value
Number
Average Value
Number
Average Value
Number
Average Value
Number
Average Value
LOANS ORIGINATED
3
$68,477
19
$84,787
18
$71,993
10
$18,940
3
$69,777
APPLICATIONS APPROVED, NOT ACCEPTED
0
$0
0
$0
4
$58,292
0
$0
0
$0
APPLICATIONS DENIED
0
$0
5
$63,970
8
$62,789
1
$12,570
1
$34,240
APPLICATIONS WITHDRAWN
0
$0
1
$100,120
7
$78,631
1
$9,970
0
$0
FILES CLOSED FOR INCOMPLETENESS
0
$0
0
$0
1
$95,350
0
$0
0
$0
Aggregated Statistics For Year 1999 (Based on 1 partial tract)
A) FHA, FSA/RHS & VA Home Purchase Loans
B) Conventional Home Purchase Loans
C) Refinancings
D) Home Improvement Loans
F) Non-occupant Loans on < 5 Family Dwellings (A B C & D)


 Nearest zip codes: 52328, 52341, 52302, 52233, 52213, 52214.