Estimated zip code population in 2022: 1,794 Zip code population in 2010: 1,690 Zip code population in 2000: 1,791
Houses and condos: 811 Renter-occupied apartments: 154
% of renters here:
21%
State:
32%
March 2022 cost of living index in zip code 54726: 86.6 (less than average, U.S. average is 100)
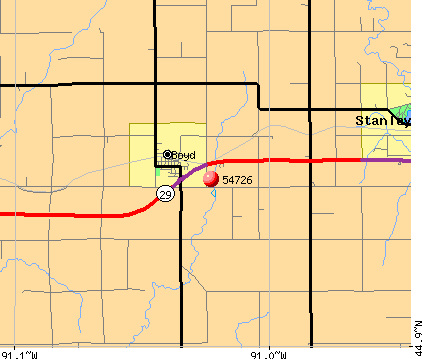
Land area: 82.5 sq. mi. Water area: 0.3 sq. mi.
Population density: 22 people per square mile
(very low).
OSM Map
General Map
Google Map
MSN Map
OSM Map
General Map
Google Map
MSN Map
OSM Map
General Map
Google Map
MSN Map
OSM Map
General Map
Google Map
MSN Map
Please wait while loading the map...
Real estate property taxes paid for housing units in 2022:
This zip code:
1.0% ($1,693)
Wisconsin:
1.4% ($3,497)
Median real estate property taxes paid for housing units with mortgages in 2022: $1,613 (0.9%) Median real estate property taxes paid for housing units with no mortgage in 2022: $1,762 (1.0%)
Business Search- 14 Million verified businesses
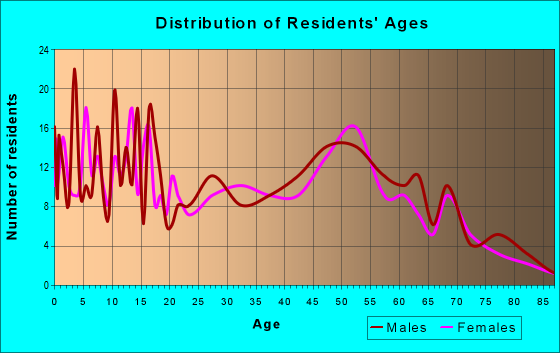
Males: 926
(51.6%)
Females: 868
(48.4%)
For population 25 years and over in 54726:
High school or higher: 86.6%
Bachelor's degree or higher: 11.2%
Graduate or professional degree: 3.1%
Unemployed: 1.7%
Mean travel time to work (commute): 30.4 minutes
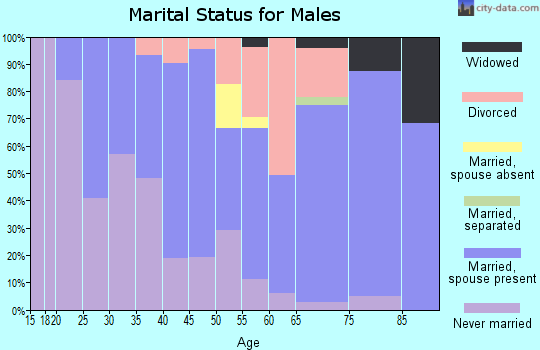
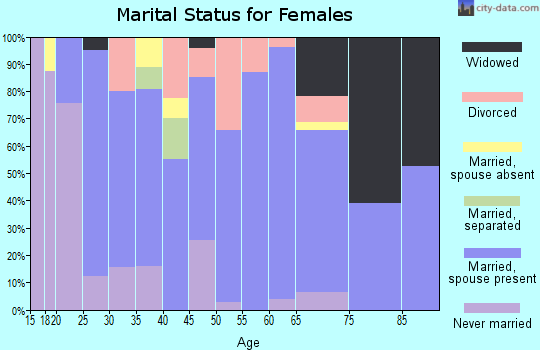
For population 15 years and over in 54726:
Never married: 25.7%
Now married: 56.6%
Separated: 0.9%
Widowed: 5.8%
Divorced: 11.0%
Zip code 54726 compared to state average:
Black race population percentage significantly below state average.
Hispanic race population percentage significantly below state average.
Foreign-born population percentage significantly below state average.
Renting percentage below state average.
Length of stay since moving in significantly above state average.
Number of college students below state average.
Percentage of population with a bachelor's degree or higher significantly below state average.
Averages for the 2020 tax year for zip code 54726, filed in 2021:
Average Adjusted Gross Income (AGI) in 2020: $55,372 (Individual Income Tax Returns)
Here:
$55,372
State:
$72,319
Salary/wage: $48,992 (reported on 80.5% of returns)
Here:
$48,992
State:
$59,242
(% of AGI for various income ranges: 1404.6% for AGIs below $25k, 4158.6% for AGIs $25k-50k, 7788.0% for AGIs $50k-75k, 10168.3% for AGIs $75k-100k, 17996.7% for AGIs $100k-200k)
Taxable interest for individuals: $577 (reported on 36.6% of returns)
This zip code:
$577
Wisconsin:
$1,431
(% of AGI for various income ranges: 32.3% for AGIs below $25k, 30.7% for AGIs $25k-50k, 25.0% for AGIs $50k-75k, 45.0% for AGIs $75k-100k, 60.0% for AGIs $100k-200k)
Ordinary dividends: $1,508 (reported on 14.6% of returns)
Here:
$1,508
State:
$6,481
(% of AGI for various income ranges: 13.1% for AGIs below $25k, 57.1% for AGIs $25k-50k, 58.0% for AGIs $50k-75k, 43.3% for AGIs $100k-200k)
Net capital gain/loss in AGI: +$9,993 (reported on 18.3% of returns)
Here:
+$9,993
State:
+$18,329
(% of AGI for various income ranges: 123.8% for AGIs below $25k, 191.4% for AGIs $25k-50k, 645.0% for AGIs $50k-75k, 708.3% for AGIs $100k-200k)
Profit/loss from business: +$12,818 (reported on 13.4% of returns)
Here:
+$12,818
State:
+$14,562
(% of AGI for various income ranges: 102.3% for AGIs below $25k, 424.3% for AGIs $25k-50k, 1138.3% for AGIs $75k-100k)
Taxable individual retirement arrangement distribution: $6,738 (reported on 9.8% of returns)
54726:
$6,738
Wisconsin:
$19,348
(% of AGI for various income ranges: 93.8% for AGIs below $25k, 167.9% for AGIs $25k-50k, 182.0% for AGIs $50k-75k)
Earned income credit: $2,000 (reported on 12.2% of returns)
Here:
$2,000
State:
$2,155
(% of AGI for various income ranges: 83.1% for AGIs below $25k, 65.7% for AGIs $25k-50k)
Percentage of individuals using paid preparers for their 2020 taxes: 97.6%
Here:
98%
State:
94%
(% for various income ranges: 95.7% for AGIs below $25k, 100.0% for AGIs $25k-50k, 93.8% for AGIs $50k-75k, 100.0% for AGIs $75k-100k, 100.0% for AGIs $100k-200k)
Averages for the 2012 tax year for zip code 54726, filed in 2013:
Average Adjusted Gross Income (AGI) in 2012: $41,410 (Individual Income Tax Returns)
Here:
$41,410
State:
$57,939
Salary/wage: $35,548 (reported on 83.8% of returns)
Here:
$35,548
State:
$48,248
(% of AGI for various income ranges: 63.3% for AGIs below $25k, 76.0% for AGIs $25k-50k, 76.2% for AGIs $50k-75k, 72.9% for AGIs $75k-100k, 64.5% for AGIs $100k-200k)
Taxable interest for individuals: $919 (reported on 40.0% of returns)
This zip code:
$919
Wisconsin:
$1,224
(% of AGI for various income ranges: 2.9% for AGIs below $25k, 1.0% for AGIs $25k-50k, 0.7% for AGIs $50k-75k, 0.1% for AGIs $75k-100k, 0.5% for AGIs $100k-200k)
Ordinary dividends: $1,100 (reported on 16.2% of returns)
Here:
$1,100
State:
$5,137
(% of AGI for various income ranges: 2.1% for AGIs below $25k, 0.3% for AGIs $25k-50k, 0.2% for AGIs $50k-75k, 0.3% for AGIs $75k-100k)
Net capital gain/loss in AGI: +$9,171 (reported on 17.5% of returns)
Here:
+$9,171
State:
+$11,137
(% of AGI for various income ranges: 3.2% for AGIs below $25k, 3.2% for AGIs $25k-50k, 4.5% for AGIs $50k-75k, 8.7% for AGIs $75k-100k)
Profit/loss from business: +$11,717 (reported on 15.0% of returns)
Here:
+$11,717
State:
+$11,943
(% of AGI for various income ranges: 9.0% for AGIs below $25k, 5.1% for AGIs $25k-50k, 7.4% for AGIs $50k-75k)
Taxable individual retirement arrangement distribution: $8,383 (reported on 7.5% of returns)
54726:
$8,383
Wisconsin:
$14,087
Total itemized deductions: $16,919 (24% of AGI, reported on 20.0% of returns)
Here:
$16,919
State:
$22,257
Here:
23.9% of AGI
State:
20.1% of AGI
(% of AGI for various income ranges: 10.2% for AGIs $25k-50k, 8.8% for AGIs $50k-75k, 8.6% for AGIs $75k-100k, 8.9% for AGIs $100k-200k)
Charity contributions: $1,970 (reported on 12.5% of returns)
Here:
$1,970
State:
$3,370
(% of AGI for various income ranges: 1.0% for AGIs $25k-50k, 0.3% for AGIs $50k-75k, 0.7% for AGIs $75k-100k, 0.6% for AGIs $100k-200k)
Taxes paid: $5,725 (reported on 20.0% of returns)
54726:
$5,725
State:
$10,731
(% of AGI for various income ranges: 2.1% for AGIs $25k-50k, 2.8% for AGIs $50k-75k, 3.4% for AGIs $75k-100k, 4.6% for AGIs $100k-200k)
Earned income credit: $1,871 (reported on 17.5% of returns)
Here:
$1,871
State:
$2,094
(% of AGI for various income ranges: 5.3% for AGIs below $25k, 0.8% for AGIs $25k-50k)
Percentage of individuals using paid preparers for their 2012 taxes: 76.2%
Here:
76%
State:
54%
(% for various income ranges: 73.3% for AGIs below $25k, 79.2% for AGIs $25k-50k, 78.6% for AGIs $50k-75k, 71.4% for AGIs $75k-100k, 80.0% for AGIs $100k-200k)
Averages for the 2004 tax year for zip code 54726, filed in 2005:
Average Adjusted Gross Income (AGI) in 2004: $30,670 (Individual Income Tax Returns)
Here:
$30,670
State:
$47,735
Salary/wage: $27,851 (reported on 83.3% of returns)
Here:
$27,851
State:
$41,540
(% of AGI for various income ranges: 130.2% for AGIs below $10k, 70.8% for AGIs $10k-25k, 76.2% for AGIs $25k-50k, 79.8% for AGIs $50k-75k, 72.2% for AGIs $75k-100k, 55.5% for AGIs over 100k)
Taxable interest for individuals: $1,192 (reported on 50.5% of returns)
This zip code:
$1,192
Wisconsin:
$1,420
(% of AGI for various income ranges: 8.7% for AGIs below $10k, 4.5% for AGIs $10k-25k, 2.0% for AGIs $25k-50k, 1.1% for AGIs $50k-75k, 0.3% for AGIs $75k-100k, 0.4% for AGIs over 100k)
Taxable dividends: $992 (reported on 15.6% of returns)
Here:
$992
State:
$2,869
(% of AGI for various income ranges: 3.3% for AGIs below $10k, 0.6% for AGIs $10k-25k, 0.9% for AGIs $25k-50k, 0.1% for AGIs $50k-75k, 0.1% for AGIs $75k-100k)
Net capital gain/loss: +$9,857 (reported on 22.3% of returns)
Here:
+$9,857
State:
+$9,569
(% of AGI for various income ranges: 4.8% for AGIs below $10k, 5.9% for AGIs $10k-25k, 4.4% for AGIs $25k-50k, 4.7% for AGIs $50k-75k, 12.4% for AGIs $75k-100k, 21.6% for AGIs over 100k)
Profit/loss from business: +$8,171 (reported on 12.4% of returns)
Here:
+$8,171
State:
+$10,417
(% of AGI for various income ranges: 14.4% for AGIs below $10k, 6.1% for AGIs $10k-25k, 4.2% for AGIs $25k-50k, 2.3% for AGIs $50k-75k)
IRA payment deduction: $3,688 (reported on 3.8% of returns)
54726:
$3,688
Wisconsin:
$2,900
Total itemized deductions: $13,467 (23% of AGI, reported on 17.7% of returns)
Here:
$13,467
State:
$18,160
Here:
23.4% of AGI
State:
21.1% of AGI
(% of AGI for various income ranges: 4.9% for AGIs $10k-25k, 6.3% for AGIs $25k-50k, 10.2% for AGIs $50k-75k, 10.1% for AGIs $75k-100k, 8.7% for AGIs over 100k)
Charity contributions deductions: $1,607 (3% of AGI, reported on 12.6% of returns)
Here:
$1,607
State:
$2,711
Here:
2.6% of AGI
State:
3.0% of AGI
(% of AGI for various income ranges: 0.3% for AGIs $10k-25k, 0.5% for AGIs $25k-50k, 0.8% for AGIs $50k-75k, 1.6% for AGIs $75k-100k, 0.5% for AGIs over 100k)
Total tax: $3,200 (reported on 71.5% of returns)
54726:
$3,200
State:
$7,114
(% of AGI for various income ranges: 4.8% for AGIs below $10k, 4.4% for AGIs $10k-25k, 6.6% for AGIs $25k-50k, 7.3% for AGIs $50k-75k, 8.2% for AGIs $75k-100k, 15.7% for AGIs over 100k)
Earned income credit: $1,532 (reported on 14.9% of returns)
Here:
$1,532
State:
$1,544
Percentage of individuals using paid preparers for their 2004 taxes: 74.6%
Here:
75%
State:
57%
(% for various income ranges: 66.7% for AGIs below $10k, 76.4% for AGIs $10k-25k, 77.2% for AGIs $25k-50k, 78.8% for AGIs $50k-75k, 81.2% for AGIs $75k-100k, 72.2% for AGIs over 100k)
Household received Food Stamps/SNAP in the past 12 months: 102 Household did not receive Food Stamps/SNAP in the past 12 months: 627
Women who had a birth in the past 12 months: 20 (16 now married, 3 unmarried) Women who did not have a birth in the past 12 months: 344 (168 now married, 176 unmarried)
Housing units in zip code 54726 with a mortgage: 320 (60 second mortgage, 1 home equity loan, 55 both second mortgage and home equity loan) Houses without a mortgage: 11
Median monthly owner costs for units with a mortgage: $1,166 Median monthly owner costs for units without a mortgage: $506
Residents with income below the poverty level in 2022:
This zip code:
11.5%
Whole state:
10.7%
Residents with income below 50% of the poverty level in 2022:
This zip code:
7.1%
Whole state:
5.7%
Median number of rooms in houses and condos:
Here:
6.6
State:
6.5
Median number of rooms in apartments:
Here:
5.3
State:
4.1
Notable locations in this zip code not listed on our city pages
Size of family households: 214 2-persons, 161 3-persons, 70 4-persons, 42 5-persons, 25 6-persons, 5 7-or-more-persons
Size of nonfamily households: 173 1-person, 28 2-persons, 1 4-persons
264 married couples with children.
119 single-parent households (49 men, 70 women).
95.4% of residents of 54726 zip code speak English at home.
0.2% of residents speak Spanish at home (100% very well).
4.0% of residents speak other Indo-European language at home (97% very well, 3% not well).
Foreign born population: 8 (0.5%) (77.8% of them are naturalized citizens)
This zip code:
0.5%
Whole state:
5.0%
62%Eritrea
49%German
10%Polish
8%Norwegian
5%Dutch
5%American
3%French
2%Irish
Year of entry for the foreign-born population
112010 or later
62000 to 2009
01990 to 1999
0Before 1990
Facilities with environmental interests located in this zip code:
BOYD OIL CO (STH 29 AND BOUNDARY RD in BOYD, WI)
Small Quantity Generators, between 100 kg and 1000 kg of hazardous waste/month (Resource Conservation and Recovery Act (tracking hazardous waste)) - notification STATE MASTER (Wisconsin database) - RCRAINFO-WIR000025221, HAZARDOUS WASTE PROGRAM Organizations: FRANCIS HOFKES (CONTACT/OWNER)
BOYD EL (303 E PARK ST in BOYD, WI)
(National Center for Education Statistics) - STATE ID-0020 Organizations: STANLEY-BOYD AREA SCH DIST (SCHOOL DISTRICT)
BOYD OIL BULK PLANT (202 MURRAY ST in BOYD, WI)
Small Quantity Generators, between 100 kg and 1000 kg of hazardous waste/month (Resource Conservation and Recovery Act (tracking hazardous waste)) - notification Organizations: FRANCIS HOFKES (CONTACT/OWNER)
Housing units lacking complete plumbing facilities: 4.1% Housing units lacking complete kitchen facilities: 5.3%
37.3%Bottled, tank, or LP gas
28.4%Utility gas
16.8%Wood
12.6%Fuel oil, kerosene, etc.
3.3%Electricity
1.6%Other fuel
Population in 1990: 2,549.
Place of birth for U.S.-born residents:
This state: 1,503
Northeast: 62
Midwest: 105
South: 21
West: 80
68% of the 54726 zip code residents lived in the same house 5 years ago. Out of people who lived in different houses, 62% lived in this county. Out of people who lived in different counties, 50% lived in Wisconsin.
93% of the 54726 zip code residents lived in the same house 1 year ago. Out of people who lived in different houses, 29% moved from this county. Out of people who lived in different houses, 23% moved from different county within same state. Out of people who lived in different houses, 44% moved from different state. Out of people who lived in different houses, 7% moved from abroad.
Private vs. public school enrollment:
Students in private schools in grades 1 to 8 (elementary and middle school): 26
Here:
15.7%
Wisconsin:
16.7%
Students in private schools in grades 9 to 12 (high school): 4
Here:
5.1%
Wisconsin:
12.5%
Students in private undergraduate colleges: 7
Here:
24.8%
Wisconsin:
17.5%
Occupation by median earnings in the past 12 months ($)
82,955Computer and mathematical occupations
82,342Building and grounds cleaning and maintenance occupations
64,521Architecture and engineering occupations
59,813Law enforcement workers including supervisors
59,307Transportation occupations
59,293Health diagnosing and treating practitioners and other technical occupations
Top industries in this zip code by the number of employees in 2005:
Health Care and Social Assistance: Ambulance Services (20-49 employees: 1 establishment)
Accommodation and Food Services: Full-Service Restaurants (5-9: 1)
Accommodation and Food Services: Limited-Service Restaurants (5-9: 1)
Health Care and Social Assistance: Homes for the Elderly (5-9: 1)
Professional, Scientific, and Technical Services: Offices of Lawyers (1-4: 1)
Construction: Painting and Wall Covering Contractors (1-4: 1)
Other Services (except Public Administration): Business Associations (1-4: 1)
People in group quarters in 2010:
4 people in group homes intended for adults
Fatal accident statistics in 2013:
Fatal accident count: 1
Vehicles involved in fatal accidents: 1
Fatal accidents caused by drunken drivers: 1
Fatalities: 1
Persons involved in fatal accidents: 1
Pedestrians involved in fatal accidents: 0
Fatal accident statistics in 2010:
Fatal accident count: 2
Vehicles involved in fatal accidents: 3
Fatal accidents caused by drunken drivers: 0
Fatalities: 2
Persons involved in fatal accidents: 4
Pedestrians involved in fatal accidents: 0
Home Mortgage Disclosure Act Aggregated Statistics For Year 2009 (Based on 6 partial tracts)
A) FHA, FSA/RHS & VA Home Purchase Loans
B) Conventional Home Purchase Loans
C) Refinancings
D) Home Improvement Loans
F) Non-occupant Loans on < 5 Family Dwellings (A B C & D)
G) Loans On Manufactured Home Dwelling (A B C & D)
Number
Average Value
Number
Average Value
Number
Average Value
Number
Average Value
Number
Average Value
Number
Average Value
LOANS ORIGINATED
10
$100,956
31
$111,502
188
$121,041
21
$65,347
29
$131,503
8
$72,536
APPLICATIONS APPROVED, NOT ACCEPTED
1
$140,920
2
$114,750
22
$119,868
0
$0
2
$112,860
1
$135,290
APPLICATIONS DENIED
4
$124,148
6
$87,760
48
$118,790
7
$18,776
4
$72,918
5
$55,178
APPLICATIONS WITHDRAWN
0
$0
7
$106,276
23
$126,053
2
$63,445
0
$0
1
$55,900
FILES CLOSED FOR INCOMPLETENESS
0
$0
1
$85,680
7
$124,471
0
$0
1
$129,370
0
$0
Aggregated Statistics For Year 2008 (Based on 6 partial tracts)
A) FHA, FSA/RHS & VA Home Purchase Loans
B) Conventional Home Purchase Loans
C) Refinancings
D) Home Improvement Loans
E) Loans on Dwellings For 5+ Families
F) Non-occupant Loans on < 5 Family Dwellings (A B C & D)
G) Loans On Manufactured Home Dwelling (A B C & D)
Number
Average Value
Number
Average Value
Number
Average Value
Number
Average Value
Number
Average Value
Number
Average Value
Number
Average Value
LOANS ORIGINATED
11
$106,523
42
$100,902
125
$112,550
29
$54,217
1
$306,900
28
$147,734
15
$72,215
APPLICATIONS APPROVED, NOT ACCEPTED
1
$170,010
1
$275,270
25
$122,365
3
$38,597
0
$0
2
$103,785
0
$0
APPLICATIONS DENIED
1
$101,300
9
$71,931
60
$101,321
10
$47,757
0
$0
3
$85,777
7
$73,236
APPLICATIONS WITHDRAWN
1
$67,580
3
$100,637
20
$122,914
2
$54,970
0
$0
2
$114,485
0
$0
FILES CLOSED FOR INCOMPLETENESS
0
$0
0
$0
6
$132,253
0
$0
0
$0
0
$0
0
$0
Aggregated Statistics For Year 2007 (Based on 6 partial tracts)
A) FHA, FSA/RHS & VA Home Purchase Loans
B) Conventional Home Purchase Loans
C) Refinancings
D) Home Improvement Loans
E) Loans on Dwellings For 5+ Families
F) Non-occupant Loans on < 5 Family Dwellings (A B C & D)
G) Loans On Manufactured Home Dwelling (A B C & D)
Number
Average Value
Number
Average Value
Number
Average Value
Number
Average Value
Number
Average Value
Number
Average Value
Number
Average Value
LOANS ORIGINATED
5
$98,834
75
$109,171
122
$104,381
30
$40,038
1
$1,024,390
33
$127,435
17
$55,196
APPLICATIONS APPROVED, NOT ACCEPTED
1
$97,690
6
$114,875
23
$105,263
3
$40,480
0
$0
3
$64,387
1
$134,600
APPLICATIONS DENIED
3
$87,683
14
$93,914
66
$109,963
8
$50,466
0
$0
5
$82,018
7
$69,131
APPLICATIONS WITHDRAWN
1
$125,990
4
$103,320
27
$97,871
2
$43,475
0
$0
1
$165,740
1
$48,440
FILES CLOSED FOR INCOMPLETENESS
0
$0
2
$111,585
8
$115,035
0
$0
0
$0
0
$0
0
$0
Aggregated Statistics For Year 2006 (Based on 6 partial tracts)
A) FHA, FSA/RHS & VA Home Purchase Loans
B) Conventional Home Purchase Loans
C) Refinancings
D) Home Improvement Loans
E) Loans on Dwellings For 5+ Families
F) Non-occupant Loans on < 5 Family Dwellings (A B C & D)
G) Loans On Manufactured Home Dwelling (A B C & D)
Number
Average Value
Number
Average Value
Number
Average Value
Number
Average Value
Number
Average Value
Number
Average Value
Number
Average Value
LOANS ORIGINATED
4
$82,308
60
$95,005
173
$83,453
34
$32,559
2
$241,575
26
$74,381
21
$48,881
APPLICATIONS APPROVED, NOT ACCEPTED
1
$89,300
8
$80,062
21
$93,484
2
$68,000
0
$0
2
$107,320
3
$47,663
APPLICATIONS DENIED
1
$152,960
21
$71,280
83
$94,953
13
$46,789
0
$0
3
$42,120
7
$49,083
APPLICATIONS WITHDRAWN
0
$0
7
$107,536
38
$93,435
4
$62,310
0
$0
1
$106,090
3
$74,167
FILES CLOSED FOR INCOMPLETENESS
0
$0
0
$0
10
$103,588
0
$0
0
$0
0
$0
0
$0
Aggregated Statistics For Year 2005 (Based on 6 partial tracts)
A) FHA, FSA/RHS & VA Home Purchase Loans
B) Conventional Home Purchase Loans
C) Refinancings
D) Home Improvement Loans
E) Loans on Dwellings For 5+ Families
F) Non-occupant Loans on < 5 Family Dwellings (A B C & D)
G) Loans On Manufactured Home Dwelling (A B C & D)
Number
Average Value
Number
Average Value
Number
Average Value
Number
Average Value
Number
Average Value
Number
Average Value
Number
Average Value
LOANS ORIGINATED
6
$85,210
78
$90,578
158
$79,972
26
$48,134
1
$67,580
28
$77,785
20
$43,630
APPLICATIONS APPROVED, NOT ACCEPTED
0
$0
6
$82,733
18
$83,787
1
$33,720
0
$0
1
$191,090
2
$68,125
APPLICATIONS DENIED
0
$0
21
$68,165
87
$95,004
14
$38,364
0
$0
3
$114,447
9
$46,563
APPLICATIONS WITHDRAWN
0
$0
11
$82,482
46
$93,775
6
$153,577
0
$0
3
$157,750
1
$128,120
FILES CLOSED FOR INCOMPLETENESS
0
$0
1
$78,720
17
$126,258
1
$21,120
0
$0
0
$0
1
$130,410
Aggregated Statistics For Year 2004 (Based on 6 partial tracts)
A) FHA, FSA/RHS & VA Home Purchase Loans
B) Conventional Home Purchase Loans
C) Refinancings
D) Home Improvement Loans
F) Non-occupant Loans on < 5 Family Dwellings (A B C & D)
G) Loans On Manufactured Home Dwelling (A B C & D)
Number
Average Value
Number
Average Value
Number
Average Value
Number
Average Value
Number
Average Value
Number
Average Value
LOANS ORIGINATED
6
$86,242
69
$91,049
173
$83,601
29
$35,320
27
$77,590
11
$52,915
APPLICATIONS APPROVED, NOT ACCEPTED
0
$0
5
$74,440
18
$87,911
4
$43,605
1
$82,400
3
$39,410
APPLICATIONS DENIED
1
$82,800
11
$65,045
68
$91,835
7
$26,146
3
$110,327
7
$52,130
APPLICATIONS WITHDRAWN
2
$101,205
6
$106,993
41
$97,563
3
$35,557
1
$126,770
3
$93,763
FILES CLOSED FOR INCOMPLETENESS
0
$0
2
$132,510
24
$93,923
1
$34,370
0
$0
3
$71,837
Aggregated Statistics For Year 2003 (Based on 6 partial tracts)
A) FHA, FSA/RHS & VA Home Purchase Loans
B) Conventional Home Purchase Loans
C) Refinancings
D) Home Improvement Loans
E) Loans on Dwellings For 5+ Families
F) Non-occupant Loans on < 5 Family Dwellings (A B C & D)
Number
Average Value
Number
Average Value
Number
Average Value
Number
Average Value
Number
Average Value
Number
Average Value
LOANS ORIGINATED
11
$72,587
70
$84,219
294
$82,007
40
$25,537
3
$125,313
28
$87,376
APPLICATIONS APPROVED, NOT ACCEPTED
1
$96,760
2
$102,235
15
$84,671
2
$16,015
0
$0
1
$90,360
APPLICATIONS DENIED
1
$53,910
18
$58,579
82
$83,774
9
$31,182
0
$0
2
$31,545
APPLICATIONS WITHDRAWN
0
$0
8
$91,848
45
$100,342
3
$38,237
0
$0
2
$84,440
FILES CLOSED FOR INCOMPLETENESS
0
$0
1
$58,530
8
$95,295
1
$33,200
0
$0
0
$0
Aggregated Statistics For Year 2002 (Based on 6 partial tracts)
A) FHA, FSA/RHS & VA Home Purchase Loans
B) Conventional Home Purchase Loans
C) Refinancings
D) Home Improvement Loans
F) Non-occupant Loans on < 5 Family Dwellings (A B C & D)
Number
Average Value
Number
Average Value
Number
Average Value
Number
Average Value
Number
Average Value
LOANS ORIGINATED
5
$76,392
65
$76,687
264
$76,516
31
$23,541
30
$56,727
APPLICATIONS APPROVED, NOT ACCEPTED
0
$0
7
$66,576
14
$83,582
1
$14,920
0
$0
APPLICATIONS DENIED
1
$87,600
24
$67,077
62
$83,245
6
$13,167
3
$75,400
APPLICATIONS WITHDRAWN
1
$83,070
11
$78,475
35
$83,561
1
$51,150
1
$56,640
FILES CLOSED FOR INCOMPLETENESS
0
$0
1
$57,120
4
$135,440
0
$0
0
$0
Aggregated Statistics For Year 2001 (Based on 6 partial tracts)
A) FHA, FSA/RHS & VA Home Purchase Loans
B) Conventional Home Purchase Loans
C) Refinancings
D) Home Improvement Loans
E) Loans on Dwellings For 5+ Families
F) Non-occupant Loans on < 5 Family Dwellings (A B C & D)
Number
Average Value
Number
Average Value
Number
Average Value
Number
Average Value
Number
Average Value
Number
Average Value
LOANS ORIGINATED
3
$76,930
54
$75,921
222
$70,978
29
$23,472
1
$238,520
22
$44,653
APPLICATIONS APPROVED, NOT ACCEPTED
0
$0
3
$52,293
12
$87,311
1
$13,160
0
$0
1
$72,240
APPLICATIONS DENIED
1
$44,540
19
$42,991
56
$62,116
12
$20,537
0
$0
3
$47,500
APPLICATIONS WITHDRAWN
0
$0
9
$75,080
35
$74,636
3
$25,687
0
$0
2
$65,640
FILES CLOSED FOR INCOMPLETENESS
0
$0
2
$81,015
3
$86,337
0
$0
0
$0
0
$0
Aggregated Statistics For Year 2000 (Based on 6 partial tracts)
A) FHA, FSA/RHS & VA Home Purchase Loans
B) Conventional Home Purchase Loans
C) Refinancings
D) Home Improvement Loans
E) Loans on Dwellings For 5+ Families
F) Non-occupant Loans on < 5 Family Dwellings (A B C & D)
Number
Average Value
Number
Average Value
Number
Average Value
Number
Average Value
Number
Average Value
Number
Average Value
LOANS ORIGINATED
4
$72,692
59
$65,513
90
$47,620
43
$23,813
2
$140,015
17
$47,874
APPLICATIONS APPROVED, NOT ACCEPTED
0
$0
4
$41,672
9
$50,448
1
$27,990
0
$0
0
$0
APPLICATIONS DENIED
0
$0
35
$42,115
40
$48,037
9
$16,144
0
$0
2
$32,420
APPLICATIONS WITHDRAWN
0
$0
6
$72,558
23
$69,893
0
$0
0
$0
1
$47,400
FILES CLOSED FOR INCOMPLETENESS
0
$0
1
$57,730
3
$93,457
0
$0
0
$0
0
$0
Aggregated Statistics For Year 1999 (Based on 3 partial tracts)
A) FHA, FSA/RHS & VA Home Purchase Loans
B) Conventional Home Purchase Loans
C) Refinancings
D) Home Improvement Loans
F) Non-occupant Loans on < 5 Family Dwellings (A B C & D)


 Nearest zip codes: 54768, 54727, 54771, 54722, 54732, 54748.