Estimated zip code population in 2022: 1,222 Zip code population in 2010: 1,408 Zip code population in 2000: 1,098
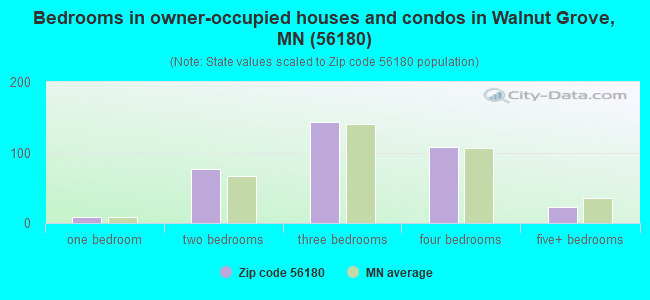
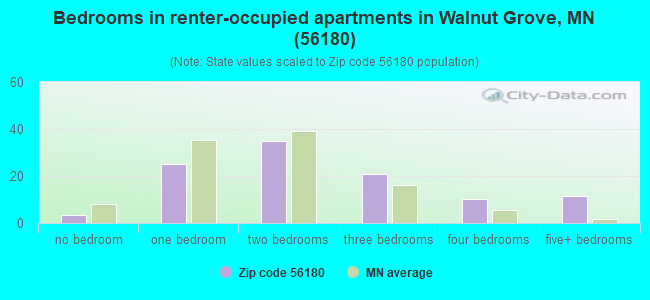
Houses and condos: 566 Renter-occupied apartments: 106
% of renters here:
23%
State:
28%
March 2022 cost of living index in zip code 56180: 84.3 (less than average, U.S. average is 100)
Land area: 115.3 sq. mi. Water area: 0.2 sq. mi.
Population density: 11 people per square mile
(very low).
OSM Map
General Map
Google Map
MSN Map
OSM Map
General Map
Google Map
MSN Map
OSM Map
General Map
Google Map
MSN Map
OSM Map
General Map
Google Map
MSN Map
Please wait while loading the map...
Real estate property taxes paid for housing units in 2022:
This zip code:
0.9% ($986)
Minnesota:
1.0% ($3,087)
Median real estate property taxes paid for housing units with mortgages in 2022: $825 (0.9%) Median real estate property taxes paid for housing units with no mortgage in 2022: $1,095 (0.9%)
Business Search- 14 Million verified businesses
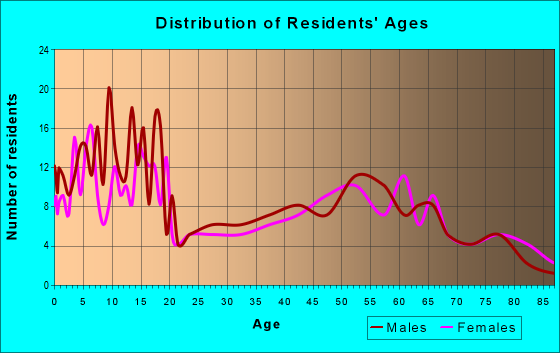
Males: 646
(52.9%)
Females: 576
(47.1%)
For population 25 years and over in 56180:
High school or higher: 88.5%
Bachelor's degree or higher: 20.4%
Graduate or professional degree: 5.3%
Unemployed: 0.4%
Mean travel time to work (commute): 22.0 minutes
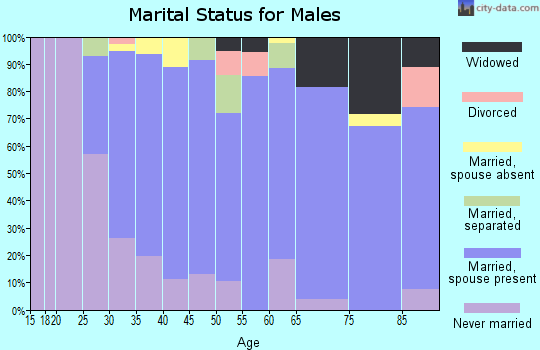
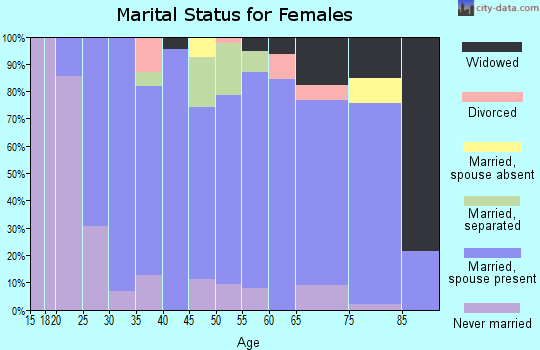
For population 15 years and over in 56180:
Never married: 30.1%
Now married: 55.4%
Separated: 1.6%
Widowed: 6.4%
Divorced: 6.5%
Zip code 56180 compared to state average:
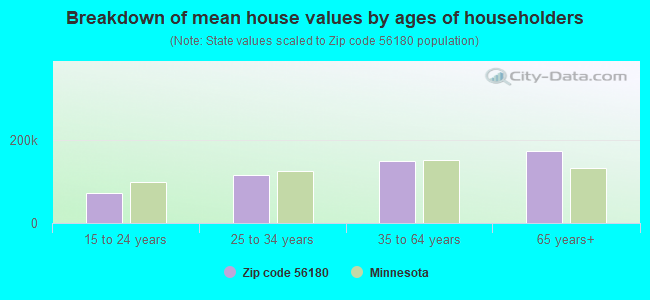
Median house value significantly below state average.
Unemployed percentage significantly below state average.
Black race population percentage significantly below state average.
Foreign-born population percentage above state average.
Length of stay since moving in significantly above state average.
House age above state average.
Percentage of population with a bachelor's degree or higher below state average.
Estimated median house/condo value in 2022: $108,925
56180:
$108,925
Minnesota:
$314,600
Median resident age:
This zip code:
35.6 years
Minnesota median age:
39.0 years
Average household size:
This zip code:
2.6 people
Minnesota:
2.4 people
Averages for the 2020 tax year for zip code 56180, filed in 2021:
Average Adjusted Gross Income (AGI) in 2020: $57,648 (Individual Income Tax Returns)
Here:
$57,648
State:
$82,178
Salary/wage: $38,848 (reported on 82.8% of returns)
Here:
$38,848
State:
$67,438
(% of AGI for various income ranges: 1367.7% for AGIs below $25k, 3427.7% for AGIs $25k-50k, 6766.0% for AGIs $50k-75k, 10486.7% for AGIs $75k-100k, 14710.0% for AGIs $100k-200k)
Taxable interest for individuals: $1,541 (reported on 37.9% of returns)
This zip code:
$1,541
Minnesota:
$1,814
(% of AGI for various income ranges: 24.6% for AGIs below $25k, 63.8% for AGIs $25k-50k, 114.0% for AGIs $50k-75k, 110.0% for AGIs $75k-100k, 335.0% for AGIs $100k-200k)
Ordinary dividends: $1,292 (reported on 20.7% of returns)
Here:
$1,292
State:
$6,928
(% of AGI for various income ranges: 20.8% for AGIs $25k-50k, 102.0% for AGIs $50k-75k, 192.5% for AGIs $100k-200k)
Net capital gain/loss in AGI: +$5,482 (reported on 19.0% of returns)
Here:
+$5,482
State:
+$20,591
(% of AGI for various income ranges: 69.2% for AGIs $25k-50k, 360.0% for AGIs $50k-75k, 832.5% for AGIs $100k-200k)
Profit/loss from business: +$15,075 (reported on 13.8% of returns)
Here:
+$15,075
State:
+$14,342
(% of AGI for various income ranges: 235.4% for AGIs $25k-50k, 320.0% for AGIs $50k-75k, 1850.0% for AGIs $100k-200k)
Taxable individual retirement arrangement distribution: $10,160 (reported on 8.6% of returns)
56180:
$10,160
Minnesota:
$20,675
(% of AGI for various income ranges: 110.0% for AGIs below $25k, 1216.7% for AGIs $75k-100k)
Earned income credit: $2,150 (reported on 17.2% of returns)
Here:
$2,150
State:
$2,055
(% of AGI for various income ranges: 90.0% for AGIs below $25k, 75.4% for AGIs $25k-50k)
Percentage of individuals using paid preparers for their 2020 taxes: 91.4%
Here:
91%
State:
94%
(% for various income ranges: 88.9% for AGIs below $25k, 93.8% for AGIs $25k-50k, 88.9% for AGIs $50k-75k, 100.0% for AGIs $75k-100k, 88.9% for AGIs $100k-200k)
Averages for the 2012 tax year for zip code 56180, filed in 2013:
Average Adjusted Gross Income (AGI) in 2012: $54,486 (Individual Income Tax Returns)
Here:
$54,486
State:
$67,192
Salary/wage: $28,869 (reported on 81.0% of returns)
Here:
$28,869
State:
$55,182
(% of AGI for various income ranges: 77.2% for AGIs below $25k, 73.4% for AGIs $25k-50k, 64.2% for AGIs $50k-75k, 55.0% for AGIs $75k-100k, 34.4% for AGIs $100k-200k)
Taxable interest for individuals: $1,756 (reported on 39.7% of returns)
This zip code:
$1,756
Minnesota:
$1,664
(% of AGI for various income ranges: 1.3% for AGIs below $25k, 0.7% for AGIs $25k-50k, 0.8% for AGIs $50k-75k, 0.8% for AGIs $75k-100k, 1.8% for AGIs $100k-200k, 1.7% for AGIs over 200k)
Ordinary dividends: $1,791 (reported on 17.5% of returns)
Here:
$1,791
State:
$5,665
(% of AGI for various income ranges: 1.0% for AGIs $25k-50k, 0.5% for AGIs $75k-100k, 1.7% for AGIs $100k-200k)
Net capital gain/loss in AGI: +$10,592 (reported on 19.0% of returns)
Here:
+$10,592
State:
+$16,131
(% of AGI for various income ranges: 0.1% for AGIs below $25k, 1.2% for AGIs $50k-75k, 15.9% for AGIs $100k-200k)
Profit/loss from business: +$4,640 (reported on 15.9% of returns)
Here:
+$4,640
State:
+$12,430
(% of AGI for various income ranges: 4.7% for AGIs below $25k, 2.7% for AGIs $25k-50k, 3.2% for AGIs $75k-100k)
Taxable individual retirement arrangement distribution: $6,550 (reported on 6.3% of returns)
56180:
$6,550
Minnesota:
$15,212
Total itemized deductions: $20,027 (18% of AGI, reported on 17.5% of returns)
Here:
$20,027
State:
$24,665
Here:
17.9% of AGI
State:
19.6% of AGI
(% of AGI for various income ranges: 13.6% for AGIs below $25k, 13.9% for AGIs $50k-75k, 14.4% for AGIs $100k-200k)
Charity contributions: $2,956 (reported on 14.3% of returns)
Here:
$2,956
State:
$3,948
(% of AGI for various income ranges: 1.5% for AGIs below $25k, 2.1% for AGIs $50k-75k, 1.6% for AGIs $100k-200k)
Taxes paid: $7,882 (reported on 17.5% of returns)
56180:
$7,882
State:
$10,589
(% of AGI for various income ranges: 1.4% for AGIs below $25k, 4.3% for AGIs $50k-75k, 8.1% for AGIs $100k-200k)
Earned income credit: $3,192 (reported on 19.0% of returns)
Here:
$3,192
State:
$2,037
(% of AGI for various income ranges: 8.7% for AGIs below $25k, 1.8% for AGIs $25k-50k)
Percentage of individuals using paid preparers for their 2012 taxes: 71.4%
Here:
71%
State:
55%
(% for various income ranges: 63.0% for AGIs below $25k, 71.4% for AGIs $25k-50k, 75.0% for AGIs $50k-75k, 83.3% for AGIs $75k-100k, 83.3% for AGIs $100k-200k, 100.0% for AGIs over 200k)
Averages for the 2004 tax year for zip code 56180, filed in 2005:
Average Adjusted Gross Income (AGI) in 2004: $33,236 (Individual Income Tax Returns)
Here:
$33,236
State:
$53,560
Salary/wage: $24,169 (reported on 81.7% of returns)
Here:
$24,169
State:
$46,177
(% of AGI for various income ranges: 99.8% for AGIs below $10k, 66.2% for AGIs $10k-25k, 68.2% for AGIs $25k-50k, 61.8% for AGIs $50k-75k, 65.3% for AGIs $75k-100k, 22.0% for AGIs over 100k)
Taxable interest for individuals: $1,207 (reported on 48.2% of returns)
This zip code:
$1,207
Minnesota:
$1,796
(% of AGI for various income ranges: 3.4% for AGIs below $10k, 2.6% for AGIs $10k-25k, 1.9% for AGIs $25k-50k, 1.5% for AGIs $50k-75k, 0.7% for AGIs $75k-100k, 1.7% for AGIs over 100k)
Taxable dividends: $702 (reported on 22.9% of returns)
Here:
$702
State:
$3,096
(% of AGI for various income ranges: 0.7% for AGIs below $10k, 0.5% for AGIs $10k-25k, 0.8% for AGIs $25k-50k, 0.4% for AGIs $50k-75k, 0.5% for AGIs $75k-100k)
Net capital gain/loss: +$4,331 (reported on 25.1% of returns)
Here:
+$4,331
State:
+$10,864
(% of AGI for various income ranges: -4.1% for AGIs below $10k, 1.6% for AGIs $10k-25k, 0.6% for AGIs $25k-50k, 3.5% for AGIs $50k-75k, 0.6% for AGIs $75k-100k, 13.1% for AGIs over 100k)
Profit/loss from business: +$3,813 (reported on 16.8% of returns)
Here:
+$3,813
State:
+$10,442
(% of AGI for various income ranges: 8.4% for AGIs below $10k, -0.2% for AGIs $10k-25k, 3.1% for AGIs $25k-50k, 3.5% for AGIs $50k-75k, 0.2% for AGIs $75k-100k)
Profit/loss from farming: +$13,539 (reported on 23.6% of returns)
Here:
+$13,539
State:
-$962
(% of AGI for various income ranges: 9.7% for AGIs below $10k, 7.6% for AGIs $10k-25k, 6.4% for AGIs $25k-50k, 11.5% for AGIs $50k-75k, 23.5% for AGIs over 100k)
IRA payment deduction: $2,000 (reported on 2.6% of returns)
56180:
$2,000
Minnesota:
$2,955
Total itemized deductions: $14,269 (26% of AGI, reported on 14.4% of returns)
Here:
$14,269
State:
$20,035
Here:
25.8% of AGI
State:
21.3% of AGI
(% of AGI for various income ranges: 8.5% for AGIs $10k-25k, 5.4% for AGIs $25k-50k, 7.1% for AGIs $50k-75k, 11.9% for AGIs $75k-100k)
Charity contributions deductions: $1,701 (3% of AGI, reported on 12.4% of returns)
Here:
$1,701
State:
$3,333
Here:
3.0% of AGI
State:
3.4% of AGI
(% of AGI for various income ranges: 1.2% for AGIs $10k-25k, 0.6% for AGIs $25k-50k, 0.8% for AGIs $50k-75k, 0.8% for AGIs $75k-100k)
Total tax: $4,406 (reported on 72.7% of returns)
56180:
$4,406
State:
$8,485
(% of AGI for various income ranges: 4.3% for AGIs below $10k, 4.4% for AGIs $10k-25k, 6.9% for AGIs $25k-50k, 9.6% for AGIs $50k-75k, 10.9% for AGIs $75k-100k, 19.1% for AGIs over 100k)
Earned income credit: $1,670 (reported on 17.9% of returns)
Here:
$1,670
State:
$1,523
Percentage of individuals using paid preparers for their 2004 taxes: 76.4%
Here:
76%
State:
59%
(% for various income ranges: 61.0% for AGIs below $10k, 76.9% for AGIs $10k-25k, 82.9% for AGIs $25k-50k, 85.3% for AGIs $50k-75k, 78.1% for AGIs $75k-100k, 85.0% for AGIs over 100k)
Likely homosexual households (counted as self-reported same-sex unmarried-partner households)
Lesbian couples: 0.0% of all households
Gay men: 0.4% of all households
Household received Food Stamps/SNAP in the past 12 months: 51 Household did not receive Food Stamps/SNAP in the past 12 months: 416
Women who had a birth in the past 12 months: 13 (10 now married, 2 unmarried) Women who did not have a birth in the past 12 months: 198 (97 now married, 101 unmarried)
Housing units in zip code 56180 with a mortgage: 120 (1 second mortgage) Median monthly owner costs for units with a mortgage: $925 Median monthly owner costs for units without a mortgage: $526
Residents with income below the poverty level in 2022:
This zip code:
15.7%
Whole state:
9.6%
Residents with income below 50% of the poverty level in 2022:
This zip code:
9.6%
Whole state:
5.2%
Median number of rooms in houses and condos:
Here:
6.6
State:
7.1
Median number of rooms in apartments:
Here:
4.8
State:
3.8
Notable locations in this zip code not listed on our city pages
Notable locations in zip code 56180: Walnut Grove (A), Walnut Grove Fire Department (B), Walnut Grove City Hall (C), Walnut Grove Police Department (D), Wilder Museum (E). Display/hide their locations on the map
Churches in zip code 56180 include: Holly Church (A), Saint Olaf Church (B), Saint Paul Parish (C), English Lutheran Church (D), Trinity Lutheran Church (E), Methodist Church (F), Heritage Baptist Bible Church (G). Display/hide their locations on the map
Cemeteries: Calvary Cemetery (1), Saint Olaf Cemetery (2), Trinity Cemetery (3), Walnut Grove Cemetery (4), North Hero Cemetery (5), Old Gales Cemetery (6). Display/hide their locations on the map
Size of family households: 144 2-persons, 46 3-persons, 45 4-persons, 22 5-persons, 9 6-persons, 26 7-or-more-persons
Size of nonfamily households: 145 1-person, 23 2-persons, 3 3-persons
278 married couples with children.
56 single-parent households (47 men, 9 women).
79.8% of residents of 56180 zip code speak English at home.
1.8% of residents speak Spanish at home (100% very well).
0.1% of residents speak other Indo-European language at home (100% very well).
18.0% of residents speak Asian or Pacific Island language at home (46% very well, 24% well, 27% not well, 2% not at all).
Foreign born population: 176 (14.4%) (71.6% of them are naturalized citizens)
This zip code:
14.4%
Whole state:
8.7%
67%Indonesia
10%Singapore
8%Bhutan
3%Guatemala
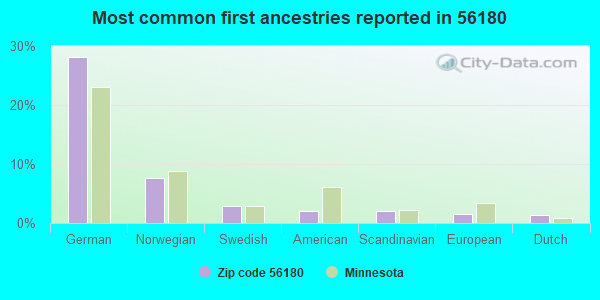
28%German
8%Norwegian
3%Swedish
2%American
2%Scandinavian
1%European
1%Dutch
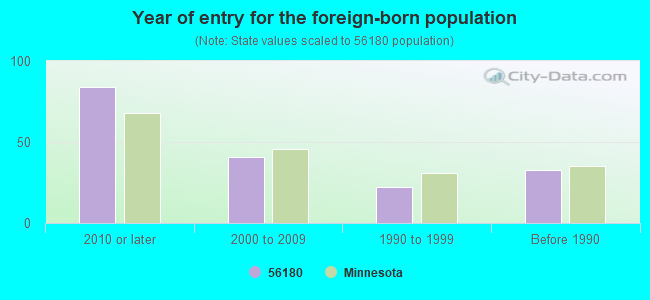
Year of entry for the foreign-born population
842010 or later
412000 to 2009
221990 to 1999
33Before 1990
Facilities with environmental interests located in this zip code:
NNG WALNUT GROVE TBS (8TH ST N in WALNUT GROVE, MN)
STATE MASTER (Minnesota Pollution Control Agency permits and compilance tracking) - RCRIS-MNS000105916, HAZARDOUS WASTE PROGRAM (Resource Conservation and Recovery Act (tracking hazardous waste)) Business SIC classification: NATURAL GAS TRANSMISSION Business NAICS classification: PIPELINE TRANSPORTATION OF NATURAL GAS. Organizations: NORTHERN NATURAL GAS CO (CONTACT/OWNER)
Housing units lacking complete plumbing facilities: 0.3% Housing units lacking complete kitchen facilities: 2.9%
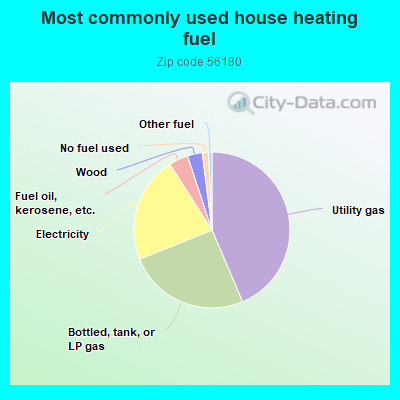
43.9%Utility gas
25.5%Bottled, tank, or LP gas
22.2%Electricity
4.0%Fuel oil, kerosene, etc.
3.1%Wood
1.3%No fuel used
0.7%Other fuel
Population in 1990: 1,277.
Place of birth for U.S.-born residents:
This state: 845
Midwest: 116
South: 22
West: 62
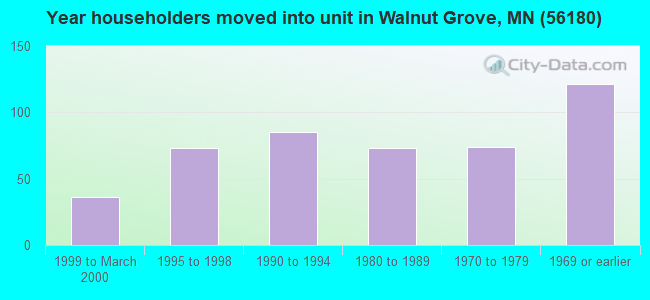
74% of the 56180 zip code residents lived in the same house 5 years ago. Out of people who lived in different houses, 51% lived in this county. Out of people who lived in different counties, 50% lived in Minnesota.
95% of the 56180 zip code residents lived in the same house 1 year ago. Out of people who lived in different houses, 41% moved from this county. Out of people who lived in different houses, 41% moved from different county within same state. Out of people who lived in different houses, 24% moved from different state.
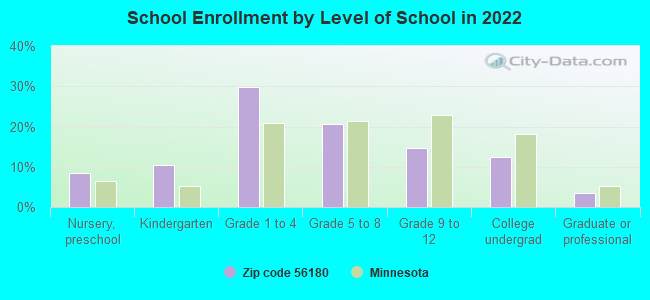
Private vs. public school enrollment:
Students in private schools in grades 1 to 8 (elementary and middle school): 4
Here:
2.9%
Minnesota:
12.9%
Students in private schools in grades 9 to 12 (high school): 2
Here:
4.8%
Minnesota:
8.6%
Students in private undergraduate colleges: 15
Here:
39.1%
Minnesota:
26.2%
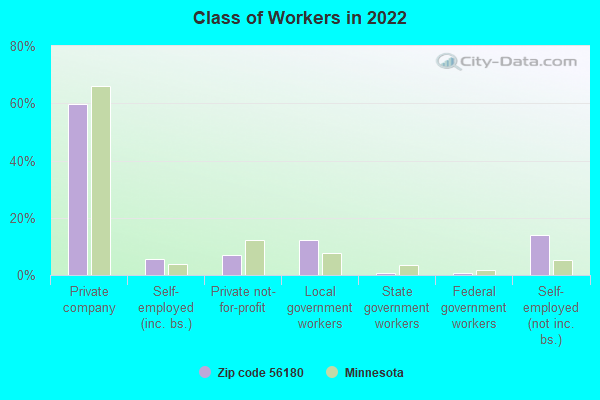
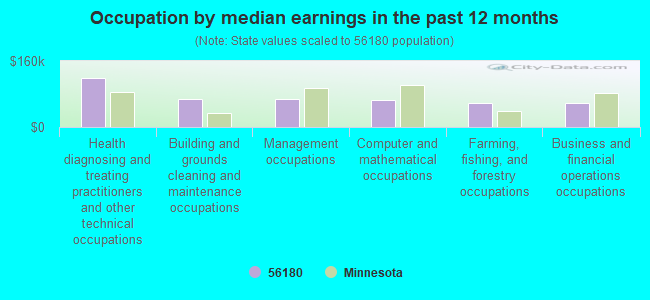
Occupation by median earnings in the past 12 months ($)
118,599Health diagnosing and treating practitioners and other technical occupations
67,956Building and grounds cleaning and maintenance occupations
66,962Management occupations
65,612Computer and mathematical occupations
59,006Farming, fishing, and forestry occupations
58,604Business and financial operations occupations
Top industries in this zip code by the number of employees in 2005:
Other Services (except Public Administration): Religious Organizations (5-9 employees: 1 establishment, 1-4 employees: 4 establishments)
Construction: Highway, Street, and Bridge Construction (10-19: 1)
Finance and Insurance: Commercial Banking (5-9: 1)
Finance and Insurance: Insurance Agencies and Brokerages (5-9: 1)
Arts, Entertainment, and Recreation: Museums (5-9: 1)
Construction: Painting and Wall Covering Contractors (1-4: 2)
Fatal accident statistics in 2014:
Fatal accident count: 1
Vehicles involved in fatal accidents: 2
Fatal accidents caused by drunken drivers: 0
Fatalities: 1
Persons involved in fatal accidents: 5
Pedestrians involved in fatal accidents: 0
Fatal accident statistics in 2013:
Fatal accident count: 1
Vehicles involved in fatal accidents: 1
Fatal accidents caused by drunken drivers: 1
Fatalities: 1
Persons involved in fatal accidents: 1
Pedestrians involved in fatal accidents: 0
2002 - 2018 National Fire Incident Reporting System (NFIRS) incidents
Based on the data from the years 2002 - 2018 the average number of fire incidents per year is 10. The highest number of reported fires - 18 took place in 2011, and the least - 2 in 2002. The data has a growing trend.
When looking into fire subcategories, the most reports belonged to: Structure Fires (37.0%), and Outside Fires (32.7%).
Fire incident types reported to NFIRS in Zip Code 56180


+$13,539
-$962
(% of AGI for various income ranges: 9.7% for AGIs below $10k, 7.6% for AGIs $10k-25k, 6.4% for AGIs $25k-50k, 11.5% for AGIs $50k-75k, 23.5% for AGIs over 100k) Nearest zip codes: 56166, 56255, 56175, 56152, 56263, 56123.
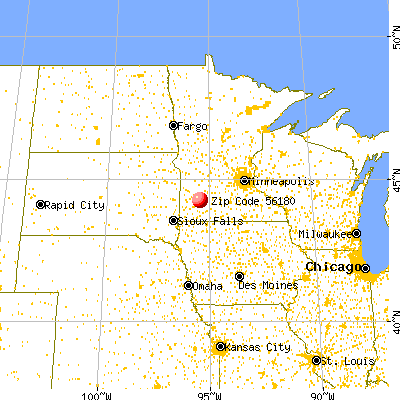


 Based on the data from the years 2002 - 2018 the average number of fire incidents per year is 10. The highest number of reported fires - 18 took place in 2011, and the least - 2 in 2002. The data has a growing trend.
 When looking into fire subcategories, the most reports belonged to: Structure Fires (37.0%), and Outside Fires (32.7%).