Estimated zip code population in 2022: 2,237 Zip code population in 2010: 1,902 Zip code population in 2000: 1,975
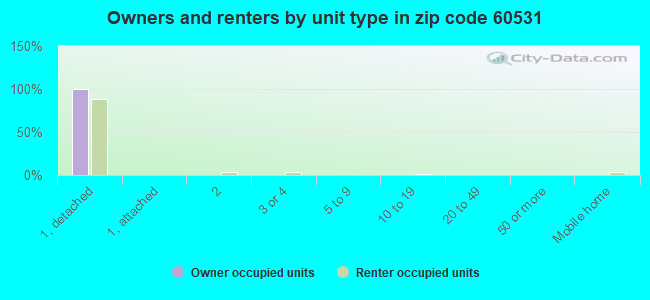
Houses and condos: 897 Renter-occupied apartments: 246
% of renters here:
28%
State:
33%
March 2022 cost of living index in zip code 60531: 87.8 (less than average, U.S. average is 100)
Land area: 58.3 sq. mi. Water area: 0.0 sq. mi.
Population density: 38 people per square mile
(very low).
OSM Map
General Map
Google Map
MSN Map
OSM Map
General Map
Google Map
MSN Map
OSM Map
General Map
Google Map
MSN Map
OSM Map
General Map
Google Map
MSN Map
Please wait while loading the map...
Real estate property taxes paid for housing units in 2022:
This zip code:
2.1% ($4,689)
Illinois:
2.0% ($4,912)
Median real estate property taxes paid for housing units with mortgages in 2022: $4,455 (2.0%) Median real estate property taxes paid for housing units with no mortgage in 2022: $5,000 (1.9%)
Business Search- 14 Million verified businesses
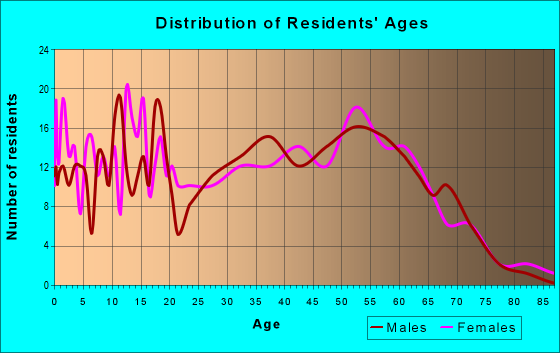
Males: 1,112
(49.7%)
Females: 1,124
(50.3%)
For population 25 years and over in 60531:
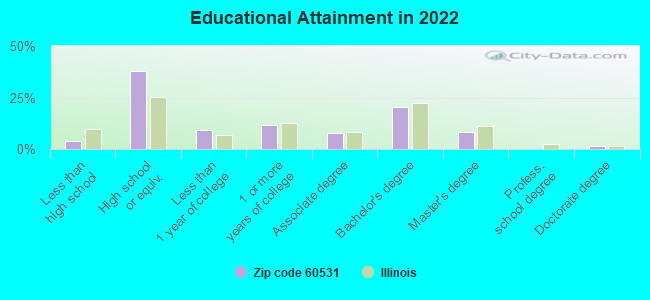
High school or higher: 95.6%
Bachelor's degree or higher: 29.7%
Graduate or professional degree: 9.6%
Unemployed: 5.1%
Mean travel time to work (commute): 39.2 minutes
For population 15 years and over in 60531:
Never married: 32.4%
Now married: 50.1%
Separated: 0.1%
Widowed: 5.5%
Divorced: 11.8%
Zip code 60531 compared to state average:
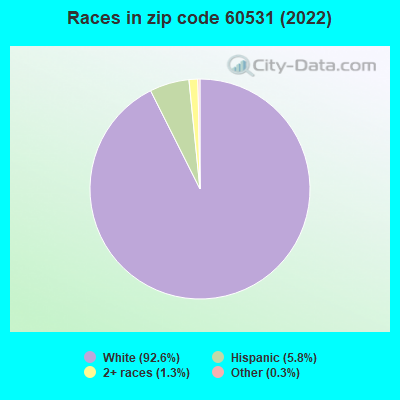
Black race population percentage significantly below state average.
Hispanic race population percentage significantly below state average.
Foreign-born population percentage significantly below state average.
Length of stay since moving in significantly above state average.
Averages for the 2020 tax year for zip code 60531, filed in 2021:
Average Adjusted Gross Income (AGI) in 2020: $64,477 (Individual Income Tax Returns)
Here:
$64,477
State:
$82,626
Salary/wage: $56,617 (reported on 81.9% of returns)
Here:
$56,617
State:
$66,640
(% of AGI for various income ranges: 1277.8% for AGIs below $25k, 3587.3% for AGIs $25k-50k, 6347.0% for AGIs $50k-75k, 10020.0% for AGIs $75k-100k, 15280.8% for AGIs $100k-200k)
Taxable interest for individuals: $974 (reported on 36.2% of returns)
This zip code:
$974
Illinois:
$2,376
(% of AGI for various income ranges: 26.1% for AGIs below $25k, 40.0% for AGIs $25k-50k, 13.0% for AGIs $50k-75k, 31.4% for AGIs $75k-100k, 108.3% for AGIs $100k-200k)
Ordinary dividends: $2,985 (reported on 21.3% of returns)
Here:
$2,985
State:
$9,061
(% of AGI for various income ranges: 31.7% for AGIs below $25k, 59.3% for AGIs $25k-50k, 47.0% for AGIs $50k-75k, 54.3% for AGIs $75k-100k, 305.0% for AGIs $100k-200k)
Net capital gain/loss in AGI: +$10,247 (reported on 18.1% of returns)
Here:
+$10,247
State:
+$31,684
(% of AGI for various income ranges: 27.2% for AGIs below $25k, 48.0% for AGIs $25k-50k, 109.0% for AGIs $50k-75k, 1260.0% for AGIs $100k-200k)
Profit/loss from business: +$5,762 (reported on 13.8% of returns)
Here:
+$5,762
State:
+$12,175
(% of AGI for various income ranges: 285.0% for AGIs below $25k, 204.2% for AGIs $100k-200k)
Taxable individual retirement arrangement distribution: $14,488 (reported on 8.5% of returns)
60531:
$14,488
Illinois:
$21,613
(% of AGI for various income ranges: 105.0% for AGIs below $25k, 337.0% for AGIs $50k-75k, 527.5% for AGIs $100k-200k)
Total itemized deductions: $21,080 (reported on 5.3% of returns)
Here:
$21,080
State:
$34,948
(% of AGI for various income ranges: 509.0% for AGIs $50k-75k, 454.2% for AGIs $100k-200k)
Charity contributions: $4,767 (reported on 3.2% of returns)
Here:
$4,767
State:
$13,122
(% of AGI for various income ranges: 204.3% for AGIs $75k-100k)
Taxes paid: $7,280 (reported on 5.3% of returns)
60531:
$7,280
State:
$8,563
(% of AGI for various income ranges: 175.0% for AGIs $50k-75k, 157.5% for AGIs $100k-200k)
Earned income credit: $1,875 (reported on 12.8% of returns)
Here:
$1,875
State:
$2,311
(% of AGI for various income ranges: 76.1% for AGIs below $25k, 58.7% for AGIs $25k-50k)
Percentage of individuals using paid preparers for their 2020 taxes: 92.6%
Here:
93%
State:
93%
(% for various income ranges: 89.3% for AGIs below $25k, 95.0% for AGIs $25k-50k, 92.9% for AGIs $50k-75k, 90.9% for AGIs $75k-100k, 94.4% for AGIs $100k-200k, 100.0% for AGIs over 200k)
Averages for the 2012 tax year for zip code 60531, filed in 2013:
Average Adjusted Gross Income (AGI) in 2012: $54,429 (Individual Income Tax Returns)
Here:
$54,429
State:
$68,058
Salary/wage: $45,122 (reported on 86.8% of returns)
Here:
$45,122
State:
$55,396
(% of AGI for various income ranges: 74.3% for AGIs below $25k, 77.3% for AGIs $25k-50k, 79.1% for AGIs $50k-75k, 78.6% for AGIs $75k-100k, 63.3% for AGIs $100k-200k)
Taxable interest for individuals: $847 (reported on 35.2% of returns)
This zip code:
$847
Illinois:
$1,969
(% of AGI for various income ranges: 1.6% for AGIs below $25k, 0.9% for AGIs $25k-50k, 0.3% for AGIs $50k-75k, 0.5% for AGIs $75k-100k, 0.4% for AGIs $100k-200k)
Ordinary dividends: $2,045 (reported on 22.0% of returns)
Here:
$2,045
State:
$7,786
(% of AGI for various income ranges: 1.8% for AGIs below $25k, 0.7% for AGIs $25k-50k, 0.3% for AGIs $50k-75k, 0.5% for AGIs $75k-100k, 1.0% for AGIs $100k-200k)
Net capital gain/loss in AGI: +$4,283 (reported on 13.2% of returns)
Here:
+$4,283
State:
+$22,183
(% of AGI for various income ranges: 0.8% for AGIs below $25k, 2.4% for AGIs $100k-200k)
Profit/loss from business: +$6,100 (reported on 14.3% of returns)
Here:
+$6,100
State:
+$12,903
(% of AGI for various income ranges: 3.8% for AGIs below $25k, 2.3% for AGIs $25k-50k, 1.1% for AGIs $50k-75k, 2.9% for AGIs $75k-100k, 0.5% for AGIs $100k-200k)
Taxable individual retirement arrangement distribution: $13,725 (reported on 8.8% of returns)
60531:
$13,725
Illinois:
$17,929
Total itemized deductions: $18,540 (22% of AGI, reported on 38.5% of returns)
Here:
$18,540
State:
$26,433
Here:
22.4% of AGI
State:
19.2% of AGI
(% of AGI for various income ranges: 12.7% for AGIs below $25k, 13.1% for AGIs $25k-50k, 13.4% for AGIs $50k-75k, 14.1% for AGIs $75k-100k, 12.5% for AGIs $100k-200k)
Charity contributions: $1,858 (reported on 28.6% of returns)
Here:
$1,858
State:
$4,525
(% of AGI for various income ranges: 1.1% for AGIs below $25k, 0.8% for AGIs $25k-50k, 0.7% for AGIs $50k-75k, 1.0% for AGIs $75k-100k, 1.1% for AGIs $100k-200k)
Taxes paid: $8,040 (reported on 38.5% of returns)
60531:
$8,040
State:
$11,968
(% of AGI for various income ranges: 3.6% for AGIs below $25k, 4.7% for AGIs $25k-50k, 5.1% for AGIs $50k-75k, 6.6% for AGIs $75k-100k, 6.2% for AGIs $100k-200k)
Earned income credit: $1,864 (reported on 12.1% of returns)
Here:
$1,864
State:
$2,349
(% of AGI for various income ranges: 3.9% for AGIs below $25k, 0.8% for AGIs $25k-50k)
Percentage of individuals using paid preparers for their 2012 taxes: 59.3%
Here:
59%
State:
57%
(% for various income ranges: 51.5% for AGIs below $25k, 61.1% for AGIs $25k-50k, 64.3% for AGIs $50k-75k, 58.3% for AGIs $75k-100k, 71.4% for AGIs $100k-200k)
Averages for the 2004 tax year for zip code 60531, filed in 2005:
Average Adjusted Gross Income (AGI) in 2004: $44,304 (Individual Income Tax Returns)
Here:
$44,304
State:
$54,625
Salary/wage: $42,125 (reported on 83.8% of returns)
Here:
$42,125
State:
$46,811
(% of AGI for various income ranges: 120.5% for AGIs below $10k, 71.9% for AGIs $10k-25k, 73.6% for AGIs $25k-50k, 82.5% for AGIs $50k-75k, 86.3% for AGIs $75k-100k, 72.1% for AGIs over 100k)
Taxable interest for individuals: $1,410 (reported on 52.6% of returns)
This zip code:
$1,410
Illinois:
$2,101
(% of AGI for various income ranges: 9.9% for AGIs below $10k, 5.1% for AGIs $10k-25k, 2.6% for AGIs $25k-50k, 0.7% for AGIs $50k-75k, 0.9% for AGIs $75k-100k, 1.2% for AGIs over 100k)
Taxable dividends: $1,360 (reported on 24.5% of returns)
Here:
$1,360
State:
$4,306
(% of AGI for various income ranges: 3.7% for AGIs below $10k, 1.3% for AGIs $10k-25k, 1.2% for AGIs $25k-50k, 0.3% for AGIs $50k-75k, 0.6% for AGIs $75k-100k, 0.7% for AGIs over 100k)
Net capital gain/loss: +$8,885 (reported on 17.3% of returns)
Here:
+$8,885
State:
+$17,321
(% of AGI for various income ranges: 3.1% for AGIs below $10k, -0.2% for AGIs $10k-25k, 1.5% for AGIs $25k-50k, 1.3% for AGIs $50k-75k, 0.6% for AGIs $75k-100k, 14.2% for AGIs over 100k)
Profit/loss from business: +$5,986 (reported on 16.4% of returns)
Here:
+$5,986
State:
+$11,771
(% of AGI for various income ranges: 6.8% for AGIs below $10k, 2.8% for AGIs $10k-25k, 4.5% for AGIs $25k-50k, 3.2% for AGIs $50k-75k, 0.7% for AGIs $75k-100k)
Profit/loss from farming: +$1,712 (reported on 7.3% of returns)
Here:
+$1,712
State:
+$2,327
(% of AGI for various income ranges: -3.7% for AGIs below $10k, 2.5% for AGIs $25k-50k, 0.7% for AGIs $50k-75k, -1.2% for AGIs $75k-100k)
IRA payment deduction: $2,952 (reported on 2.3% of returns)
60531:
$2,952
Illinois:
$3,087
Total itemized deductions: $16,136 (24% of AGI, reported on 37.5% of returns)
Here:
$16,136
State:
$20,239
Here:
24.4% of AGI
State:
19.5% of AGI
(% of AGI for various income ranges: 22.1% for AGIs $10k-25k, 14.1% for AGIs $25k-50k, 12.9% for AGIs $50k-75k, 14.4% for AGIs $75k-100k, 10.6% for AGIs over 100k)
Charity contributions deductions: $1,593 (2% of AGI, reported on 30.4% of returns)
Here:
$1,593
State:
$3,719
Here:
2.3% of AGI
State:
3.4% of AGI
(% of AGI for various income ranges: 1.1% for AGIs $10k-25k, 1.2% for AGIs $25k-50k, 1.0% for AGIs $50k-75k, 1.0% for AGIs $75k-100k, 1.3% for AGIs over 100k)
Total tax: $5,309 (reported on 78.6% of returns)
60531:
$5,309
State:
$9,882
(% of AGI for various income ranges: 3.9% for AGIs below $10k, 4.4% for AGIs $10k-25k, 7.2% for AGIs $25k-50k, 8.7% for AGIs $50k-75k, 9.9% for AGIs $75k-100k, 14.4% for AGIs over 100k)
Earned income credit: $1,526 (reported on 8.6% of returns)
Here:
$1,526
State:
$1,788
Percentage of individuals using paid preparers for their 2004 taxes: 63.8%
Here:
64%
State:
61%
(% for various income ranges: 50.3% for AGIs below $10k, 66.8% for AGIs $10k-25k, 66.5% for AGIs $25k-50k, 66.3% for AGIs $50k-75k, 65.0% for AGIs $75k-100k, 74.1% for AGIs over 100k)
Likely homosexual households (counted as self-reported same-sex unmarried-partner households)
Lesbian couples: 0.2% of all households
Gay men: 0.0% of all households
Household received Food Stamps/SNAP in the past 12 months: 66 Household did not receive Food Stamps/SNAP in the past 12 months: 791
Women who had a birth in the past 12 months: 22 (13 now married, 8 unmarried) Women who did not have a birth in the past 12 months: 521 (226 now married, 294 unmarried)
Housing units in zip code 60531 with a mortgage: 397 (33 second mortgage, 27 both second mortgage and home equity loan) Houses without a mortgage: 12
Median monthly owner costs for units with a mortgage: $1,583 Median monthly owner costs for units without a mortgage: $826
Residents with income below the poverty level in 2022:
This zip code:
22.2%
Whole state:
11.9%
Residents with income below 50% of the poverty level in 2022:
This zip code:
5.7%
Whole state:
5.7%
Median number of rooms in houses and condos:
Here:
6.6
State:
6.4
Median number of rooms in apartments:
Here:
5.8
State:
4.1
Notable locations in this zip code not listed on our city pages
Notable locations in zip code 60531: Leland Fire Protection District Station 2 (A), Leland Fire Protection District Station 1 (B). Display/hide their locations on the map
Cemeteries: Baker Cemetery (1), Victor Cemetery (2), Little Indian Creek Cemetery (3), Northville Cemetery (4), Saint Clara Catholic Cemetery (5). Display/hide their locations on the map
Size of family households: 263 2-persons, 145 3-persons, 164 4-persons, 44 5-persons, 13 6-persons, 15 7-or-more-persons
Size of nonfamily households: 178 1-person, 35 2-persons
308 married couples with children.
181 single-parent households (54 men, 127 women).
94.6% of residents of 60531 zip code speak English at home.
2.6% of residents speak Spanish at home (75% very well, 22% well, 4% not well).
1.8% of residents speak other Indo-European language at home (77% very well, 23% well).
0.1% of residents speak other language at home (100% not well).
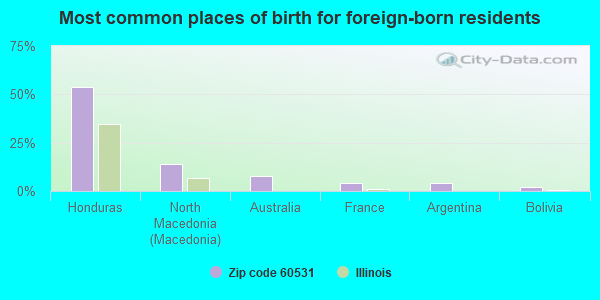
Foreign born population: 50 (2.2%) (40.2% of them are naturalized citizens)
This zip code:
2.2%
Whole state:
14.4%
54%Honduras
14%North Macedonia (Macedonia)
8%Australia
4%France
4%Argentina
2%Bolivia
23%German
12%American
9%Irish
8%Norwegian
4%English
4%French
4%Italian
Year of entry for the foreign-born population
82010 or later
132000 to 2009
141990 to 1999
26Before 1990
Facilities with environmental interests located in this zip code:
LELAND FARMERS CO (100 S MAIN ST in LELAND, IL)
STATE MASTER (Illinois EPA Project) - AIR PROGRAM AIR MINOR (AIRS/AFS) CRITERIA AND HAZARDOUS AIR POLLUTANT INVENTORY (Inventory of air pollution sources) Business SIC classification: GRAIN AND FIELD BEANS
KILLEN AIRCRAFT & AUTO (1091 BENSON RD in LELAND, IL)
STATE MASTER (Illinois EPA Project) - HAZARDOUS WASTE PROGRAM (Resource Conservation and Recovery Act (tracking hazardous waste)) Organizations: CORPORATION (CONTACT/OWNER)
LELAND STOCKDALE FERT INC (222 E LIN HWY in LELAND, IL)
STATE MASTER (Illinois EPA Project) - AIR PROGRAM AIR MINOR (AIRS/AFS) CRITERIA AND HAZARDOUS AIR POLLUTANT INVENTORY (Inventory of air pollution sources) Business SIC classification: FARM SUPPLIES; NONCLASSIFIABLE ESTABLISHMENTS
SAMPSON, LOWELL (400 LUNDY LANE in LELAND, IL)
STATE MASTER (Illinois EPA Project) - SOLID WASTE PROGRAM, SCRAP TIRE MANAGEMENT National Pollutant Discharge Elimination System NON-MAJOR (Tracking pollutant discharge elimination systems) - permit Organizations: SAMPSON, INC.?LOWELL (CONTACT/OWNER)
Alternative names: SAMPSON, INC.?LOWELL
LASALLE COUNTY FARM SUPPLY CO (RURAL in BAKER, IL)
STATE MASTER (Illinois EPA Project) - AIR PROGRAM AIR MINOR (AIRS/AFS) Business SIC classification: FARM SUPPLIES
RIGGS CONSTRUCTION (2041 NORTH 46 TH ROAD in LELAND, IL)
STATE MASTER (Illinois EPA Project) - AIR PROGRAM AIR MINOR (AIRS/AFS) Business SIC classification: NONCLASSIFIABLE ESTABLISHMENTS
LELAND HIGH SCHOOL (370 N MAIN in LELAND, IL)
(Geographic Names Information System) (National Center for Education Statistics) - STATE ID-3505000100001 Organizations: LELAND COMM UNIT SCH DIST 1 (SCHOOL DISTRICT)
LELAND ELEM SCHOOL (370 N MAIN in LELAND, IL)
(National Center for Education Statistics) - STATE ID-3505000102001 Organizations: LELAND COMM UNIT SCH DIST 1 (SCHOOL DISTRICT)
LASALLE COUNTY FARM SUPPLY CO. BAKER PLANT (1785 N 43RD RD in LELAND, IL)
(Resource Conservation and Recovery Act (tracking hazardous waste))
LELAND SCHOOLS (370 N MAIN ST in LELAND, IL)
AIR MINOR (AIRS/AFS) CRITERIA AND HAZARDOUS AIR POLLUTANT INVENTORY (Inventory of air pollution sources) Business SIC classification: ELEMENTARY AND SECONDARY SCHOOLS; NONCLASSIFIABLE ESTABLISHMENTS Alternative names: LELAND COMMUNITY UNIT SCH DIST #1
CLEARY TRUCKING (1915 E. U S RTE. 34 in LELAND, IL)
National Pollutant Discharge Elimination System NON-MAJOR (Tracking pollutant discharge elimination systems) - permit
LELAND STOCKDALE FERTILIZER (22 LINCOLN AVE in LELAND, IL)
COMPLIANCE ACTIVITY (Tracking inspections of insecticide, fungicide, and rodenticide, and toxic substances)
Housing units lacking complete plumbing facilities: 1.0% Housing units lacking complete kitchen facilities: 1.9%
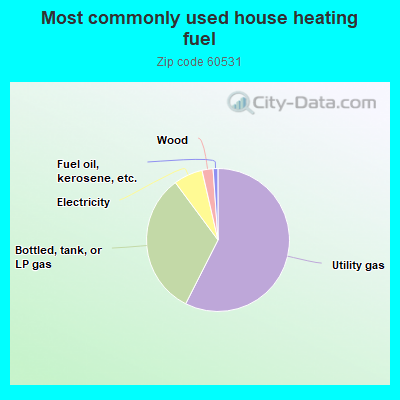
57.7%Utility gas
32.5%Bottled, tank, or LP gas
6.6%Electricity
2.5%Wood
1.1%Fuel oil, kerosene, etc.
Population in 1990: 1,601. Population change in the 1990s: +374 (+23.4%).
Place of birth for U.S.-born residents:
This state: 1,926
Northeast: 36
Midwest: 107
South: 62
West: 31
66% of the 60531 zip code residents lived in the same house 5 years ago. Out of people who lived in different houses, 35% lived in this county. Out of people who lived in different counties, 50% lived in Illinois.
92% of the 60531 zip code residents lived in the same house 1 year ago. Out of people who lived in different houses, 31% moved from this county. Out of people who lived in different houses, 54% moved from different county within same state. Out of people who lived in different houses, 14% moved from different state. Out of people who lived in different houses, 4% moved from abroad.
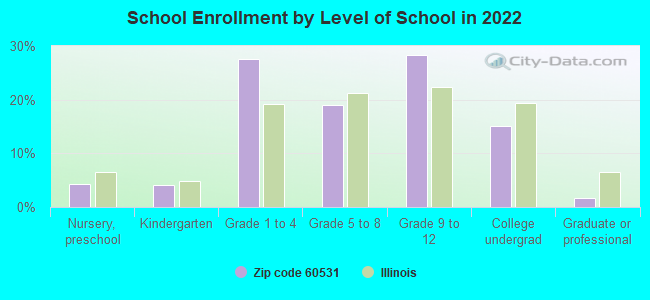
Private vs. public school enrollment:
Students in private schools in grades 1 to 8 (elementary and middle school): 31
Here:
11.4%
Illinois:
13.3%
Students in private schools in grades 9 to 12 (high school): 3
Here:
2.3%
Illinois:
9.9%
Students in private undergraduate colleges: 9
Here:
11.0%
Illinois:
27.4%
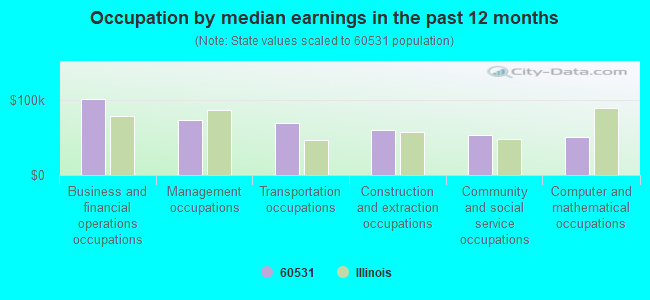
Occupation by median earnings in the past 12 months ($)
101,932Business and financial operations occupations
73,401Management occupations
70,356Transportation occupations
60,316Construction and extraction occupations
53,001Community and social service occupations
51,150Computer and mathematical occupations
Top industries in this zip code by the number of employees in 2005:
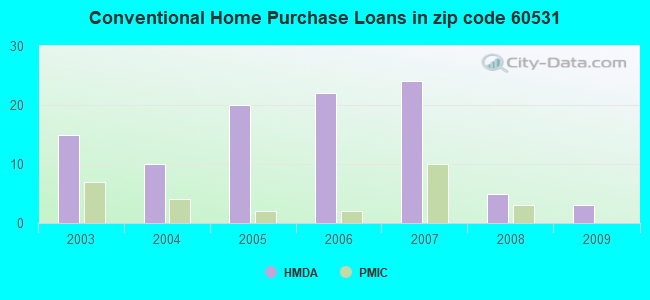
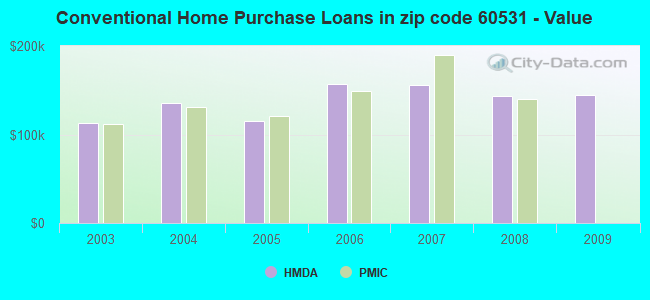
Detailed PMIC statistics for the following Tracts:0018.00
2002 - 2018 National Fire Incident Reporting System (NFIRS) incidents
According to the data from the years 2002 - 2018 the average number of fire incidents per year is 11. The highest number of reported fires - 22 took place in 2017, and the least - 3 in 2002. The data has an increasing trend.
When looking into fire subcategories, the most incidents belonged to: Structure Fires (52.7%), and Outside Fires (33.0%).
Fire incident types reported to NFIRS in Zip Code 60531


 Nearest zip codes: 60552, 60549, 60518, 60551, 60556, 60548.
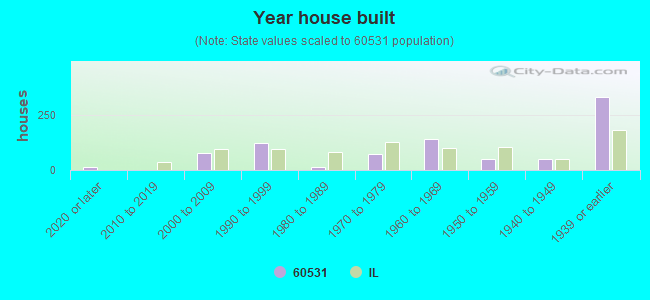


 According to the data from the years 2002 - 2018 the average number of fire incidents per year is 11. The highest number of reported fires - 22 took place in 2017, and the least - 3 in 2002. The data has an increasing trend.
 When looking into fire subcategories, the most incidents belonged to: Structure Fires (52.7%), and Outside Fires (33.0%).