Estimated zip code population in 2022: 401 Zip code population in 2010: 574 Zip code population in 2000: 561
Houses and condos: 175 Renter-occupied apartments: 4
% of renters here:
2%
State:
33%
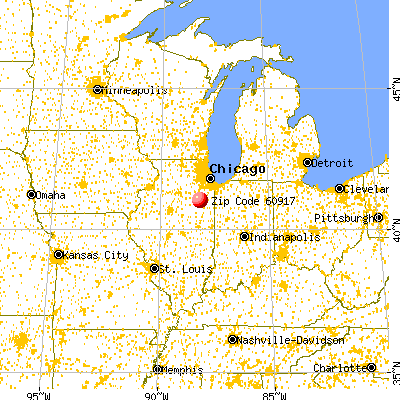
March 2022 cost of living index in zip code 60917: 92.3 (less than average, U.S. average is 100)
Land area: 37.0 sq. mi. Water area: 0.0 sq. mi.
Population density: 11 people per square mile
(very low).
OSM Map
General Map
Google Map
MSN Map
OSM Map
General Map
Google Map
MSN Map
OSM Map
General Map
Google Map
MSN Map
OSM Map
General Map
Google Map
MSN Map
Please wait while loading the map...
Real estate property taxes paid for housing units in 2022:
This zip code:
2.4% ($4,076)
Illinois:
2.0% ($4,912)
Median real estate property taxes paid for housing units with mortgages in 2022: $4,157 (2.4%) Median real estate property taxes paid for housing units with no mortgage in 2022: $2,695 (1.8%)
Business Search- 14 Million verified businesses
Males: 186
(46.5%)
Females: 214
(53.5%)
For population 25 years and over in 60917:
High school or higher: 81.3%
Bachelor's degree or higher: 21.7%
Graduate or professional degree: 8.4%
Unemployed: 1.1%
Mean travel time to work (commute): 30.0 minutes
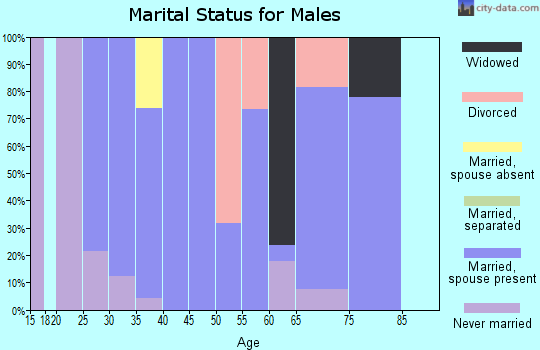
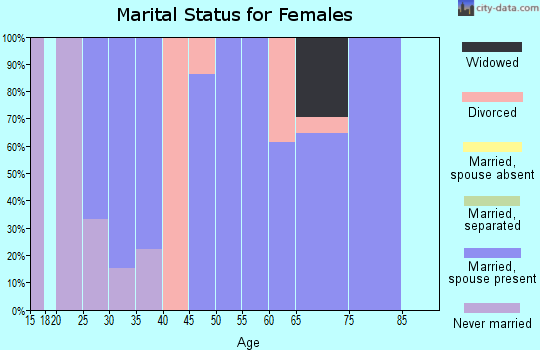
For population 15 years and over in 60917:
Never married: 14.8%
Now married: 63.7%
Separated: 0.3%
Widowed: 6.1%
Divorced: 15.1%
Zip code 60917 compared to state average:
Unemployed percentage significantly below state average.
Black race population percentage significantly below state average.
Hispanic race population percentage significantly below state average.
Median age significantly above state average.
Foreign-born population percentage significantly below state average.
Renting percentage significantly below state average.
Length of stay since moving in significantly above state average.
Number of college students significantly below state average.
Estimated median house/condo value in 2022: $173,416
60917:
$173,416
Illinois:
$251,600
According to our research of Illinois and other state lists, there was 1 registered sex offender living in 60917 zip code as of May 21, 2024. The ratio of all residents to sex offenders in zip code 60917 is 579 to 1.
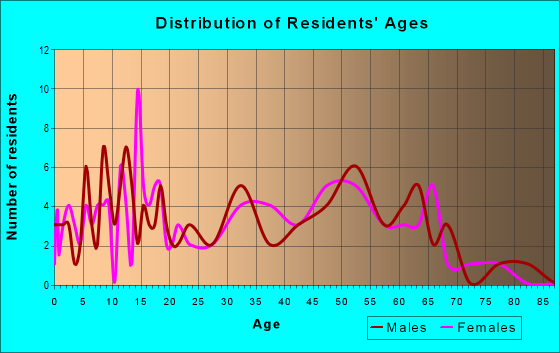
Median resident age:
This zip code:
47.4 years
Illinois median age:
39.1 years
Average household size:
This zip code:
2.4 people
Illinois:
2.4 people
Averages for the 2020 tax year for zip code 60917, filed in 2021:
Average Adjusted Gross Income (AGI) in 2020: $73,604 (Individual Income Tax Returns)
Here:
$73,604
State:
$82,626
Salary/wage: $57,905 (reported on 83.3% of returns)
Here:
$57,905
State:
$66,640
(% of AGI for various income ranges: 1248.0% for AGIs below $25k, 3437.5% for AGIs $25k-50k, 3610.0% for AGIs $50k-75k, 21216.7% for AGIs $100k-200k)
Taxable interest for individuals: $943 (reported on 29.2% of returns)
This zip code:
$943
Illinois:
$2,376
(% of AGI for various income ranges: 10.0% for AGIs below $25k, 35.0% for AGIs $50k-75k, 156.7% for AGIs $100k-200k)
Ordinary dividends: $2,775 (reported on 16.7% of returns)
Here:
$2,775
State:
$9,061
(% of AGI for various income ranges: 87.5% for AGIs $25k-50k, 253.3% for AGIs $100k-200k)
Net capital gain/loss in AGI: +$4,250 (reported on 16.7% of returns)
Here:
+$4,250
State:
+$31,684
(% of AGI for various income ranges: 566.7% for AGIs $100k-200k)
Profit/loss from business: +$6,550 (reported on 8.3% of returns)
Here:
+$6,550
State:
+$12,175
(% of AGI for various income ranges: 262.0% for AGIs below $25k)
Earned income credit: $2,000 (reported on 12.5% of returns)
Here:
$2,000
State:
$2,311
(% of AGI for various income ranges: 120.0% for AGIs below $25k)
Percentage of individuals using paid preparers for their 2020 taxes: 95.8%
Here:
96%
State:
93%
(% for various income ranges: 100.0% for AGIs below $25k, 100.0% for AGIs $25k-50k, 75.0% for AGIs $50k-75k, 100.0% for AGIs $75k-100k, 100.0% for AGIs $100k-200k)
Averages for the 2012 tax year for zip code 60917, filed in 2013:
Average Adjusted Gross Income (AGI) in 2012: $59,768 (Individual Income Tax Returns)
Here:
$59,768
State:
$68,058
Salary/wage: $49,035 (reported on 80.0% of returns)
Here:
$49,035
State:
$55,396
(% of AGI for various income ranges: 68.5% for AGIs below $25k, 73.2% for AGIs $25k-50k, 123.3% for AGIs $50k-75k, 56.0% for AGIs $100k-200k)
Taxable interest for individuals: $460 (reported on 40.0% of returns)
This zip code:
$460
Illinois:
$1,969
(% of AGI for various income ranges: 1.1% for AGIs below $25k, 0.5% for AGIs $50k-75k, 0.3% for AGIs $100k-200k)
Ordinary dividends: $940 (reported on 20.0% of returns)
Here:
$940
State:
$7,786
Net capital gain/loss in AGI: +$4,567 (reported on 12.0% of returns)
Here:
+$4,567
State:
+$22,183
Profit/loss from business: +$3,267 (reported on 12.0% of returns)
Here:
+$3,267
State:
+$12,903
Total itemized deductions: $17,814 (19% of AGI, reported on 28.0% of returns)
Here:
$17,814
State:
$26,433
Here:
18.9% of AGI
State:
19.2% of AGI
Charity contributions: $1,375 (reported on 16.0% of returns)
Here:
$1,375
State:
$4,525
Taxes paid: $6,957 (reported on 28.0% of returns)
60917:
$6,957
State:
$11,968
Earned income credit: $2,100 (reported on 16.0% of returns)
Here:
$2,100
State:
$2,349
(% of AGI for various income ranges: 7.8% for AGIs below $25k)
Percentage of individuals using paid preparers for their 2012 taxes: 76.0%
Here:
76%
State:
57%
(% for various income ranges: 66.7% for AGIs below $25k, 60.0% for AGIs $25k-50k, 120.0% for AGIs $50k-75k, 100.0% for AGIs $100k-200k)
Averages for the 2004 tax year for zip code 60917, filed in 2005:
Average Adjusted Gross Income (AGI) in 2004: $44,485 (Individual Income Tax Returns)
Here:
$44,485
State:
$54,625
Salary/wage: $40,414 (reported on 84.9% of returns)
Here:
$40,414
State:
$46,811
(% of AGI for various income ranges: 95.6% for AGIs below $10k, 74.3% for AGIs $10k-25k, 82.4% for AGIs $25k-50k, 77.5% for AGIs $50k-75k, 80.5% for AGIs $75k-100k, 69.6% for AGIs over 100k)
Taxable interest for individuals: $925 (reported on 61.5% of returns)
This zip code:
$925
Illinois:
$2,101
(% of AGI for various income ranges: 6.6% for AGIs below $10k, 3.0% for AGIs $10k-25k, 0.7% for AGIs $25k-50k, 1.7% for AGIs $50k-75k, 1.3% for AGIs $75k-100k, 0.6% for AGIs over 100k)
Taxable dividends: $935 (reported on 25.9% of returns)
Here:
$935
State:
$4,306
(% of AGI for various income ranges: 2.1% for AGIs $10k-25k, 0.4% for AGIs $25k-50k, 0.4% for AGIs $50k-75k, 0.7% for AGIs $75k-100k)
Net capital gain/loss: +$241 (reported on 12.1% of returns)
Here:
+$241
State:
+$17,321
Profit/loss from business: +$3,192 (reported on 10.9% of returns)
Here:
+$3,192
State:
+$11,771
Total itemized deductions: $12,593 (18% of AGI, reported on 24.7% of returns)
Here:
$12,593
State:
$20,239
Here:
18.3% of AGI
State:
19.5% of AGI
Charity contributions deductions: $1,304 (2% of AGI, reported on 19.2% of returns)
Here:
$1,304
State:
$3,719
Here:
1.7% of AGI
State:
3.4% of AGI
Total tax: $5,532 (reported on 78.7% of returns)
60917:
$5,532
State:
$9,882
(% of AGI for various income ranges: 4.1% for AGIs $10k-25k, 7.3% for AGIs $25k-50k, 8.8% for AGIs $50k-75k, 10.6% for AGIs $75k-100k, 14.8% for AGIs over 100k)
Earned income credit: $2,091 (reported on 9.2% of returns)
Here:
$2,091
State:
$1,788
Percentage of individuals using paid preparers for their 2004 taxes: 75.7%
Here:
76%
State:
61%
(% for various income ranges: 67.7% for AGIs below $10k, 69.0% for AGIs $10k-25k, 71.4% for AGIs $25k-50k, 85.0% for AGIs $50k-75k, 88.9% for AGIs $75k-100k, 85.0% for AGIs over 100k)
Household received Food Stamps/SNAP in the past 12 months: 4 Household did not receive Food Stamps/SNAP in the past 12 months: 162
Women who did not have a birth in the past 12 months: 70 (47 now married, 22 unmarried)
Housing units in zip code 60917 with a mortgage: 111 (4 second mortgage, 4 both second mortgage and home equity loan) Median monthly owner costs for units with a mortgage: $1,540 Median monthly owner costs for units without a mortgage: $582
Residents with income below the poverty level in 2022:
This zip code:
1.8%
Whole state:
11.9%
Residents with income below 50% of the poverty level in 2022:
This zip code:
0.7%
Whole state:
5.7%
Median number of rooms in houses and condos:
Here:
6.8
State:
6.4
Median number of rooms in apartments:
Here:
4.9
State:
4.1
Notable locations in this zip code not listed on our city pages
Size of family households: 90 2-persons, 21 3-persons, 23 4-persons, 5 5-persons
Size of nonfamily households: 28 1-person, 1 2-persons
21 married couples with children.
22 single-parent households (1 men, 21 women).
99.5% of residents of 60917 zip code speak English at home.
Foreign born population: 0 (0.0%)
:
0.0%
Whole state:
14.4%
35%German
30%American
3%English
1%Irish
1%French Canadian
Facilities with environmental interests located in this zip code:
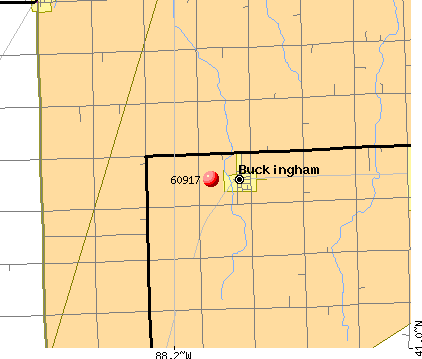
JORDAN OIL SERVICE (5 S RAILROAD STREET & 1 WILLOW in BUCKINGHAM, IL)
STATE MASTER (Illinois EPA Project) - AIR PROGRAM AIR MINOR (AIRS/AFS) Business SIC classification: PETROLEUM BULK STATIONS AND TERMINALS
KANKAKEE SERVICE CO (RURAL in BUCKINGHAM, IL)
STATE MASTER (Illinois EPA Project) - AIR PROGRAM AIR MINOR (AIRS/AFS) Business SIC classification: BOOKS, PERIODICALS, AND NEWSPAPERS
KANKAKEE SERVICE CO (1MI S OF RTE 115 ON WALNUT ST in BUCKINGHAM, IL)
(Resource Conservation and Recovery Act (tracking hazardous waste))
Housing units lacking complete plumbing facilities: 3.7% Housing units lacking complete kitchen facilities: 3.8%
63.6%Utility gas
27.9%Electricity
5.5%Fuel oil, kerosene, etc.
4.2%Bottled, tank, or LP gas
Population in 1990: 557. Population change in the 1990s: +4 (+0.7%).
Place of birth for U.S.-born residents:
This state: 386
Northeast: 8
Midwest: 1
South: 2
West: 1
81% of the 60917 zip code residents lived in the same house 5 years ago. Out of people who lived in different houses, 52% lived in this county.
99% of the 60917 zip code residents lived in the same house 1 year ago. Out of people who lived in different houses, 50% moved from this county. Out of people who lived in different houses, 50% moved from different state.
Private vs. public school enrollment:
Students in private schools in grades 1 to 8 (elementary and middle school):
Here:
0.0%
Illinois:
13.3%
Students in private schools in grades 9 to 12 (high school):
Here:
0.0%
Illinois:
9.9%
Students in private undergraduate colleges:
Here:
0.0%
Illinois:
27.4%
Occupation by median earnings in the past 12 months ($)
115,072Business and financial operations occupations
89,448Fire fighting and prevention, and other protective service workers including supervisors
76,992Transportation occupations
76,092Health diagnosing and treating practitioners and other technical occupations
50,669Office and administrative support occupations
46,067Sales and related occupations
Top industries in this zip code by the number of employees in 2005:
Construction: Poured Concrete Foundation and Structure Contractors (10-19 employees: 1 establishment)
Construction: Electrical Contractors (1-4: 1)
Arts, Entertainment, and Recreation: Fitness and Recreational Sports Centers (1-4: 1)
Fatal accident statistics in 2014:
Fatal accident count: 1
Vehicles involved in fatal accidents: 1
Fatal accidents caused by drunken drivers: 1
Fatalities: 1
Persons involved in fatal accidents: 2
Pedestrians involved in fatal accidents: 0
Home Mortgage Disclosure Act Aggregated Statistics For Year 2009 (Based on 2 partial tracts)
A) FHA, FSA/RHS & VA Home Purchase Loans
B) Conventional Home Purchase Loans
C) Refinancings
D) Home Improvement Loans
F) Non-occupant Loans on < 5 Family Dwellings (A B C & D)
Number
Average Value
Number
Average Value
Number
Average Value
Number
Average Value
Number
Average Value
LOANS ORIGINATED
4
$121,132
8
$137,699
53
$160,583
5
$50,778
5
$156,426
APPLICATIONS APPROVED, NOT ACCEPTED
0
$0
0
$0
3
$207,237
1
$81,380
0
$0
APPLICATIONS DENIED
0
$0
2
$156,010
16
$143,889
1
$79,980
1
$85,560
APPLICATIONS WITHDRAWN
0
$0
0
$0
10
$165,819
0
$0
0
$0
FILES CLOSED FOR INCOMPLETENESS
1
$88,810
0
$0
2
$162,750
0
$0
0
$0
Aggregated Statistics For Year 2008 (Based on 2 partial tracts)
A) FHA, FSA/RHS & VA Home Purchase Loans
B) Conventional Home Purchase Loans
C) Refinancings
D) Home Improvement Loans
F) Non-occupant Loans on < 5 Family Dwellings (A B C & D)
G) Loans On Manufactured Home Dwelling (A B C & D)
Number
Average Value
Number
Average Value
Number
Average Value
Number
Average Value
Number
Average Value
Number
Average Value
LOANS ORIGINATED
1
$199,490
9
$166,160
31
$158,685
7
$53,940
1
$165,080
1
$68,820
APPLICATIONS APPROVED, NOT ACCEPTED
0
$0
0
$0
3
$165,230
1
$53,940
0
$0
0
$0
APPLICATIONS DENIED
1
$126,950
1
$108,350
10
$186,977
1
$6,980
1
$427,340
0
$0
APPLICATIONS WITHDRAWN
0
$0
2
$168,565
9
$168,072
1
$109,740
0
$0
0
$0
FILES CLOSED FOR INCOMPLETENESS
0
$0
0
$0
1
$180,890
0
$0
0
$0
0
$0
Aggregated Statistics For Year 2007 (Based on 2 partial tracts)
A) FHA, FSA/RHS & VA Home Purchase Loans
B) Conventional Home Purchase Loans
C) Refinancings
D) Home Improvement Loans
F) Non-occupant Loans on < 5 Family Dwellings (A B C & D)
G) Loans On Manufactured Home Dwelling (A B C & D)
Number
Average Value
Number
Average Value
Number
Average Value
Number
Average Value
Number
Average Value
Number
Average Value
LOANS ORIGINATED
2
$97,185
19
$145,325
35
$153,158
5
$60,636
4
$124,272
0
$0
APPLICATIONS APPROVED, NOT ACCEPTED
0
$0
0
$0
6
$146,708
1
$104,160
0
$0
0
$0
APPLICATIONS DENIED
0
$0
3
$68,667
16
$135,344
5
$49,012
0
$0
3
$61,847
APPLICATIONS WITHDRAWN
0
$0
1
$142,290
6
$143,995
0
$0
0
$0
0
$0
FILES CLOSED FOR INCOMPLETENESS
0
$0
0
$0
0
$0
0
$0
0
$0
0
$0
Aggregated Statistics For Year 2006 (Based on 2 partial tracts)
A) FHA, FSA/RHS & VA Home Purchase Loans
B) Conventional Home Purchase Loans
C) Refinancings
D) Home Improvement Loans
F) Non-occupant Loans on < 5 Family Dwellings (A B C & D)
Number
Average Value
Number
Average Value
Number
Average Value
Number
Average Value
Number
Average Value
LOANS ORIGINATED
2
$121,830
24
$138,822
28
$125,151
5
$51,244
1
$108,350
APPLICATIONS APPROVED, NOT ACCEPTED
0
$0
4
$116,600
5
$106,300
0
$0
0
$0
APPLICATIONS DENIED
0
$0
6
$137,563
14
$145,246
5
$41,572
1
$64,640
APPLICATIONS WITHDRAWN
0
$0
2
$131,130
9
$139,603
0
$0
0
$0
FILES CLOSED FOR INCOMPLETENESS
0
$0
1
$110,210
3
$133,767
0
$0
0
$0
Aggregated Statistics For Year 2005 (Based on 2 partial tracts)
A) FHA, FSA/RHS & VA Home Purchase Loans
B) Conventional Home Purchase Loans
C) Refinancings
D) Home Improvement Loans
F) Non-occupant Loans on < 5 Family Dwellings (A B C & D)
Number
Average Value
Number
Average Value
Number
Average Value
Number
Average Value
Number
Average Value
LOANS ORIGINATED
1
$81,840
20
$147,568
33
$140,303
5
$53,662
3
$93,620
APPLICATIONS APPROVED, NOT ACCEPTED
0
$0
1
$130,200
7
$125,086
1
$27,900
0
$0
APPLICATIONS DENIED
0
$0
3
$99,510
29
$130,392
4
$46,268
0
$0
APPLICATIONS WITHDRAWN
0
$0
1
$41,390
11
$118,068
0
$0
0
$0
FILES CLOSED FOR INCOMPLETENESS
0
$0
1
$184,610
8
$119,389
0
$0
0
$0
Aggregated Statistics For Year 2004 (Based on 2 partial tracts)
A) FHA, FSA/RHS & VA Home Purchase Loans
B) Conventional Home Purchase Loans
C) Refinancings
D) Home Improvement Loans
F) Non-occupant Loans on < 5 Family Dwellings (A B C & D)
G) Loans On Manufactured Home Dwelling (A B C & D)
Number
Average Value
Number
Average Value
Number
Average Value
Number
Average Value
Number
Average Value
Number
Average Value
LOANS ORIGINATED
2
$148,335
20
$135,013
40
$115,413
4
$31,040
3
$59,057
2
$56,035
APPLICATIONS APPROVED, NOT ACCEPTED
0
$0
3
$119,040
5
$116,528
1
$5,580
0
$0
0
$0
APPLICATIONS DENIED
0
$0
9
$102,817
27
$113,460
1
$28,830
2
$90,910
2
$55,800
APPLICATIONS WITHDRAWN
0
$0
3
$133,147
13
$118,539
1
$72,540
0
$0
0
$0
FILES CLOSED FOR INCOMPLETENESS
0
$0
1
$88,810
6
$181,815
0
$0
0
$0
0
$0
Aggregated Statistics For Year 2003 (Based on 2 partial tracts)
A) FHA, FSA/RHS & VA Home Purchase Loans
B) Conventional Home Purchase Loans
C) Refinancings
D) Home Improvement Loans
F) Non-occupant Loans on < 5 Family Dwellings (A B C & D)
Number
Average Value
Number
Average Value
Number
Average Value
Number
Average Value
Number
Average Value
LOANS ORIGINATED
1
$170,660
18
$121,313
93
$121,170
3
$45,107
6
$71,300
APPLICATIONS APPROVED, NOT ACCEPTED
0
$0
2
$106,720
9
$115,837
0
$0
0
$0
APPLICATIONS DENIED
0
$0
3
$83,547
24
$122,741
1
$13,950
0
$0
APPLICATIONS WITHDRAWN
1
$123,690
1
$288,300
9
$134,799
0
$0
0
$0
FILES CLOSED FOR INCOMPLETENESS
0
$0
0
$0
1
$153,450
0
$0
0
$0
Aggregated Statistics For Year 2002 (Based on 2 partial tracts)
A) FHA, FSA/RHS & VA Home Purchase Loans
B) Conventional Home Purchase Loans
C) Refinancings
D) Home Improvement Loans
F) Non-occupant Loans on < 5 Family Dwellings (A B C & D)
Number
Average Value
Number
Average Value
Number
Average Value
Number
Average Value
Number
Average Value
LOANS ORIGINATED
3
$105,247
12
$120,512
60
$103,904
4
$27,320
5
$86,770
APPLICATIONS APPROVED, NOT ACCEPTED
0
$0
2
$79,750
7
$98,314
1
$17,210
0
$0
APPLICATIONS DENIED
0
$0
1
$91,610
16
$98,551
3
$18,757
0
$0
APPLICATIONS WITHDRAWN
0
$0
3
$93,773
5
$116,436
1
$53,940
0
$0
FILES CLOSED FOR INCOMPLETENESS
0
$0
0
$0
5
$97,278
0
$0
0
$0
Aggregated Statistics For Year 2001 (Based on 2 partial tracts)
A) FHA, FSA/RHS & VA Home Purchase Loans
B) Conventional Home Purchase Loans
C) Refinancings
D) Home Improvement Loans
F) Non-occupant Loans on < 5 Family Dwellings (A B C & D)
Number
Average Value
Number
Average Value
Number
Average Value
Number
Average Value
Number
Average Value
LOANS ORIGINATED
3
$99,043
21
$92,624
57
$95,105
8
$24,006
6
$63,938
APPLICATIONS APPROVED, NOT ACCEPTED
0
$0
4
$106,718
6
$75,950
1
$67,420
0
$0
APPLICATIONS DENIED
0
$0
5
$65,566
20
$66,820
4
$16,275
0
$0
APPLICATIONS WITHDRAWN
0
$0
2
$108,345
7
$69,950
0
$0
1
$50,220
FILES CLOSED FOR INCOMPLETENESS
0
$0
0
$0
1
$66,030
0
$0
0
$0
Aggregated Statistics For Year 2000 (Based on 2 partial tracts)
A) FHA, FSA/RHS & VA Home Purchase Loans
B) Conventional Home Purchase Loans
C) Refinancings
D) Home Improvement Loans
F) Non-occupant Loans on < 5 Family Dwellings (A B C & D)
Number
Average Value
Number
Average Value
Number
Average Value
Number
Average Value
Number
Average Value
LOANS ORIGINATED
0
$0
22
$94,395
19
$82,012
4
$30,110
1
$55,340
APPLICATIONS APPROVED, NOT ACCEPTED
0
$0
2
$71,610
3
$119,040
3
$14,260
0
$0
APPLICATIONS DENIED
1
$69,750
9
$68,974
12
$70,254
3
$9,767
0
$0
APPLICATIONS WITHDRAWN
0
$0
2
$109,740
4
$88,582
0
$0
0
$0
FILES CLOSED FOR INCOMPLETENESS
1
$78,120
1
$96,260
2
$77,655
0
$0
0
$0
Aggregated Statistics For Year 1999 (Based on 1 partial tract)
A) FHA, FSA/RHS & VA Home Purchase Loans
B) Conventional Home Purchase Loans
C) Refinancings
D) Home Improvement Loans
F) Non-occupant Loans on < 5 Family Dwellings (A B C & D)


 Nearest zip codes: 60961, 60969, 60919, 60941, 60920, 60935.