Estimated zip code population in 2022: 1,218 Zip code population in 2010: 1,064 Zip code population in 2000: 846
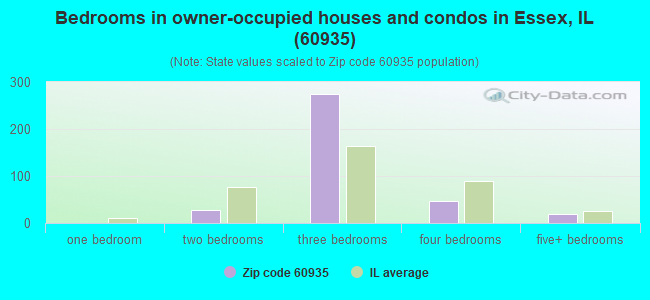
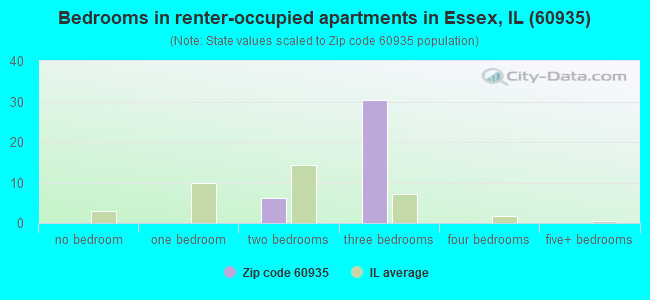
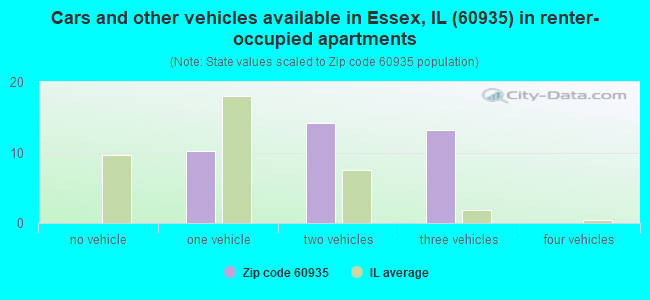
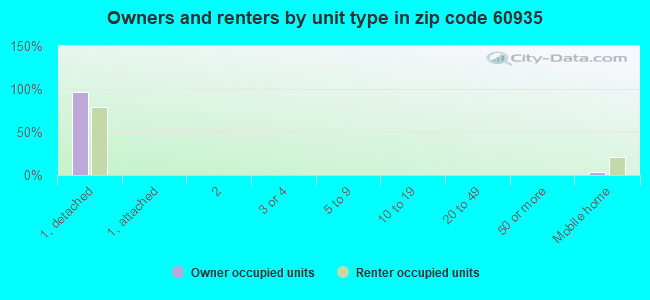
Houses and condos: 455 Renter-occupied apartments: 38
% of renters here:
9%
State:
33%
March 2022 cost of living index in zip code 60935: 93.5 (less than average, U.S. average is 100)
Land area: 18.9 sq. mi. Water area: 0.4 sq. mi.
Population density: 64 people per square mile
(very low).
OSM Map
General Map
Google Map
MSN Map
OSM Map
General Map
Google Map
MSN Map
OSM Map
General Map
Google Map
MSN Map
OSM Map
General Map
Google Map
MSN Map
Please wait while loading the map...
Real estate property taxes paid for housing units in 2022:
This zip code:
1.7% ($4,047)
Illinois:
2.0% ($4,912)
Median real estate property taxes paid for housing units with mortgages in 2022: $4,005 (1.7%) Median real estate property taxes paid for housing units with no mortgage in 2022: $3,900 (1.6%)
Business Search- 14 Million verified businesses
Males: 556
(45.7%)
Females: 661
(54.3%)
For population 25 years and over in 60935:
High school or higher: 95.4%
Bachelor's degree or higher: 20.6%
Graduate or professional degree: 7.2%
Unemployed: 1.2%
Mean travel time to work (commute): 33.6 minutes
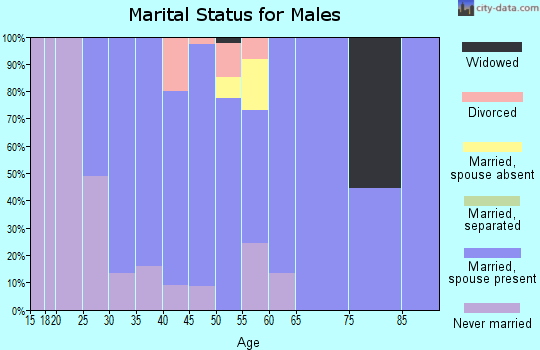
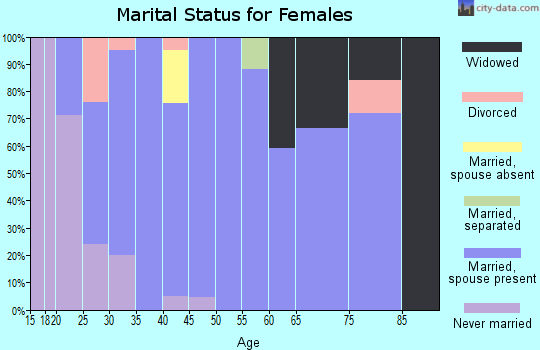
For population 15 years and over in 60935:
Never married: 26.2%
Now married: 56.2%
Separated: 0.0%
Widowed: 3.3%
Divorced: 14.3%
Zip code 60935 compared to state average:
Unemployed percentage significantly below state average.
Black race population percentage significantly below state average.
Median age below state average.
Foreign-born population percentage significantly below state average.
Renting percentage significantly below state average.
Length of stay since moving in above state average.
House age below state average.
Number of college students below state average.
Percentage of population with a bachelor's degree or higher below state average.
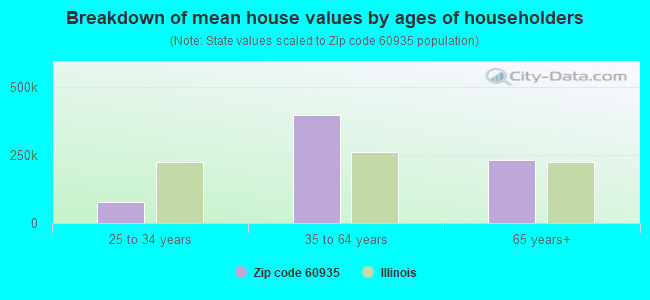
Estimated median house/condo value in 2022: $242,761
60935:
$242,761
Illinois:
$251,600
According to our research of Illinois and other state lists, there was 1 registered sex offender living in 60935 zip code as of May 21, 2024. The ratio of all residents to sex offenders in zip code 60935 is 1,122 to 1. The ratio of registered sex offenders to all residents in this zip code is lower than the state average.
Median resident age:
This zip code:
32.3 years
Illinois median age:
39.1 years
Average household size:
This zip code:
3.0 people
Illinois:
2.4 people
Averages for the 2020 tax year for zip code 60935, filed in 2021:
Average Adjusted Gross Income (AGI) in 2020: $74,119 (Individual Income Tax Returns)
Here:
$74,119
State:
$82,626
Salary/wage: $66,347 (reported on 79.6% of returns)
Here:
$66,347
State:
$66,640
(% of AGI for various income ranges: 862.7% for AGIs below $25k, 2874.3% for AGIs $25k-50k, 4495.0% for AGIs $50k-75k, 9847.5% for AGIs $75k-100k, 13684.0% for AGIs $100k-200k)
Taxable interest for individuals: $664 (reported on 25.9% of returns)
This zip code:
$664
Illinois:
$2,376
(% of AGI for various income ranges: 31.8% for AGIs below $25k, 20.0% for AGIs $50k-75k, 42.0% for AGIs $100k-200k)
Ordinary dividends: $1,762 (reported on 14.8% of returns)
Here:
$1,762
State:
$9,061
(% of AGI for various income ranges: 20.0% for AGIs below $25k, 61.4% for AGIs $25k-50k, 76.0% for AGIs $100k-200k)
Net capital gain/loss in AGI: +$3,712 (reported on 14.8% of returns)
Here:
+$3,712
State:
+$31,684
(% of AGI for various income ranges: 7.3% for AGIs below $25k, 150.0% for AGIs $50k-75k, 169.0% for AGIs $100k-200k)
Profit/loss from business: +$3,850 (reported on 11.1% of returns)
Here:
+$3,850
State:
+$12,175
(% of AGI for various income ranges: 200.9% for AGIs below $25k, 25.0% for AGIs $75k-100k)
Taxable individual retirement arrangement distribution: $29,214 (reported on 13.0% of returns)
60935:
$29,214
Illinois:
$21,613
(% of AGI for various income ranges: 737.5% for AGIs $50k-75k, 1455.0% for AGIs $100k-200k)
Earned income credit: $2,725 (reported on 7.4% of returns)
Here:
$2,725
State:
$2,311
(% of AGI for various income ranges: 99.1% for AGIs below $25k)
Percentage of individuals using paid preparers for their 2020 taxes: 94.4%
Here:
94%
State:
93%
(% for various income ranges: 92.9% for AGIs below $25k, 87.5% for AGIs $25k-50k, 100.0% for AGIs $50k-75k, 85.7% for AGIs $75k-100k, 100.0% for AGIs $100k-200k, 100.0% for AGIs over 200k)
Averages for the 2012 tax year for zip code 60935, filed in 2013:
Average Adjusted Gross Income (AGI) in 2012: $62,947 (Individual Income Tax Returns)
Here:
$62,947
State:
$68,058
Salary/wage: $53,121 (reported on 87.8% of returns)
Here:
$53,121
State:
$55,396
(% of AGI for various income ranges: 65.3% for AGIs below $25k, 75.8% for AGIs $25k-50k, 74.2% for AGIs $50k-75k, 77.8% for AGIs $75k-100k, 73.2% for AGIs $100k-200k)
Taxable interest for individuals: $394 (reported on 32.7% of returns)
This zip code:
$394
Illinois:
$1,969
(% of AGI for various income ranges: 0.3% for AGIs below $25k, 0.4% for AGIs $25k-50k, 0.5% for AGIs $50k-75k, 0.1% for AGIs $75k-100k)
Ordinary dividends: $1,162 (reported on 16.3% of returns)
Here:
$1,162
State:
$7,786
(% of AGI for various income ranges: 1.7% for AGIs below $25k, 0.8% for AGIs $50k-75k, 0.2% for AGIs $100k-200k)
Net capital gain/loss in AGI: +$100 (reported on 8.2% of returns)
Here:
+$100
State:
+$22,183
Profit/loss from business: +$6,320 (reported on 10.2% of returns)
Here:
+$6,320
State:
+$12,903
Taxable individual retirement arrangement distribution: $10,275 (reported on 8.2% of returns)
60935:
$10,275
Illinois:
$17,929
Total itemized deductions: $20,630 (22% of AGI, reported on 40.8% of returns)
Here:
$20,630
State:
$26,433
Here:
21.6% of AGI
State:
19.2% of AGI
(% of AGI for various income ranges: 14.0% for AGIs $25k-50k, 13.0% for AGIs $50k-75k, 16.4% for AGIs $75k-100k, 13.7% for AGIs $100k-200k)
Charity contributions: $1,533 (reported on 30.6% of returns)
Here:
$1,533
State:
$4,525
(% of AGI for various income ranges: 0.7% for AGIs $25k-50k, 0.8% for AGIs $50k-75k, 1.0% for AGIs $75k-100k, 0.7% for AGIs $100k-200k)
Taxes paid: $8,210 (reported on 40.8% of returns)
60935:
$8,210
State:
$11,968
(% of AGI for various income ranges: 4.7% for AGIs $25k-50k, 4.9% for AGIs $50k-75k, 5.7% for AGIs $75k-100k, 6.1% for AGIs $100k-200k)
Earned income credit: $2,120 (reported on 10.2% of returns)
Here:
$2,120
State:
$2,349
(% of AGI for various income ranges: 5.7% for AGIs below $25k)
Percentage of individuals using paid preparers for their 2012 taxes: 69.4%
Here:
69%
State:
57%
(% for various income ranges: 62.5% for AGIs below $25k, 66.7% for AGIs $25k-50k, 71.4% for AGIs $50k-75k, 71.4% for AGIs $75k-100k, 80.0% for AGIs $100k-200k)
Averages for the 2004 tax year for zip code 60935, filed in 2005:
Average Adjusted Gross Income (AGI) in 2004: $47,029 (Individual Income Tax Returns)
Here:
$47,029
State:
$54,625
Salary/wage: $43,997 (reported on 84.6% of returns)
Here:
$43,997
State:
$46,811
(% of AGI for various income ranges: 75.7% for AGIs below $10k, 55.9% for AGIs $10k-25k, 72.8% for AGIs $25k-50k, 87.1% for AGIs $50k-75k, 85.2% for AGIs $75k-100k, 76.9% for AGIs over 100k)
Taxable interest for individuals: $1,155 (reported on 51.9% of returns)
This zip code:
$1,155
Illinois:
$2,101
(% of AGI for various income ranges: 9.4% for AGIs below $10k, 5.4% for AGIs $10k-25k, 2.5% for AGIs $25k-50k, 0.6% for AGIs $50k-75k, 0.3% for AGIs $75k-100k, 0.3% for AGIs over 100k)
Taxable dividends: $879 (reported on 20.3% of returns)
Here:
$879
State:
$4,306
(% of AGI for various income ranges: 0.4% for AGIs $10k-25k, 0.7% for AGIs $25k-50k, 0.2% for AGIs $50k-75k, 0.4% for AGIs $75k-100k, 0.3% for AGIs over 100k)
Net capital gain/loss: +$268 (reported on 12.5% of returns)
Here:
+$268
State:
+$17,321
(% of AGI for various income ranges: -1.2% for AGIs $10k-25k, -0.1% for AGIs $25k-50k, 0.8% for AGIs $50k-75k, -0.1% for AGIs over 100k)
Profit/loss from business: +$184 (reported on 8.5% of returns)
Here:
+$184
State:
+$11,771
(% of AGI for various income ranges: 0.5% for AGIs $10k-25k, -0.1% for AGIs $50k-75k, 0.1% for AGIs $75k-100k)
Total itemized deductions: $16,221 (21% of AGI, reported on 34.3% of returns)
Here:
$16,221
State:
$20,239
Here:
21.3% of AGI
State:
19.5% of AGI
(% of AGI for various income ranges: 12.6% for AGIs $10k-25k, 9.0% for AGIs $25k-50k, 12.3% for AGIs $50k-75k, 14.1% for AGIs $75k-100k, 12.2% for AGIs over 100k)
Charity contributions deductions: $2,040 (3% of AGI, reported on 27.8% of returns)
Here:
$2,040
State:
$3,719
Here:
2.5% of AGI
State:
3.4% of AGI
(% of AGI for various income ranges: 0.7% for AGIs $25k-50k, 1.0% for AGIs $50k-75k, 1.5% for AGIs $75k-100k, 1.9% for AGIs over 100k)
Total tax: $5,769 (reported on 79.1% of returns)
60935:
$5,769
State:
$9,882
(% of AGI for various income ranges: 2.0% for AGIs below $10k, 3.4% for AGIs $10k-25k, 6.7% for AGIs $25k-50k, 8.1% for AGIs $50k-75k, 10.0% for AGIs $75k-100k, 15.0% for AGIs over 100k)
Earned income credit: $1,167 (reported on 8.0% of returns)
Here:
$1,167
State:
$1,788
Percentage of individuals using paid preparers for their 2004 taxes: 69.7%
Here:
70%
State:
61%
(% for various income ranges: 58.6% for AGIs below $10k, 77.8% for AGIs $10k-25k, 72.4% for AGIs $25k-50k, 67.8% for AGIs $50k-75k, 69.4% for AGIs $75k-100k, 75.0% for AGIs over 100k)
Household received Food Stamps/SNAP in the past 12 months: 10 Household did not receive Food Stamps/SNAP in the past 12 months: 389
Women who had a birth in the past 12 months: 57 (14 now married, 43 unmarried) Women who did not have a birth in the past 12 months: 291 (161 now married, 128 unmarried)
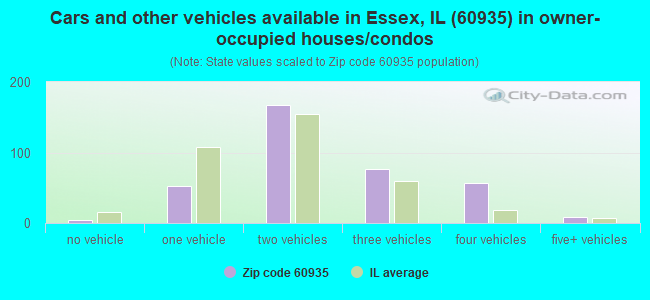
Housing units in zip code 60935 with a mortgage: 277 (11 second mortgage, 2 home equity loan, 7 both second mortgage and home equity loan) Houses without a mortgage: 11
Median monthly owner costs for units with a mortgage: $1,643 Median monthly owner costs for units without a mortgage: $697
Residents with income below the poverty level in 2022:
This zip code:
3.4%
Whole state:
11.9%
Residents with income below 50% of the poverty level in 2022:
This zip code:
1.5%
Whole state:
5.7%
Median number of rooms in houses and condos:
Here:
6.3
State:
6.4
Median number of rooms in apartments:
Here:
5.4
State:
4.1
Notable locations in this zip code not listed on our city pages
Size of family households: 93 2-persons, 86 3-persons, 57 4-persons, 41 5-persons, 13 6-persons, 2 7-or-more-persons
Size of nonfamily households: 101 1-person, 5 2-persons
289 married couples with children.
57 single-parent households (47 men, 10 women).
93.1% of residents of 60935 zip code speak English at home.
5.7% of residents speak Spanish at home (84% very well, 16% well).
0.4% of residents speak other Indo-European language at home (100% very well).
Foreign born population: 9 (0.8%) (0.0% of them are naturalized citizens)
:
0.8%
Whole state:
14.4%
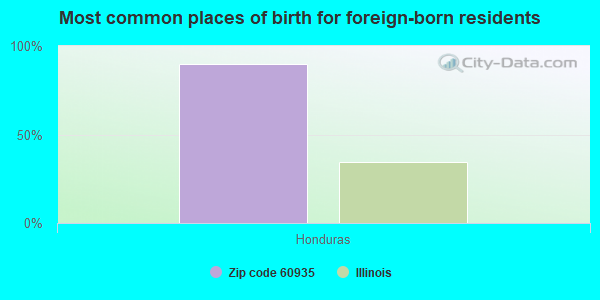
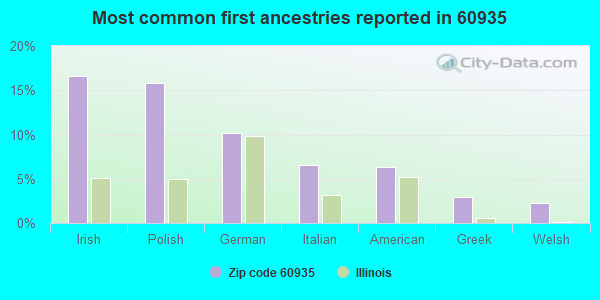
90%Honduras
17%Irish
16%Polish
10%German
7%Italian
6%American
3%Greek
2%Welsh
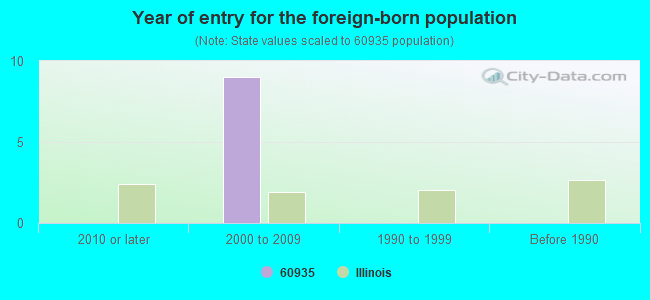
Year of entry for the foreign-born population
02010 or later
92000 to 2009
01990 to 1999
0Before 1990
Facilities with environmental interests located in this zip code:
ESSEX STP (219 WEST MAIN STREET in ESSEX, IL)
STATE MASTER (Illinois EPA Project) - National Pollutant Discharge Elimination System Permit National Pollutant Discharge Elimination System NON-MAJOR (Tracking pollutant discharge elimination systems) - permit Business SIC classification: SEWERAGE SYSTEMS Alternative names: ESSEX STP, VILLAGE OF
Housing units lacking complete plumbing facilities: 1.6% Housing units lacking complete kitchen facilities: 3.8%
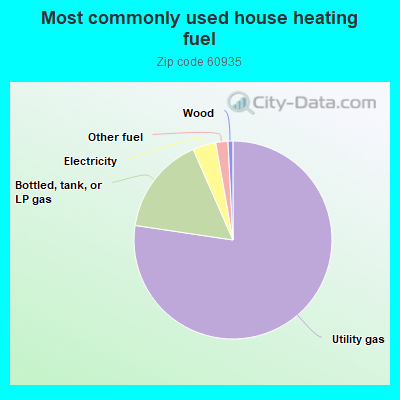
77.6%Utility gas
16.1%Bottled, tank, or LP gas
3.8%Electricity
2.0%Other fuel
0.8%Wood
Population in 1990: 994.
Place of birth for U.S.-born residents:
This state: 1,056
Northeast: 4
Midwest: 64
South: 57
West: 19
66% of the 60935 zip code residents lived in the same house 5 years ago. Out of people who lived in different houses, 19% lived in this county. Out of people who lived in different counties, 50% lived in Illinois.
95% of the 60935 zip code residents lived in the same house 1 year ago. Out of people who lived in different houses, 29% moved from this county. Out of people who lived in different houses, 71% moved from different county within same state.
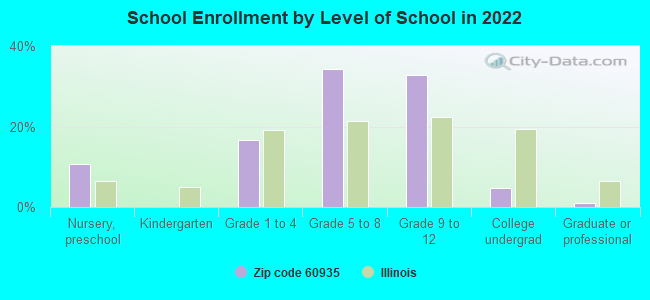
Private vs. public school enrollment:
Students in private schools in grades 1 to 8 (elementary and middle school): 9
Here:
5.9%
Illinois:
13.3%
Students in private schools in grades 9 to 12 (high school): 12
Here:
12.6%
Illinois:
9.9%
Students in private undergraduate colleges:
Here:
0.0%
Illinois:
27.4%
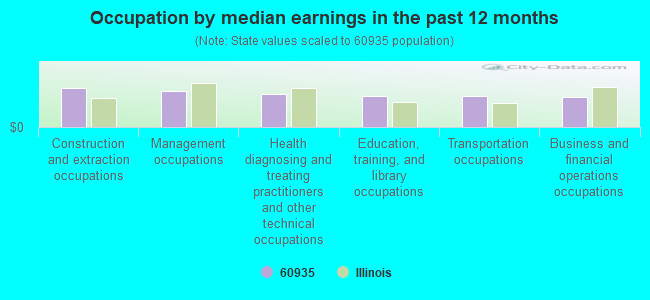
Occupation by median earnings in the past 12 months ($)
101,103Construction and extraction occupations
95,341Management occupations
87,539Health diagnosing and treating practitioners and other technical occupations
81,848Education, training, and library occupations
80,174Transportation occupations
78,756Business and financial operations occupations
Top industries in this zip code by the number of employees in 2005:
Administrative and Support and Waste Management and Remediation Services: All Other Support Services (20-49 employees: 1 establishment)
Arts, Entertainment, and Recreation: Fitness and Recreational Sports Centers (10-19: 1)
Accommodation and Food Services: Full-Service Restaurants (5-9: 1)
Accommodation and Food Services: Drinking Places (Alcoholic Beverages) (1-4: 1)
Administrative and Support and Waste Management and Remediation Services: Janitorial Services (1-4: 1)
Construction: Tile and Terrazzo Contractors (1-4: 1)
Arts, Entertainment, and Recreation: Golf Courses and Country Clubs (1-4: 1)
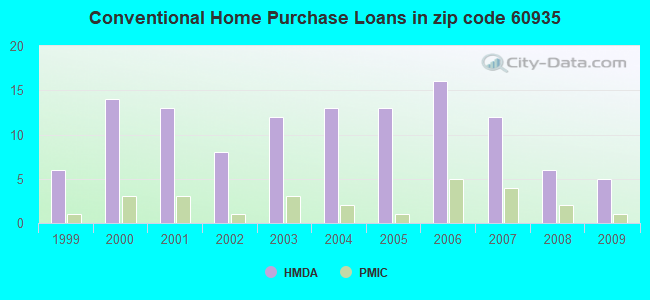
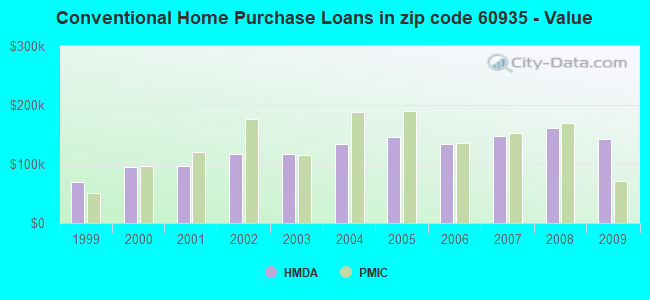
Home Mortgage Disclosure Act Aggregated Statistics For Year 2009 (Based on 2 partial tracts)
A) FHA, FSA/RHS & VA Home Purchase Loans
B) Conventional Home Purchase Loans
C) Refinancings
D) Home Improvement Loans
F) Non-occupant Loans on < 5 Family Dwellings (A B C & D)
Number
Average Value
Number
Average Value
Number
Average Value
Number
Average Value
Number
Average Value
LOANS ORIGINATED
3
$104,060
5
$141,950
34
$161,282
3
$54,527
3
$167,977
APPLICATIONS APPROVED, NOT ACCEPTED
0
$0
0
$0
2
$200,285
1
$52,430
0
$0
APPLICATIONS DENIED
0
$0
1
$201,030
10
$148,332
1
$51,530
1
$55,130
APPLICATIONS WITHDRAWN
0
$0
0
$0
6
$178,062
0
$0
0
$0
FILES CLOSED FOR INCOMPLETENESS
1
$57,220
0
$0
1
$209,720
0
$0
0
$0
Aggregated Statistics For Year 2008 (Based on 2 partial tracts)
A) FHA, FSA/RHS & VA Home Purchase Loans
B) Conventional Home Purchase Loans
C) Refinancings
D) Home Improvement Loans
F) Non-occupant Loans on < 5 Family Dwellings (A B C & D)
G) Loans On Manufactured Home Dwelling (A B C & D)
Number
Average Value
Number
Average Value
Number
Average Value
Number
Average Value
Number
Average Value
Number
Average Value
LOANS ORIGINATED
1
$128,530
6
$160,585
20
$158,474
4
$60,820
1
$106,360
1
$44,340
APPLICATIONS APPROVED, NOT ACCEPTED
0
$0
0
$0
2
$159,685
1
$34,750
0
$0
0
$0
APPLICATIONS DENIED
1
$81,790
1
$69,810
7
$172,099
1
$4,490
1
$275,330
0
$0
APPLICATIONS WITHDRAWN
0
$0
1
$217,210
6
$162,433
1
$70,710
0
$0
0
$0
FILES CLOSED FOR INCOMPLETENESS
0
$0
0
$0
1
$116,540
0
$0
0
$0
0
$0
Aggregated Statistics For Year 2007 (Based on 2 partial tracts)
A) FHA, FSA/RHS & VA Home Purchase Loans
B) Conventional Home Purchase Loans
C) Refinancings
D) Home Improvement Loans
F) Non-occupant Loans on < 5 Family Dwellings (A B C & D)
G) Loans On Manufactured Home Dwelling (A B C & D)
Number
Average Value
Number
Average Value
Number
Average Value
Number
Average Value
Number
Average Value
Number
Average Value
LOANS ORIGINATED
1
$125,230
12
$148,252
23
$150,165
3
$65,113
3
$106,757
0
$0
APPLICATIONS APPROVED, NOT ACCEPTED
0
$0
0
$0
4
$141,785
1
$67,110
0
$0
0
$0
APPLICATIONS DENIED
0
$0
2
$66,360
10
$139,524
3
$52,630
0
$0
2
$59,770
APPLICATIONS WITHDRAWN
0
$0
1
$91,680
4
$139,165
0
$0
0
$0
0
$0
FILES CLOSED FOR INCOMPLETENESS
0
$0
0
$0
0
$0
0
$0
0
$0
0
$0
Aggregated Statistics For Year 2006 (Based on 2 partial tracts)
A) FHA, FSA/RHS & VA Home Purchase Loans
B) Conventional Home Purchase Loans
C) Refinancings
D) Home Improvement Loans
F) Non-occupant Loans on < 5 Family Dwellings (A B C & D)
Number
Average Value
Number
Average Value
Number
Average Value
Number
Average Value
Number
Average Value
LOANS ORIGINATED
1
$156,990
16
$134,164
18
$125,433
3
$55,027
1
$69,810
APPLICATIONS APPROVED, NOT ACCEPTED
0
$0
3
$100,167
3
$114,147
0
$0
0
$0
APPLICATIONS DENIED
0
$0
4
$132,948
9
$145,572
3
$44,640
1
$41,640
APPLICATIONS WITHDRAWN
0
$0
1
$168,970
6
$134,920
0
$0
0
$0
FILES CLOSED FOR INCOMPLETENESS
0
$0
1
$71,010
2
$129,275
0
$0
0
$0
Aggregated Statistics For Year 2005 (Based on 2 partial tracts)
A) FHA, FSA/RHS & VA Home Purchase Loans
B) Conventional Home Purchase Loans
C) Refinancings
D) Home Improvement Loans
F) Non-occupant Loans on < 5 Family Dwellings (A B C & D)
Number
Average Value
Number
Average Value
Number
Average Value
Number
Average Value
Number
Average Value
LOANS ORIGINATED
1
$52,730
13
$146,274
21
$142,053
3
$57,623
2
$90,480
APPLICATIONS APPROVED, NOT ACCEPTED
0
$0
1
$83,890
4
$141,038
1
$17,980
0
$0
APPLICATIONS DENIED
0
$0
2
$96,170
19
$128,229
2
$59,620
0
$0
APPLICATIONS WITHDRAWN
0
$0
1
$26,660
7
$119,540
0
$0
0
$0
FILES CLOSED FOR INCOMPLETENESS
0
$0
1
$118,940
5
$123,076
0
$0
0
$0
Aggregated Statistics For Year 2004 (Based on 2 partial tracts)
A) FHA, FSA/RHS & VA Home Purchase Loans
B) Conventional Home Purchase Loans
C) Refinancings
D) Home Improvement Loans
F) Non-occupant Loans on < 5 Family Dwellings (A B C & D)
G) Loans On Manufactured Home Dwelling (A B C & D)
Number
Average Value
Number
Average Value
Number
Average Value
Number
Average Value
Number
Average Value
Number
Average Value
LOANS ORIGINATED
1
$191,140
13
$133,829
26
$114,401
3
$26,663
2
$57,075
1
$72,200
APPLICATIONS APPROVED, NOT ACCEPTED
0
$0
2
$115,045
3
$125,133
1
$3,600
0
$0
0
$0
APPLICATIONS DENIED
0
$0
6
$99,367
18
$109,653
1
$18,580
1
$117,140
1
$71,900
APPLICATIONS WITHDRAWN
0
$0
2
$128,680
8
$124,109
1
$46,740
0
$0
0
$0
FILES CLOSED FOR INCOMPLETENESS
0
$0
1
$57,220
4
$175,715
0
$0
0
$0
0
$0
Aggregated Statistics For Year 2003 (Based on 2 partial tracts)
A) FHA, FSA/RHS & VA Home Purchase Loans
B) Conventional Home Purchase Loans
C) Refinancings
D) Home Improvement Loans
F) Non-occupant Loans on < 5 Family Dwellings (A B C & D)
Number
Average Value
Number
Average Value
Number
Average Value
Number
Average Value
Number
Average Value
LOANS ORIGINATED
1
$109,950
12
$117,243
60
$121,009
2
$43,590
4
$68,908
APPLICATIONS APPROVED, NOT ACCEPTED
0
$0
1
$137,520
6
$111,950
0
$0
0
$0
APPLICATIONS DENIED
0
$0
2
$80,740
16
$118,623
1
$8,990
0
$0
APPLICATIONS WITHDRAWN
1
$79,690
1
$185,750
6
$130,277
0
$0
0
$0
FILES CLOSED FOR INCOMPLETENESS
0
$0
0
$0
1
$98,870
0
$0
0
$0
Aggregated Statistics For Year 2002 (Based on 2 partial tracts)
A) FHA, FSA/RHS & VA Home Purchase Loans
B) Conventional Home Purchase Loans
C) Refinancings
D) Home Improvement Loans
F) Non-occupant Loans on < 5 Family Dwellings (A B C & D)
Number
Average Value
Number
Average Value
Number
Average Value
Number
Average Value
Number
Average Value
LOANS ORIGINATED
2
$101,715
8
$116,470
38
$105,704
3
$23,470
3
$93,177
APPLICATIONS APPROVED, NOT ACCEPTED
0
$0
1
$102,760
4
$110,852
1
$11,090
0
$0
APPLICATIONS DENIED
0
$0
1
$59,020
10
$101,594
2
$18,125
0
$0
APPLICATIONS WITHDRAWN
0
$0
2
$90,630
3
$125,033
1
$34,750
0
$0
FILES CLOSED FOR INCOMPLETENESS
0
$0
0
$0
3
$104,460
0
$0
0
$0
Aggregated Statistics For Year 2001 (Based on 2 partial tracts)
A) FHA, FSA/RHS & VA Home Purchase Loans
B) Conventional Home Purchase Loans
C) Refinancings
D) Home Improvement Loans
F) Non-occupant Loans on < 5 Family Dwellings (A B C & D)
Number
Average Value
Number
Average Value
Number
Average Value
Number
Average Value
Number
Average Value
LOANS ORIGINATED
2
$95,720
13
$96,402
37
$94,398
5
$24,746
4
$61,792
APPLICATIONS APPROVED, NOT ACCEPTED
0
$0
3
$91,677
4
$73,402
1
$43,440
0
$0
APPLICATIONS DENIED
0
$0
3
$70,407
13
$66,235
2
$20,970
0
$0
APPLICATIONS WITHDRAWN
0
$0
1
$139,610
4
$78,870
0
$0
1
$32,360
FILES CLOSED FOR INCOMPLETENESS
0
$0
0
$0
1
$42,540
0
$0
0
$0
Aggregated Statistics For Year 2000 (Based on 2 partial tracts)
A) FHA, FSA/RHS & VA Home Purchase Loans
B) Conventional Home Purchase Loans
C) Refinancings
D) Home Improvement Loans
F) Non-occupant Loans on < 5 Family Dwellings (A B C & D)
Number
Average Value
Number
Average Value
Number
Average Value
Number
Average Value
Number
Average Value
LOANS ORIGINATED
0
$0
14
$95,572
12
$83,663
3
$25,867
1
$35,650
APPLICATIONS APPROVED, NOT ACCEPTED
0
$0
1
$92,280
2
$115,045
2
$13,780
0
$0
APPLICATIONS DENIED
1
$44,940
6
$66,662
8
$67,896
2
$9,435
0
$0
APPLICATIONS WITHDRAWN
0
$0
1
$141,410
2
$114,150
0
$0
0
$0
FILES CLOSED FOR INCOMPLETENESS
1
$50,330
1
$62,020
1
$100,070
0
$0
0
$0
Aggregated Statistics For Year 1999 (Based on 1 partial tract)
A) FHA, FSA/RHS & VA Home Purchase Loans
B) Conventional Home Purchase Loans
C) Refinancings
D) Home Improvement Loans
F) Non-occupant Loans on < 5 Family Dwellings (A B C & D)
Detailed PMIC statistics for the following Tracts:0103.00
2002 - 2018 National Fire Incident Reporting System (NFIRS) incidents
Based on the data from the years 2002 - 2018 the average number of fire incidents per year is 18. The highest number of reported fire incidents - 59 took place in 2011, and the least - 7 in 2004. The data has a dropping trend.
When looking into fire subcategories, the most incidents belonged to: Structure Fires (43.7%), and Outside Fires (43.4%).
Fire incident types reported to NFIRS in Zip Code 60935


 Nearest zip codes: 60969, 60961, 60474, 60408, 60407, 60913.


 Based on the data from the years 2002 - 2018 the average number of fire incidents per year is 18. The highest number of reported fire incidents - 59 took place in 2011, and the least - 7 in 2004. The data has a dropping trend.
 When looking into fire subcategories, the most incidents belonged to: Structure Fires (43.7%), and Outside Fires (43.4%).