Estimated zip code population in 2022: 674 Zip code population in 2010: 760 Zip code population in 2000: 733
Houses and condos: 331 Renter-occupied apartments: 30
% of renters here:
10%
State:
33%
March 2022 cost of living index in zip code 60474: 93.3 (less than average, U.S. average is 100)
Land area: 3.3 sq. mi. Water area: 0.7 sq. mi.
Population density: 204 people per square mile
(very low).
OSM Map
General Map
Google Map
MSN Map
OSM Map
General Map
Google Map
MSN Map
OSM Map
General Map
Google Map
MSN Map
OSM Map
General Map
Google Map
MSN Map
Please wait while loading the map...
Real estate property taxes paid for housing units in 2022:
This zip code:
2.1% ($3,441)
Illinois:
2.0% ($4,912)
Median real estate property taxes paid for housing units with mortgages in 2022: $3,796 (2.4%) Median real estate property taxes paid for housing units with no mortgage in 2022: $3,099 (1.9%)
Business Search- 14 Million verified businesses
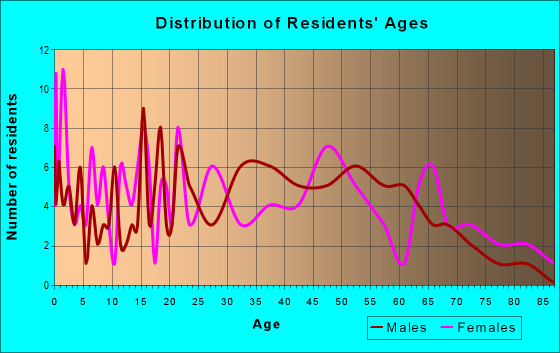
Males: 352
(52.2%)
Females: 322
(47.8%)
For population 25 years and over in 60474:
High school or higher: 91.1%
Bachelor's degree or higher: 15.3%
Graduate or professional degree: 5.0%
Unemployed: 3.7%
Mean travel time to work (commute): 32.9 minutes
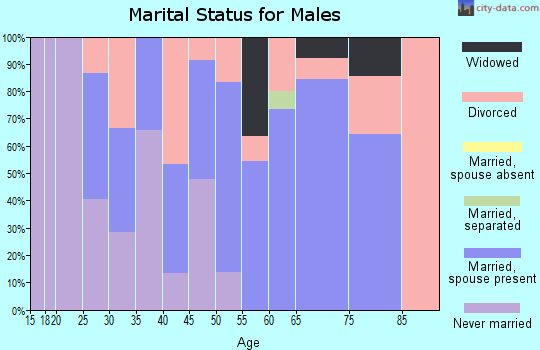
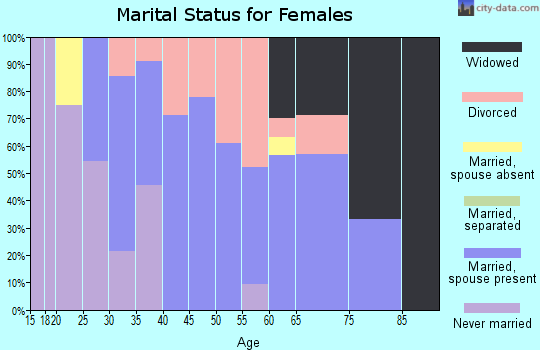
For population 15 years and over in 60474:
Never married: 27.4%
Now married: 55.1%
Separated: 0.2%
Widowed: 6.6%
Divorced: 10.7%
Zip code 60474 compared to state average:
Median house value below state average.
Black race population percentage significantly below state average.
Hispanic race population percentage significantly below state average.
Foreign-born population percentage significantly below state average.
Renting percentage significantly below state average.
Length of stay since moving in above state average.
Number of college students significantly below state average.
Percentage of population with a bachelor's degree or higher significantly below state average.
Averages for the 2004 tax year for zip code 60474, filed in 2005:
Average Adjusted Gross Income (AGI) in 2004: $42,117 (Individual Income Tax Returns)
Here:
$42,117
State:
$54,625
Salary/wage: $40,706 (reported on 82.4% of returns)
Here:
$40,706
State:
$46,811
(% of AGI for various income ranges: 59.3% for AGIs below $10k, 55.0% for AGIs $10k-25k, 72.4% for AGIs $25k-50k, 84.3% for AGIs $50k-75k, 92.2% for AGIs $75k-100k, 82.1% for AGIs over 100k)
Taxable interest for individuals: $1,487 (reported on 60.7% of returns)
This zip code:
$1,487
Illinois:
$2,101
(% of AGI for various income ranges: 11.6% for AGIs below $10k, 6.3% for AGIs $10k-25k, 3.8% for AGIs $25k-50k, 1.1% for AGIs $50k-75k, 0.2% for AGIs $75k-100k, 0.5% for AGIs over 100k)
Taxable dividends: $925 (reported on 30.6% of returns)
Here:
$925
State:
$4,306
(% of AGI for various income ranges: 2.5% for AGIs below $10k, 3.6% for AGIs $10k-25k, 0.7% for AGIs $25k-50k, 0.3% for AGIs $50k-75k, 0.3% for AGIs $75k-100k, 0.1% for AGIs over 100k)
Profit/loss from business: +$455 (reported on 5.6% of returns)
Here:
+$455
State:
+$11,771
Total itemized deductions: $13,578 (22% of AGI, reported on 29.6% of returns)
Here:
$13,578
State:
$20,239
Here:
22.0% of AGI
State:
19.5% of AGI
(% of AGI for various income ranges: 15.3% for AGIs $10k-25k, 8.6% for AGIs $25k-50k, 10.8% for AGIs $50k-75k, 9.7% for AGIs $75k-100k, 7.0% for AGIs over 100k)
Charity contributions deductions: $1,098 (2% of AGI, reported on 26.0% of returns)
Here:
$1,098
State:
$3,719
Here:
1.7% of AGI
State:
3.4% of AGI
(% of AGI for various income ranges: 0.4% for AGIs $10k-25k, 0.7% for AGIs $25k-50k, 0.8% for AGIs $50k-75k, 0.8% for AGIs $75k-100k, 0.5% for AGIs over 100k)
Total tax: $5,111 (reported on 80.4% of returns)
60474:
$5,111
State:
$9,882
(% of AGI for various income ranges: 1.1% for AGIs below $10k, 4.2% for AGIs $10k-25k, 7.8% for AGIs $25k-50k, 9.3% for AGIs $50k-75k, 10.2% for AGIs $75k-100k, 16.1% for AGIs over 100k)
Earned income credit: $1,739 (reported on 5.9% of returns)
Here:
$1,739
State:
$1,788
Percentage of individuals using paid preparers for their 2004 taxes: 73.2%
Here:
73%
State:
61%
(% for various income ranges: 64.5% for AGIs below $10k, 74.7% for AGIs $10k-25k, 70.8% for AGIs $25k-50k, 73.0% for AGIs $50k-75k, 77.3% for AGIs $75k-100k, 95.7% for AGIs over 100k)
Household received Food Stamps/SNAP in the past 12 months: 17 Household did not receive Food Stamps/SNAP in the past 12 months: 265
Women who had a birth in the past 12 months: 2 (2 now married, 0 unmarried) Women who did not have a birth in the past 12 months: 110 (60 now married, 49 unmarried)
Housing units in zip code 60474 with a mortgage: 140 (3 second mortgage, 3 both second mortgage and home equity loan) Houses without a mortgage: 1
Median monthly owner costs for units with a mortgage: $1,417 Median monthly owner costs for units without a mortgage: $645
Residents with income below the poverty level in 2022:
This zip code:
11.4%
Whole state:
11.9%
Residents with income below 50% of the poverty level in 2022:
This zip code:
7.6%
Whole state:
5.7%
Median number of rooms in houses and condos:
Here:
5.9
State:
6.4
Median number of rooms in apartments:
Here:
5.7
State:
4.1
Notable locations in this zip code not listed on our city pages
Size of family households: 94 2-persons, 57 3-persons, 18 4-persons, 8 5-persons, 9 6-persons
Size of nonfamily households: 75 1-person, 22 2-persons
122 married couples with children.
9 single-parent households (8 men, 1 women).
97.9% of residents of 60474 zip code speak English at home.
0.3% of residents speak other Indo-European language at home (100% very well).
1.0% of residents speak Asian or Pacific Island language at home (67% very well, 33% well).
Foreign born population: 7 (1.0%) (100.0% of them are naturalized citizens)
This zip code:
1.0%
Whole state:
14.4%
31%Italian
11%German
11%Irish
7%American
7%English
7%Polish
6%Norwegian
Year of entry for the foreign-born population
82010 or later
02000 to 2009
01990 to 1999
0Before 1990
Facilities with environmental interests located in this zip code:
S WILLMINGTON-E BROOKLYN STP (10 OAK STREET in SOUTH WILMINGTON, IL)
National Pollutant Discharge Elimination System NON-MAJOR (Tracking pollutant discharge elimination systems) - permit National Pollutant Discharge Elimination System NON-MAJOR (Tracking pollutant discharge elimination systems) - permit Business SIC classification: SEWERAGE SYSTEMS Alternative names: SOUTH WILMINGTON EAST BROOKLYN, SOUTH WILMINGTON EAST BROOLKYN, SWEB SANITARY DISTRICT, SWEB SANITARY DISTRICT STP
MARKETTIS FINER FOOD (125 3RD AVENUE in SOUTH WILMINGTON, IL)
AIR MINOR (AIRS/AFS) CRITERIA AND HAZARDOUS AIR POLLUTANT INVENTORY (Inventory of air pollution sources) Business SIC classification: GROCERY STORES Alternative names: RICK MARKETTI
Housing units lacking complete plumbing facilities: 2.7% Housing units lacking complete kitchen facilities: 6.2%
92.8%Utility gas
5.7%Electricity
1.8%Bottled, tank, or LP gas
Place of birth for U.S.-born residents:
This state: 605
Northeast: 3
Midwest: 25
South: 14
West: 16
72% of the 60474 zip code residents lived in the same house 5 years ago. Out of people who lived in different houses, 56% lived in this county. Out of people who lived in different counties, 50% lived in Illinois.
98% of the 60474 zip code residents lived in the same house 1 year ago. Out of people who lived in different houses, 109% moved from different county within same state.
Private vs. public school enrollment:
Students in private schools in grades 1 to 8 (elementary and middle school):
Here:
0.0%
Illinois:
13.3%
Students in private schools in grades 9 to 12 (high school):
Here:
0.0%
Illinois:
9.9%
Students in private undergraduate colleges: 3
Here:
100.0%
Illinois:
27.4%
Occupation by median earnings in the past 12 months ($)
108,214Sales and related occupations
95,042Construction and extraction occupations
74,343Installation, maintenance, and repair occupations
68,743Business and financial operations occupations
64,225Management occupations
52,640Transportation occupations
Top industries in this zip code by the number of employees in 2005:
Construction: Power and Communication Line and Related Structures Construction (10-19 employees: 1 establishment)
Other Services (except Public Administration): Religious Organizations (5-9: 1)
Construction: Site Preparation Contractors (5-9: 1)
Arts, Entertainment, and Recreation: Fitness and Recreational Sports Centers (5-9: 1)
Other Services (except Public Administration): Pet Care (except Veterinary) Services (1-4: 1)
Home Mortgage Disclosure Act Aggregated Statistics For Year 2009 (Based on 2 partial tracts)
A) FHA, FSA/RHS & VA Home Purchase Loans
B) Conventional Home Purchase Loans
C) Refinancings
D) Home Improvement Loans
G) Loans On Manufactured Home Dwelling (A B C & D)
Number
Average Value
Number
Average Value
Number
Average Value
Number
Average Value
Number
Average Value
LOANS ORIGINATED
2
$92,170
1
$77,570
10
$124,888
1
$56,920
0
$0
APPLICATIONS APPROVED, NOT ACCEPTED
0
$0
0
$0
1
$139,660
0
$0
0
$0
APPLICATIONS DENIED
0
$0
1
$57,860
2
$127,850
0
$0
1
$13,170
APPLICATIONS WITHDRAWN
0
$0
0
$0
1
$196,570
0
$0
0
$0
FILES CLOSED FOR INCOMPLETENESS
0
$0
0
$0
0
$0
0
$0
0
$0
Aggregated Statistics For Year 2008 (Based on 2 partial tracts)
A) FHA, FSA/RHS & VA Home Purchase Loans
B) Conventional Home Purchase Loans
C) Refinancings
D) Home Improvement Loans
F) Non-occupant Loans on < 5 Family Dwellings (A B C & D)
Number
Average Value
Number
Average Value
Number
Average Value
Number
Average Value
Number
Average Value
LOANS ORIGINATED
1
$172,540
1
$188,460
5
$122,306
1
$53,440
1
$88,110
APPLICATIONS APPROVED, NOT ACCEPTED
0
$0
0
$0
1
$65,350
0
$0
0
$0
APPLICATIONS DENIED
0
$0
1
$56,920
4
$120,498
1
$62,290
0
$0
APPLICATIONS WITHDRAWN
0
$0
0
$0
1
$74,100
0
$0
0
$0
FILES CLOSED FOR INCOMPLETENESS
0
$0
0
$0
1
$139,760
0
$0
0
$0
Aggregated Statistics For Year 2007 (Based on 2 partial tracts)
A) FHA, FSA/RHS & VA Home Purchase Loans
B) Conventional Home Purchase Loans
C) Refinancings
D) Home Improvement Loans
F) Non-occupant Loans on < 5 Family Dwellings (A B C & D)
G) Loans On Manufactured Home Dwelling (A B C & D)
Number
Average Value
Number
Average Value
Number
Average Value
Number
Average Value
Number
Average Value
Number
Average Value
LOANS ORIGINATED
1
$75,890
4
$160,972
9
$110,553
1
$99,290
1
$159,580
0
$0
APPLICATIONS APPROVED, NOT ACCEPTED
0
$0
1
$55,330
1
$207,530
0
$0
0
$0
0
$0
APPLICATIONS DENIED
0
$0
1
$210,170
4
$113,648
1
$65,030
0
$0
1
$30,570
APPLICATIONS WITHDRAWN
0
$0
0
$0
1
$130,270
1
$60,600
0
$0
0
$0
FILES CLOSED FOR INCOMPLETENESS
0
$0
0
$0
1
$137,650
0
$0
0
$0
0
$0
Aggregated Statistics For Year 2006 (Based on 2 partial tracts)
A) FHA, FSA/RHS & VA Home Purchase Loans
B) Conventional Home Purchase Loans
C) Refinancings
D) Home Improvement Loans
F) Non-occupant Loans on < 5 Family Dwellings (A B C & D)
Number
Average Value
Number
Average Value
Number
Average Value
Number
Average Value
Number
Average Value
LOANS ORIGINATED
1
$69,460
9
$102,964
9
$103,198
1
$57,760
1
$82,740
APPLICATIONS APPROVED, NOT ACCEPTED
0
$0
1
$107,190
2
$112,780
1
$8,750
0
$0
APPLICATIONS DENIED
0
$0
3
$127,850
6
$113,305
1
$111,410
0
$0
APPLICATIONS WITHDRAWN
0
$0
1
$91,590
3
$116,817
1
$38,890
0
$0
FILES CLOSED FOR INCOMPLETENESS
0
$0
0
$0
1
$124,790
0
$0
0
$0
Aggregated Statistics For Year 2005 (Based on 2 partial tracts)
A) FHA, FSA/RHS & VA Home Purchase Loans
B) Conventional Home Purchase Loans
C) Refinancings
D) Home Improvement Loans
F) Non-occupant Loans on < 5 Family Dwellings (A B C & D)
G) Loans On Manufactured Home Dwelling (A B C & D)
Number
Average Value
Number
Average Value
Number
Average Value
Number
Average Value
Number
Average Value
Number
Average Value
LOANS ORIGINATED
1
$124,270
6
$93,385
7
$107,824
1
$107,300
1
$94,440
0
$0
APPLICATIONS APPROVED, NOT ACCEPTED
0
$0
0
$0
1
$113,620
0
$0
0
$0
0
$0
APPLICATIONS DENIED
0
$0
2
$48,220
5
$123,486
1
$52,590
1
$22,340
1
$23,820
APPLICATIONS WITHDRAWN
0
$0
1
$116,780
5
$121,526
0
$0
0
$0
0
$0
FILES CLOSED FOR INCOMPLETENESS
0
$0
0
$0
1
$109,510
0
$0
0
$0
0
$0
Aggregated Statistics For Year 2004 (Based on 2 partial tracts)
A) FHA, FSA/RHS & VA Home Purchase Loans
B) Conventional Home Purchase Loans
C) Refinancings
D) Home Improvement Loans
F) Non-occupant Loans on < 5 Family Dwellings (A B C & D)
Number
Average Value
Number
Average Value
Number
Average Value
Number
Average Value
Number
Average Value
LOANS ORIGINATED
1
$160,000
7
$92,887
9
$106,711
1
$41,630
1
$93,490
APPLICATIONS APPROVED, NOT ACCEPTED
0
$0
0
$0
1
$84,430
0
$0
0
$0
APPLICATIONS DENIED
0
$0
3
$70,337
6
$109,528
2
$19,870
1
$35,840
APPLICATIONS WITHDRAWN
0
$0
1
$87,800
4
$96,705
0
$0
0
$0
FILES CLOSED FOR INCOMPLETENESS
0
$0
0
$0
1
$168,960
0
$0
0
$0
Aggregated Statistics For Year 2003 (Based on 2 partial tracts)
A) FHA, FSA/RHS & VA Home Purchase Loans
B) Conventional Home Purchase Loans
C) Refinancings
D) Home Improvement Loans
F) Non-occupant Loans on < 5 Family Dwellings (A B C & D)
Number
Average Value
Number
Average Value
Number
Average Value
Number
Average Value
Number
Average Value
LOANS ORIGINATED
1
$77,050
5
$95,028
20
$91,566
1
$18,340
2
$63,820
APPLICATIONS APPROVED, NOT ACCEPTED
0
$0
0
$0
2
$75,415
0
$0
0
$0
APPLICATIONS DENIED
0
$0
1
$51,960
5
$98,612
1
$25,090
0
$0
APPLICATIONS WITHDRAWN
0
$0
1
$75,990
6
$105,980
0
$0
0
$0
FILES CLOSED FOR INCOMPLETENESS
0
$0
0
$0
0
$0
0
$0
0
$0
Aggregated Statistics For Year 2002 (Based on 2 partial tracts)
A) FHA, FSA/RHS & VA Home Purchase Loans
B) Conventional Home Purchase Loans
C) Refinancings
D) Home Improvement Loans
F) Non-occupant Loans on < 5 Family Dwellings (A B C & D)
Number
Average Value
Number
Average Value
Number
Average Value
Number
Average Value
Number
Average Value
LOANS ORIGINATED
1
$93,070
4
$84,900
11
$94,103
1
$14,760
1
$59,130
APPLICATIONS APPROVED, NOT ACCEPTED
0
$0
1
$48,480
1
$133,120
0
$0
0
$0
APPLICATIONS DENIED
0
$0
1
$48,590
3
$87,270
1
$9,590
0
$0
APPLICATIONS WITHDRAWN
0
$0
0
$0
2
$112,935
0
$0
0
$0
FILES CLOSED FOR INCOMPLETENESS
0
$0
0
$0
1
$39,100
0
$0
0
$0
Aggregated Statistics For Year 2001 (Based on 2 partial tracts)
A) FHA, FSA/RHS & VA Home Purchase Loans
B) Conventional Home Purchase Loans
C) Refinancings
D) Home Improvement Loans
F) Non-occupant Loans on < 5 Family Dwellings (A B C & D)
Number
Average Value
Number
Average Value
Number
Average Value
Number
Average Value
Number
Average Value
LOANS ORIGINATED
2
$70,985
6
$80,245
13
$84,247
1
$15,600
0
$0
APPLICATIONS APPROVED, NOT ACCEPTED
0
$0
1
$42,370
2
$58,600
0
$0
0
$0
APPLICATIONS DENIED
0
$0
2
$44,425
5
$68,532
1
$9,590
1
$24,030
APPLICATIONS WITHDRAWN
0
$0
0
$0
3
$95,140
0
$0
0
$0
FILES CLOSED FOR INCOMPLETENESS
0
$0
0
$0
1
$67,460
0
$0
0
$0
Aggregated Statistics For Year 2000 (Based on 2 partial tracts)
A) FHA, FSA/RHS & VA Home Purchase Loans
B) Conventional Home Purchase Loans
C) Refinancings
D) Home Improvement Loans
Number
Average Value
Number
Average Value
Number
Average Value
Number
Average Value
LOANS ORIGINATED
2
$105,925
5
$73,064
3
$66,860
1
$30,040
APPLICATIONS APPROVED, NOT ACCEPTED
0
$0
1
$86,530
1
$32,460
0
$0
APPLICATIONS DENIED
0
$0
2
$72,200
2
$57,705
1
$11,280
APPLICATIONS WITHDRAWN
0
$0
1
$35,840
2
$82,580
0
$0
FILES CLOSED FOR INCOMPLETENESS
0
$0
0
$0
0
$0
0
$0
Aggregated Statistics For Year 1999 (Based on 1 partial tract)
Detailed PMIC statistics for the following Tracts:0009.00
2002 - 2018 National Fire Incident Reporting System (NFIRS) incidents
According to the data from the years 2002 - 2018 the average number of fires per year is 6. The highest number of fires - 16 took place in 2008, and the least - 0 in 2006. The data has a growing trend.
When looking into fire subcategories, the most reports belonged to: Structure Fires (42.5%), and Outside Fires (42.5%).
Fire incident types reported to NFIRS in Zip Code 60474


 Nearest zip codes: 60407, 60424, 60961, 60935, 60408, 60416.


 According to the data from the years 2002 - 2018 the average number of fires per year is 6. The highest number of fires - 16 took place in 2008, and the least - 0 in 2006. The data has a growing trend.
 When looking into fire subcategories, the most reports belonged to: Structure Fires (42.5%), and Outside Fires (42.5%).