Estimated zip code population in 2022: 1,049 Zip code population in 2010: 1,173 Zip code population in 2000: 1,214
Houses and condos: 495 Renter-occupied apartments: 60
% of renters here:
13%
State:
33%
March 2022 cost of living index in zip code 61014: 84.2 (less than average, U.S. average is 100)
Land area: 64.9 sq. mi. Water area: 0.0 sq. mi.
Population density: 16 people per square mile
(very low).
OSM Map
General Map
Google Map
MSN Map
OSM Map
General Map
Google Map
MSN Map
OSM Map
General Map
Google Map
MSN Map
OSM Map
General Map
Google Map
MSN Map
Please wait while loading the map...
Real estate property taxes paid for housing units in 2022:
This zip code:
1.6% ($1,722)
Illinois:
2.0% ($4,912)
Median real estate property taxes paid for housing units with mortgages in 2022: $1,661 (1.4%) Median real estate property taxes paid for housing units with no mortgage in 2022: $1,781 (1.7%)
Business Search- 14 Million verified businesses
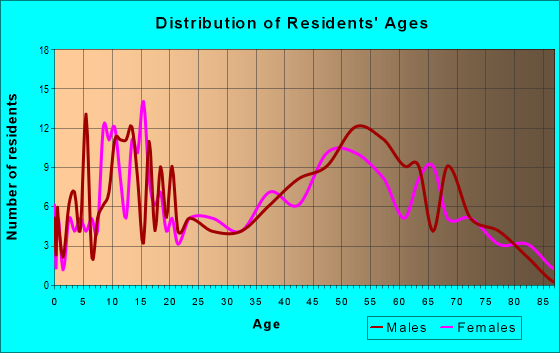
Males: 565
(53.9%)
Females: 484
(46.1%)
For population 25 years and over in 61014:
High school or higher: 90.4%
Bachelor's degree or higher: 23.7%
Graduate or professional degree: 5.5%
Unemployed: 0.8%
Mean travel time to work (commute): 32.6 minutes
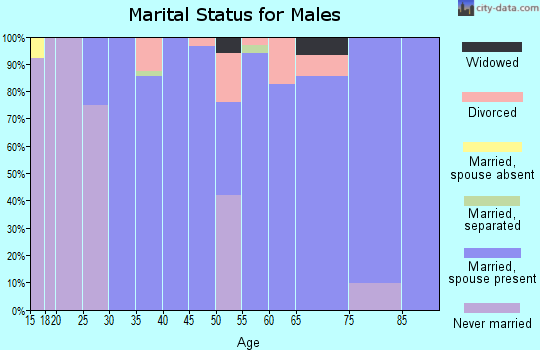
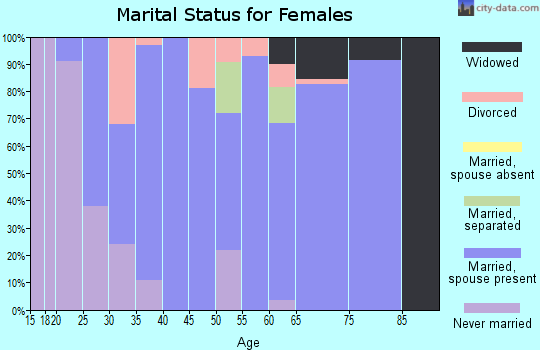
For population 15 years and over in 61014:
Never married: 34.1%
Now married: 50.5%
Separated: 0.0%
Widowed: 3.5%
Divorced: 11.9%
Zip code 61014 compared to state average:
Median house value significantly below state average.
Unemployed percentage significantly below state average.
Black race population percentage significantly below state average.
Hispanic race population percentage significantly below state average.
Median age significantly above state average.
Foreign-born population percentage significantly below state average.
Renting percentage significantly below state average.
Length of stay since moving in significantly above state average.
Averages for the 2020 tax year for zip code 61014, filed in 2021:
Average Adjusted Gross Income (AGI) in 2020: $69,659 (Individual Income Tax Returns)
Here:
$69,659
State:
$82,626
Salary/wage: $48,593 (reported on 81.5% of returns)
Here:
$48,593
State:
$66,640
(% of AGI for various income ranges: 1262.0% for AGIs below $25k, 3640.0% for AGIs $25k-50k, 6762.0% for AGIs $50k-75k, 7308.0% for AGIs $75k-100k, 18160.0% for AGIs $100k-200k)
Taxable interest for individuals: $721 (reported on 44.4% of returns)
This zip code:
$721
Illinois:
$2,376
(% of AGI for various income ranges: 43.0% for AGIs below $25k, 19.1% for AGIs $25k-50k, 72.0% for AGIs $50k-75k, 94.0% for AGIs $75k-100k, 52.0% for AGIs $100k-200k)
Ordinary dividends: $1,809 (reported on 20.4% of returns)
Here:
$1,809
State:
$9,061
(% of AGI for various income ranges: 33.6% for AGIs $25k-50k, 118.0% for AGIs $75k-100k, 206.0% for AGIs $100k-200k)
Net capital gain/loss in AGI: +$6,233 (reported on 16.7% of returns)
Here:
+$6,233
State:
+$31,684
(% of AGI for various income ranges: 93.6% for AGIs $25k-50k, 440.0% for AGIs $75k-100k, 476.0% for AGIs $100k-200k)
Profit/loss from business: +$3,017 (reported on 11.1% of returns)
Here:
+$3,017
State:
+$12,175
(% of AGI for various income ranges: 196.0% for AGIs below $25k)
Taxable individual retirement arrangement distribution: $9,783 (reported on 11.1% of returns)
61014:
$9,783
Illinois:
$21,613
(% of AGI for various income ranges: 200.0% for AGIs below $25k, 774.0% for AGIs $50k-75k)
Earned income credit: $2,375 (reported on 7.4% of returns)
Here:
$2,375
State:
$2,311
(% of AGI for various income ranges: 95.0% for AGIs below $25k)
Percentage of individuals using paid preparers for their 2020 taxes: 98.1%
Here:
98%
State:
93%
(% for various income ranges: 93.3% for AGIs below $25k, 100.0% for AGIs $25k-50k, 100.0% for AGIs $50k-75k, 100.0% for AGIs $75k-100k, 100.0% for AGIs $100k-200k)
Averages for the 2012 tax year for zip code 61014, filed in 2013:
Average Adjusted Gross Income (AGI) in 2012: $58,340 (Individual Income Tax Returns)
Here:
$58,340
State:
$68,058
Salary/wage: $40,260 (reported on 82.5% of returns)
Here:
$40,260
State:
$55,396
(% of AGI for various income ranges: 71.2% for AGIs below $25k, 74.6% for AGIs $25k-50k, 79.7% for AGIs $50k-75k, 69.7% for AGIs $75k-100k, 34.0% for AGIs $100k-200k)
Taxable interest for individuals: $896 (reported on 42.1% of returns)
This zip code:
$896
Illinois:
$1,969
(% of AGI for various income ranges: 2.0% for AGIs below $25k, 1.3% for AGIs $25k-50k, 0.7% for AGIs $50k-75k, 0.6% for AGIs $75k-100k, 0.2% for AGIs $100k-200k)
Ordinary dividends: $1,336 (reported on 19.3% of returns)
Here:
$1,336
State:
$7,786
(% of AGI for various income ranges: 1.4% for AGIs $25k-50k, 0.6% for AGIs $75k-100k, 0.3% for AGIs $100k-200k)
Net capital gain/loss in AGI: +$9,743 (reported on 12.3% of returns)
Here:
+$9,743
State:
+$22,183
Profit/loss from business: +$3,362 (reported on 14.0% of returns)
Here:
+$3,362
State:
+$12,903
(% of AGI for various income ranges: 6.9% for AGIs below $25k, 0.5% for AGIs $25k-50k, 1.1% for AGIs $50k-75k)
Taxable individual retirement arrangement distribution: $5,300 (reported on 12.3% of returns)
61014:
$5,300
Illinois:
$17,929
Total itemized deductions: $18,831 (17% of AGI, reported on 22.8% of returns)
Here:
$18,831
State:
$26,433
Here:
16.6% of AGI
State:
19.2% of AGI
(% of AGI for various income ranges: 10.7% for AGIs $25k-50k, 7.7% for AGIs $50k-75k, 7.0% for AGIs $75k-100k, 7.5% for AGIs $100k-200k)
Charity contributions: $4,325 (reported on 14.0% of returns)
Here:
$4,325
State:
$4,525
(% of AGI for various income ranges: 1.6% for AGIs $25k-50k, 0.7% for AGIs $75k-100k, 1.6% for AGIs $100k-200k)
Taxes paid: $6,685 (reported on 22.8% of returns)
61014:
$6,685
State:
$11,968
(% of AGI for various income ranges: 2.8% for AGIs $25k-50k, 2.5% for AGIs $50k-75k, 2.8% for AGIs $75k-100k, 3.0% for AGIs $100k-200k)
Earned income credit: $2,343 (reported on 12.3% of returns)
Here:
$2,343
State:
$2,349
(% of AGI for various income ranges: 5.0% for AGIs below $25k, 0.7% for AGIs $25k-50k)
Percentage of individuals using paid preparers for their 2012 taxes: 68.4%
Here:
68%
State:
57%
(% for various income ranges: 55.0% for AGIs below $25k, 71.4% for AGIs $25k-50k, 70.0% for AGIs $50k-75k, 83.3% for AGIs $75k-100k, 85.7% for AGIs $100k-200k)
Averages for the 2004 tax year for zip code 61014, filed in 2005:
Average Adjusted Gross Income (AGI) in 2004: $36,163 (Individual Income Tax Returns)
Here:
$36,163
State:
$54,625
Salary/wage: $30,785 (reported on 84.2% of returns)
Here:
$30,785
State:
$46,811
(% of AGI for various income ranges: 93.5% for AGIs below $10k, 70.8% for AGIs $10k-25k, 72.0% for AGIs $25k-50k, 78.2% for AGIs $50k-75k, 67.0% for AGIs $75k-100k, 56.5% for AGIs over 100k)
Taxable interest for individuals: $1,341 (reported on 53.7% of returns)
This zip code:
$1,341
Illinois:
$2,101
(% of AGI for various income ranges: 4.3% for AGIs below $10k, 3.6% for AGIs $10k-25k, 2.2% for AGIs $25k-50k, 2.0% for AGIs $50k-75k, 1.4% for AGIs $75k-100k, 0.2% for AGIs over 100k)
Taxable dividends: $927 (reported on 25.1% of returns)
Here:
$927
State:
$4,306
(% of AGI for various income ranges: 1.3% for AGIs below $10k, 0.9% for AGIs $10k-25k, 0.8% for AGIs $25k-50k, 0.6% for AGIs $50k-75k, 0.5% for AGIs $75k-100k, 0.2% for AGIs over 100k)
Net capital gain/loss: +$1,820 (reported on 16.6% of returns)
Here:
+$1,820
State:
+$17,321
(% of AGI for various income ranges: 0.2% for AGIs $10k-25k, 0.2% for AGIs $25k-50k, 1.8% for AGIs $50k-75k, 1.4% for AGIs $75k-100k, 0.1% for AGIs over 100k)
Profit/loss from business: +$3,357 (reported on 14.0% of returns)
Here:
+$3,357
State:
+$11,771
(% of AGI for various income ranges: -0.5% for AGIs below $10k, 0.7% for AGIs $10k-25k, 4.2% for AGIs $25k-50k, 0.3% for AGIs $50k-75k)
Total itemized deductions: $15,639 (28% of AGI, reported on 17.9% of returns)
Here:
$15,639
State:
$20,239
Here:
28.1% of AGI
State:
19.5% of AGI
(% of AGI for various income ranges: 13.8% for AGIs $10k-25k, 6.7% for AGIs $25k-50k, 9.1% for AGIs $50k-75k, 10.7% for AGIs over 100k)
Charity contributions deductions: $2,988 (5% of AGI, reported on 13.3% of returns)
Here:
$2,988
State:
$3,719
Here:
5.0% of AGI
State:
3.4% of AGI
(% of AGI for various income ranges: 1.0% for AGIs $10k-25k, 1.0% for AGIs $25k-50k, 0.9% for AGIs $50k-75k, 3.1% for AGIs over 100k)
Total tax: $4,122 (reported on 76.2% of returns)
61014:
$4,122
State:
$9,882
(% of AGI for various income ranges: 2.3% for AGIs below $10k, 4.3% for AGIs $10k-25k, 6.8% for AGIs $25k-50k, 8.4% for AGIs $50k-75k, 10.4% for AGIs $75k-100k, 16.9% for AGIs over 100k)
Earned income credit: $1,524 (reported on 10.5% of returns)
Here:
$1,524
State:
$1,788
Percentage of individuals using paid preparers for their 2004 taxes: 73.1%
Here:
73%
State:
61%
(% for various income ranges: 60.3% for AGIs below $10k, 73.1% for AGIs $10k-25k, 79.6% for AGIs $25k-50k, 78.9% for AGIs $50k-75k, 74.3% for AGIs $75k-100k, 70.0% for AGIs over 100k)
Churches in zip code 61014 include: Black Oak Church (A), Genesee Grove Church (B), Hope United Methodist Church (C). Display/hide their locations on the map
Cemeteries: Fairhaven Cemetery (1), Chadwick Methodist Cemetery (2), Black Oak Lutheran Cemetery (3), Hope Brethern Cemetery Cemetery (4), Hazel Green Cemetery (5), Cemeter Genessee Cemetery (6). Display/hide their locations on the map
Size of family households: 146 2-persons, 108 3-persons, 50 4-persons, 2 5-persons, 1 6-persons
Size of nonfamily households: 106 1-person, 18 2-persons, 17 3-persons
72 married couples with children.
14 single-parent households (14 men).
97.8% of residents of 61014 zip code speak English at home.
0.4% of residents speak other Indo-European language at home (100% very well).
0.7% of residents speak other language at home (86% very well, 14% well).
Foreign born population: 25 (2.4%) (100.0% of them are naturalized citizens)
This zip code:
2.4%
Whole state:
14.4%
76%Thailand
36%American
34%German
11%Dutch
6%English
4%Irish
3%Swedish
0%European
Year of entry for the foreign-born population
02010 or later
12000 to 2009
221990 to 1999
0Before 1990
Facilities with environmental interests located in this zip code:
LEIF S AUTO SALVAGE (3331 MORRISON RT. in CHADWICK, IL)
STATE MASTER (Illinois EPA Project) - AIR PROGRAM AIR MINOR (AIRS/AFS) CRITERIA AND HAZARDOUS AIR POLLUTANT INVENTORY (Inventory of air pollution sources) Business SIC classification: SPECIAL WAREHOUSING AND STORAGE Alternative names: LEIFS AUTO SALVAGE
DENNIS ROBERTS TRUCKING (422 N. MARION in CHADWICK, IL)
STATE MASTER (Illinois EPA Project) - National Pollutant Discharge Elimination System Permit National Pollutant Discharge Elimination System NON-MAJOR (Tracking pollutant discharge elimination systems) - permit Organizations: ROBERTS TRUCKING?DENNIS (CONTACT/OWNER)
Alternative names: ROBERTS, DENNIS TRUCKING, ROBERTS TRUCKING?DENNIS
KNESS TRUCKING?C.G. (STATE RT. 88 in CHADWICK, IL)
National Pollutant Discharge Elimination System NON-MAJOR (Tracking pollutant discharge elimination systems) - permit Organizations: KNESS?CARL G. (CONTACT/OWNER)
Alternative names: KNESS, C.G. TRUCKING
QUECKBOERNER TRUCKING, INC. (N. ON RT. 78 TO ARGO FAY RD - in CHADWICK, IL)
National Pollutant Discharge Elimination System NON-MAJOR (Tracking pollutant discharge elimination systems) - permit
Housing units lacking complete plumbing facilities: 1.5% Housing units lacking complete kitchen facilities: 1.8%
58.6%Utility gas
27.4%Bottled, tank, or LP gas
7.7%Wood
5.7%Electricity
1.1%Fuel oil, kerosene, etc.
Population in 1990: 1,252.
Place of birth for U.S.-born residents:
This state: 724
Northeast: 9
Midwest: 274
South: 12
West: 4
69% of the 61014 zip code residents lived in the same house 5 years ago. Out of people who lived in different houses, 51% lived in this county. Out of people who lived in different counties, 50% lived in Illinois.
89% of the 61014 zip code residents lived in the same house 1 year ago. Out of people who lived in different houses, 78% moved from this county. Out of people who lived in different houses, 11% moved from different county within same state. Out of people who lived in different houses, 5% moved from different state.
Private vs. public school enrollment:
Students in private schools in grades 1 to 8 (elementary and middle school):
Here:
0.0%
Illinois:
13.3%
Students in private schools in grades 9 to 12 (high school): 2
Here:
9.7%
Illinois:
9.9%
Students in private undergraduate colleges:
Here:
0.0%
Illinois:
27.4%
Occupation by median earnings in the past 12 months ($)
96,191Architecture and engineering occupations
65,918Business and financial operations occupations
58,399Construction and extraction occupations
56,247Management occupations
51,358Transportation occupations
44,212Production occupations
Top industries in this zip code by the number of employees in 2005:
Wholesale Trade: Farm and Garden Machinery and Equipment Merchant Wholesalers (20-49 employees: 1 establishment)
Accommodation and Food Services: Limited-Service Restaurants (10-19: 1)
Administrative and Support and Waste Management and Remediation Services: Landscaping Services (5-9: 1)
Finance and Insurance: Commercial Banking (5-9: 1)
Fatal accident statistics in 2012:
Fatal accident count: 1
Vehicles involved in fatal accidents: 1
Fatal accidents caused by drunken drivers: 0
Fatalities: 1
Persons involved in fatal accidents: 1
Pedestrians involved in fatal accidents: 0
2002 - 2018 National Fire Incident Reporting System (NFIRS) incidents
Based on the data from the years 2002 - 2018 the average number of fire incidents per year is 12. The highest number of fire incidents - 23 took place in 2007, and the least - 0 in 2016. The data has a constant trend.
When looking into fire subcategories, the most reports belonged to: Outside Fires (40.3%), and Structure Fires (39.8%).
Fire incident types reported to NFIRS in Zip Code 61014


 Nearest zip codes: 61051, 61046, 61270, 61285, 61053, 61081.


 Based on the data from the years 2002 - 2018 the average number of fire incidents per year is 12. The highest number of fire incidents - 23 took place in 2007, and the least - 0 in 2016. The data has a constant trend.
 When looking into fire subcategories, the most reports belonged to: Outside Fires (40.3%), and Structure Fires (39.8%).