Estimated zip code population in 2022: 2,622 Zip code population in 2010: 2,831 Zip code population in 2000: 2,920
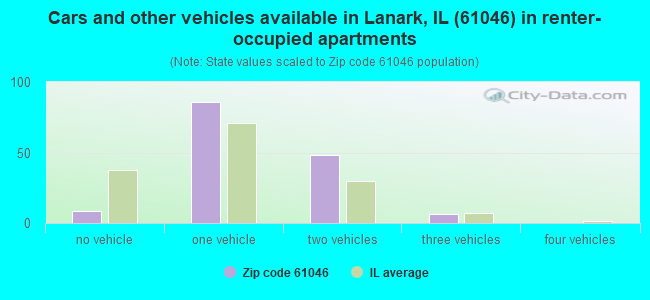
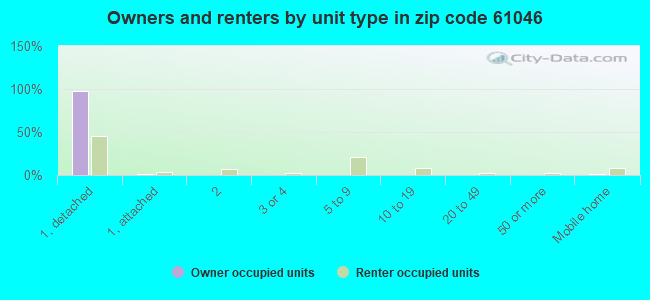
Houses and condos: 1,974 Renter-occupied apartments: 149
% of renters here:
13%
State:
33%
March 2022 cost of living index in zip code 61046: 84.1 (less than average, U.S. average is 100)
Land area: 82.2 sq. mi. Water area: 0.6 sq. mi.
Population density: 32 people per square mile
(very low).
OSM Map
General Map
Google Map
MSN Map
OSM Map
General Map
Google Map
MSN Map
OSM Map
General Map
Google Map
MSN Map
OSM Map
General Map
Google Map
MSN Map
Please wait while loading the map...
Real estate property taxes paid for housing units in 2022:
This zip code:
1.7% ($2,446)
Illinois:
2.0% ($4,912)
Median real estate property taxes paid for housing units with mortgages in 2022: $2,596 (1.6%) Median real estate property taxes paid for housing units with no mortgage in 2022: $2,329 (1.8%)
Business Search- 14 Million verified businesses
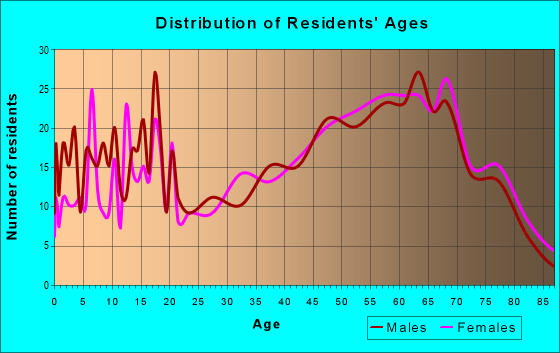
Males: 1,401
(53.4%)
Females: 1,221
(46.6%)
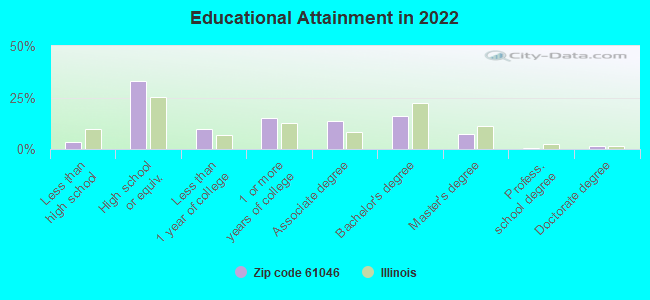
For population 25 years and over in 61046:
High school or higher: 95.8%
Bachelor's degree or higher: 24.9%
Graduate or professional degree: 9.3%
Unemployed: 3.8%
Mean travel time to work (commute): 24.5 minutes
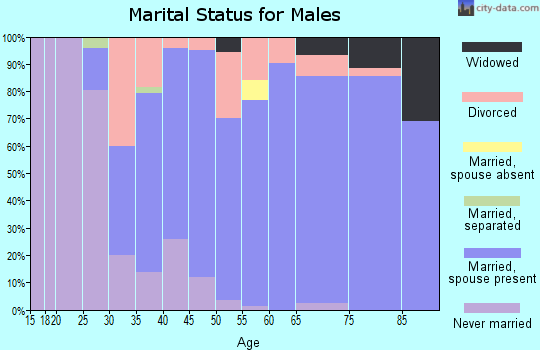
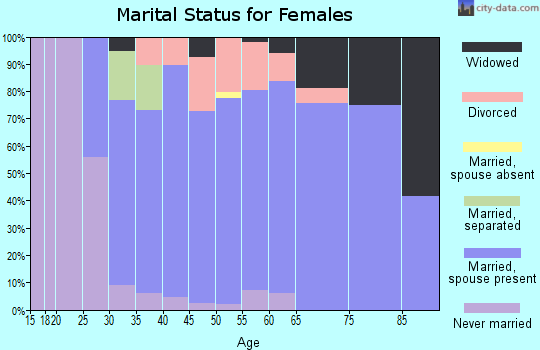
For population 15 years and over in 61046:
Never married: 25.1%
Now married: 64.5%
Separated: 0.2%
Widowed: 5.2%
Divorced: 5.0%
Zip code 61046 compared to state average:
Median house value below state average.
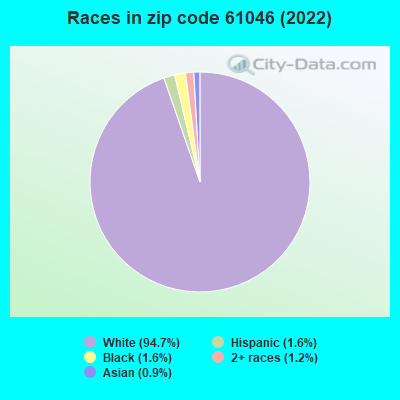
Black race population percentage significantly below state average.
Hispanic race population percentage significantly below state average.
Median age significantly above state average.
Foreign-born population percentage significantly below state average.
Renting percentage significantly below state average.
Length of stay since moving in significantly above state average.
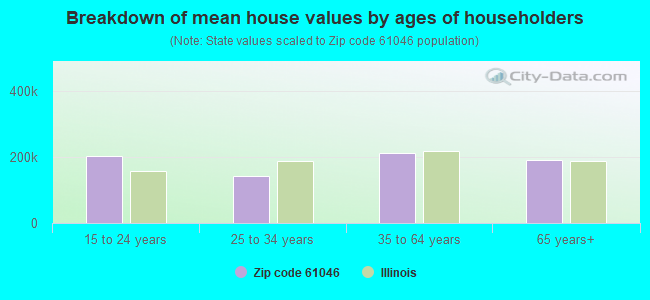
Estimated median house/condo value in 2022: $144,688
61046:
$144,688
Illinois:
$251,600
According to our research of Illinois and other state lists, there were 4 registered sex offenders living in 61046 zip code as of April 29, 2024. The ratio of all residents to sex offenders in zip code 61046 is 666 to 1. The ratio of registered sex offenders to all residents in this zip code is near the state average.
Median resident age:
This zip code:
50.1 years
Illinois median age:
39.1 years
Average household size:
This zip code:
2.2 people
Illinois:
2.4 people
Averages for the 2020 tax year for zip code 61046, filed in 2021:
Average Adjusted Gross Income (AGI) in 2020: $79,798 (Individual Income Tax Returns)
Here:
$79,798
State:
$82,626
Salary/wage: $62,020 (reported on 72.6% of returns)
Here:
$62,020
State:
$66,640
(% of AGI for various income ranges: 1146.7% for AGIs below $25k, 3611.6% for AGIs $25k-50k, 6104.3% for AGIs $50k-75k, 8940.0% for AGIs $75k-100k, 14962.0% for AGIs $100k-200k, 79270.0% for AGIs over 200k)
Taxable interest for individuals: $1,658 (reported on 43.8% of returns)
This zip code:
$1,658
Illinois:
$2,376
(% of AGI for various income ranges: 28.5% for AGIs below $25k, 47.9% for AGIs $25k-50k, 80.0% for AGIs $50k-75k, 158.0% for AGIs $75k-100k, 216.7% for AGIs $100k-200k, 1490.0% for AGIs over 200k)
Ordinary dividends: $5,546 (reported on 26.7% of returns)
Here:
$5,546
State:
$9,061
(% of AGI for various income ranges: 33.7% for AGIs below $25k, 61.1% for AGIs $25k-50k, 156.4% for AGIs $50k-75k, 234.0% for AGIs $75k-100k, 426.7% for AGIs $100k-200k, 4315.0% for AGIs over 200k)
Net capital gain/loss in AGI: +$11,221 (reported on 26.0% of returns)
Here:
+$11,221
State:
+$31,684
(% of AGI for various income ranges: 27.8% for AGIs below $25k, 63.2% for AGIs $25k-50k, 175.0% for AGIs $50k-75k, 498.0% for AGIs $75k-100k, 606.0% for AGIs $100k-200k, 12085.0% for AGIs over 200k)
Profit/loss from business: +$12,104 (reported on 15.8% of returns)
Here:
+$12,104
State:
+$12,175
(% of AGI for various income ranges: 128.5% for AGIs below $25k, 233.2% for AGIs $25k-50k, 99.3% for AGIs $50k-75k, 565.0% for AGIs $75k-100k, 582.7% for AGIs $100k-200k, 2080.0% for AGIs over 200k)
Taxable individual retirement arrangement distribution: $20,470 (reported on 18.5% of returns)
61046:
$20,470
Illinois:
$21,613
(% of AGI for various income ranges: 117.4% for AGIs below $25k, 160.5% for AGIs $25k-50k, 513.6% for AGIs $50k-75k, 818.0% for AGIs $75k-100k, 1119.3% for AGIs $100k-200k, 8445.0% for AGIs over 200k)
Total itemized deductions: $33,930 (reported on 6.8% of returns)
Here:
$33,930
State:
$34,948
(% of AGI for various income ranges: 858.6% for AGIs $50k-75k, 750.7% for AGIs $100k-200k, 5325.0% for AGIs over 200k)
Charity contributions: $6,938 (reported on 5.5% of returns)
Here:
$6,938
State:
$13,122
(% of AGI for various income ranges: 153.3% for AGIs $100k-200k, 1625.0% for AGIs over 200k)
Taxes paid: $8,167 (reported on 6.2% of returns)
61046:
$8,167
State:
$8,563
(% of AGI for various income ranges: 136.4% for AGIs $50k-75k, 184.7% for AGIs $100k-200k, 1335.0% for AGIs over 200k)
Earned income credit: $2,353 (reported on 10.3% of returns)
Here:
$2,353
State:
$2,311
(% of AGI for various income ranges: 93.0% for AGIs below $25k, 53.7% for AGIs $25k-50k)
Percentage of individuals using paid preparers for their 2020 taxes: 95.2%
Here:
95%
State:
93%
(% for various income ranges: 92.9% for AGIs below $25k, 100.0% for AGIs $25k-50k, 95.5% for AGIs $50k-75k, 94.4% for AGIs $75k-100k, 93.1% for AGIs $100k-200k, 100.0% for AGIs over 200k)
Averages for the 2012 tax year for zip code 61046, filed in 2013:
Average Adjusted Gross Income (AGI) in 2012: $58,753 (Individual Income Tax Returns)
Here:
$58,753
State:
$68,058
Salary/wage: $38,630 (reported on 74.8% of returns)
Here:
$38,630
State:
$55,396
(% of AGI for various income ranges: 66.3% for AGIs below $25k, 64.8% for AGIs $25k-50k, 60.9% for AGIs $50k-75k, 56.3% for AGIs $75k-100k, 49.9% for AGIs $100k-200k, 19.6% for AGIs over 200k)
Taxable interest for individuals: $1,756 (reported on 47.6% of returns)
This zip code:
$1,756
Illinois:
$1,969
(% of AGI for various income ranges: 2.4% for AGIs below $25k, 1.2% for AGIs $25k-50k, 1.0% for AGIs $50k-75k, 1.0% for AGIs $75k-100k, 1.4% for AGIs $100k-200k, 1.9% for AGIs over 200k)
Ordinary dividends: $3,828 (reported on 27.3% of returns)
Here:
$3,828
State:
$7,786
(% of AGI for various income ranges: 1.2% for AGIs below $25k, 1.5% for AGIs $25k-50k, 1.5% for AGIs $50k-75k, 1.5% for AGIs $75k-100k, 2.3% for AGIs $100k-200k, 1.9% for AGIs over 200k)
Net capital gain/loss in AGI: +$6,791 (reported on 23.1% of returns)
Here:
+$6,791
State:
+$22,183
(% of AGI for various income ranges: 0.7% for AGIs $25k-50k, 0.1% for AGIs $50k-75k, 0.6% for AGIs $75k-100k, 2.3% for AGIs $100k-200k, 8.6% for AGIs over 200k)
Profit/loss from business: +$9,640 (reported on 17.5% of returns)
Here:
+$9,640
State:
+$12,903
(% of AGI for various income ranges: 5.8% for AGIs below $25k, 4.3% for AGIs $25k-50k, 1.9% for AGIs $50k-75k, 2.1% for AGIs $75k-100k, 4.8% for AGIs $100k-200k)
Taxable individual retirement arrangement distribution: $13,304 (reported on 19.6% of returns)
61046:
$13,304
Illinois:
$17,929
(% of AGI for various income ranges: 6.6% for AGIs below $25k, 5.1% for AGIs $25k-50k, 4.6% for AGIs $50k-75k, 6.4% for AGIs $75k-100k, 5.9% for AGIs $100k-200k)
Total itemized deductions: $21,402 (22% of AGI, reported on 32.2% of returns)
Here:
$21,402
State:
$26,433
Here:
21.5% of AGI
State:
19.2% of AGI
(% of AGI for various income ranges: 18.2% for AGIs below $25k, 12.4% for AGIs $25k-50k, 10.9% for AGIs $50k-75k, 12.4% for AGIs $75k-100k, 12.9% for AGIs $100k-200k, 7.9% for AGIs over 200k)
Charity contributions: $3,883 (reported on 24.5% of returns)
Here:
$3,883
State:
$4,525
(% of AGI for various income ranges: 0.9% for AGIs below $25k, 1.2% for AGIs $25k-50k, 1.5% for AGIs $50k-75k, 1.7% for AGIs $75k-100k, 2.1% for AGIs $100k-200k, 1.5% for AGIs over 200k)
Taxes paid: $8,785 (reported on 32.2% of returns)
61046:
$8,785
State:
$11,968
(% of AGI for various income ranges: 4.8% for AGIs below $25k, 3.9% for AGIs $25k-50k, 3.6% for AGIs $50k-75k, 4.5% for AGIs $75k-100k, 5.9% for AGIs $100k-200k, 5.1% for AGIs over 200k)
Earned income credit: $2,100 (reported on 12.6% of returns)
Here:
$2,100
State:
$2,349
(% of AGI for various income ranges: 5.2% for AGIs below $25k, 0.7% for AGIs $25k-50k)
Percentage of individuals using paid preparers for their 2012 taxes: 64.3%
Here:
64%
State:
57%
(% for various income ranges: 52.7% for AGIs below $25k, 60.0% for AGIs $25k-50k, 71.4% for AGIs $50k-75k, 80.0% for AGIs $75k-100k, 82.4% for AGIs $100k-200k, 80.0% for AGIs over 200k)
Averages for the 2004 tax year for zip code 61046, filed in 2005:
Average Adjusted Gross Income (AGI) in 2004: $41,636 (Individual Income Tax Returns)
Here:
$41,636
State:
$54,625
Salary/wage: $32,900 (reported on 74.7% of returns)
Here:
$32,900
State:
$46,811
(% of AGI for various income ranges: 149.1% for AGIs below $10k, 59.2% for AGIs $10k-25k, 65.3% for AGIs $25k-50k, 65.2% for AGIs $50k-75k, 64.4% for AGIs $75k-100k, 41.0% for AGIs over 100k)
Taxable interest for individuals: $2,094 (reported on 63.1% of returns)
This zip code:
$2,094
Illinois:
$2,101
(% of AGI for various income ranges: 21.1% for AGIs below $10k, 4.6% for AGIs $10k-25k, 3.2% for AGIs $25k-50k, 2.1% for AGIs $50k-75k, 4.5% for AGIs $75k-100k, 1.9% for AGIs over 100k)
Taxable dividends: $2,346 (reported on 30.0% of returns)
Here:
$2,346
State:
$4,306
(% of AGI for various income ranges: 2.4% for AGIs below $10k, 2.3% for AGIs $10k-25k, 1.6% for AGIs $25k-50k, 1.3% for AGIs $50k-75k, 0.9% for AGIs $75k-100k, 2.5% for AGIs over 100k)
Net capital gain/loss: +$5,935 (reported on 24.4% of returns)
Here:
+$5,935
State:
+$17,321
(% of AGI for various income ranges: -2.4% for AGIs below $10k, -0.6% for AGIs $10k-25k, 1.5% for AGIs $25k-50k, 1.4% for AGIs $50k-75k, 2.6% for AGIs $75k-100k, 8.9% for AGIs over 100k)
Profit/loss from business: +$10,470 (reported on 16.6% of returns)
Here:
+$10,470
State:
+$11,771
(% of AGI for various income ranges: 15.0% for AGIs below $10k, 4.6% for AGIs $10k-25k, 3.8% for AGIs $25k-50k, 3.7% for AGIs $50k-75k, 3.6% for AGIs $75k-100k, 4.6% for AGIs over 100k)
Profit/loss from farming: +$6,131 (reported on 7.1% of returns)
Here:
+$6,131
State:
+$2,327
(% of AGI for various income ranges: 4.4% for AGIs below $10k, 2.7% for AGIs $10k-25k, 1.2% for AGIs $25k-50k, 2.3% for AGIs $50k-75k, -0.2% for AGIs $75k-100k)
IRA payment deduction: $3,022 (reported on 3.2% of returns)
61046:
$3,022
Illinois:
$3,087
Self-employed pension: $7,133 (reported on 1.1% of returns)
Here:
$7,133
Illinois:
$16,965
Total itemized deductions: $18,282 (23% of AGI, reported on 25.8% of returns)
Here:
$18,282
State:
$20,239
Here:
22.7% of AGI
State:
19.5% of AGI
(% of AGI for various income ranges: 31.9% for AGIs below $10k, 11.3% for AGIs $10k-25k, 10.9% for AGIs $25k-50k, 9.5% for AGIs $50k-75k, 12.2% for AGIs $75k-100k, 11.7% for AGIs over 100k)
Charity contributions deductions: $3,694 (4% of AGI, reported on 22.6% of returns)
Here:
$3,694
State:
$3,719
Here:
4.3% of AGI
State:
3.4% of AGI
(% of AGI for various income ranges: 1.3% for AGIs $10k-25k, 1.3% for AGIs $25k-50k, 1.8% for AGIs $50k-75k, 1.8% for AGIs $75k-100k, 3.2% for AGIs over 100k)
Total tax: $6,338 (reported on 73.3% of returns)
61046:
$6,338
State:
$9,882
(% of AGI for various income ranges: 6.2% for AGIs below $10k, 4.2% for AGIs $10k-25k, 6.8% for AGIs $25k-50k, 8.7% for AGIs $50k-75k, 11.1% for AGIs $75k-100k, 19.1% for AGIs over 100k)
Earned income credit: $1,430 (reported on 10.9% of returns)
Here:
$1,430
State:
$1,788
Percentage of individuals using paid preparers for their 2004 taxes: 70.2%
Here:
70%
State:
61%
(% for various income ranges: 62.8% for AGIs below $10k, 66.9% for AGIs $10k-25k, 71.7% for AGIs $25k-50k, 78.2% for AGIs $50k-75k, 73.6% for AGIs $75k-100k, 80.7% for AGIs over 100k)
Household received Food Stamps/SNAP in the past 12 months: 173 Household did not receive Food Stamps/SNAP in the past 12 months: 998
Women who had a birth in the past 12 months: 38 (24 now married, 13 unmarried) Women who did not have a birth in the past 12 months: 347 (164 now married, 182 unmarried)
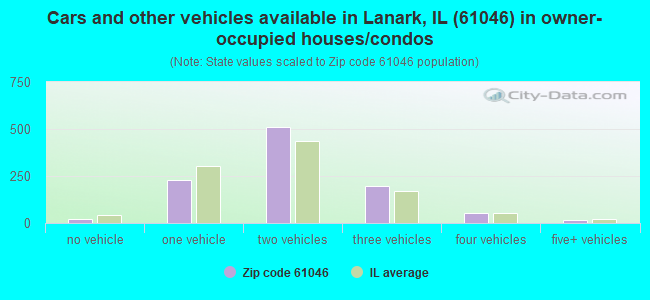
Housing units in zip code 61046 with a mortgage: 461 (27 second mortgage, 16 both second mortgage and home equity loan) Houses without a mortgage: 12
Median monthly owner costs for units with a mortgage: $1,291 Median monthly owner costs for units without a mortgage: $528
Residents with income below the poverty level in 2022:
This zip code:
9.0%
Whole state:
11.9%
Residents with income below 50% of the poverty level in 2022:
This zip code:
5.1%
Whole state:
5.7%
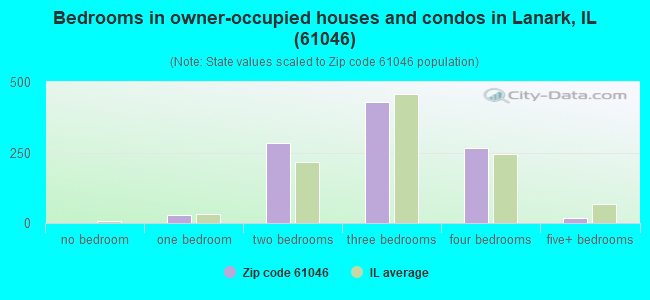
Median number of rooms in houses and condos:
Here:
6.8
State:
6.4
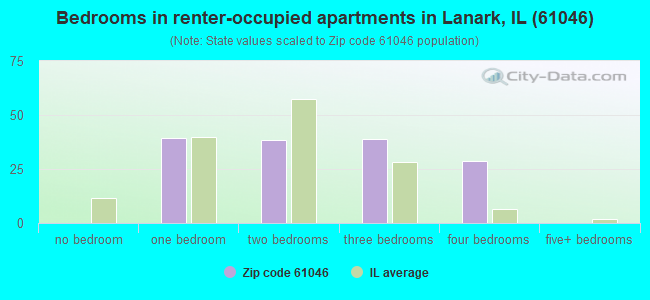
Median number of rooms in apartments:
Here:
5.5
State:
4.1
Notable locations in this zip code not listed on our city pages
Churches in zip code 61046 include: Cherry Grove Church of the Brethren (A), Church of the Brethren (B), Faith Reformed Church (C), Lanark United Methodist Church (D), Trinity Lutheran Church (E). Display/hide their locations on the map
Cemeteries: Wolf Cemetery (1), Schriner Cemetery (2), Lanark City Cemetery (3), Cherry Grove Brethern Cemetery (4), Brookville Lutheran Cemetery (5). Display/hide their locations on the map
In group quarters: 13 (-1 institutionalized population)
Size of family households: 540 2-persons, 176 3-persons, 72 4-persons, 38 5-persons, 21 6-persons, 6 7-or-more-persons
Size of nonfamily households: 273 1-person, 40 2-persons, 3 3-persons
338 married couples with children.
111 single-parent households (27 men, 84 women).
96.1% of residents of 61046 zip code speak English at home.
3.9% of residents speak other Indo-European language at home (100% very well).
0.4% of residents speak other language at home (100% very well).
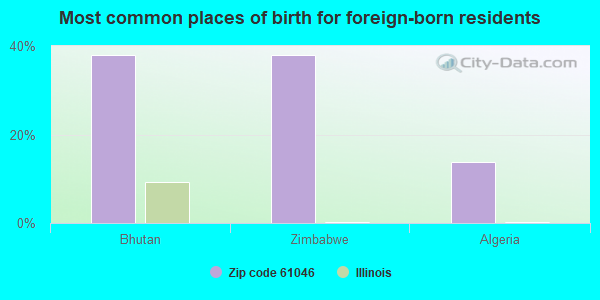
Foreign born population: 29 (1.1%) (100.0% of them are naturalized citizens)
This zip code:
1.1%
Whole state:
14.4%
38%Bhutan
38%Zimbabwe
14%Algeria
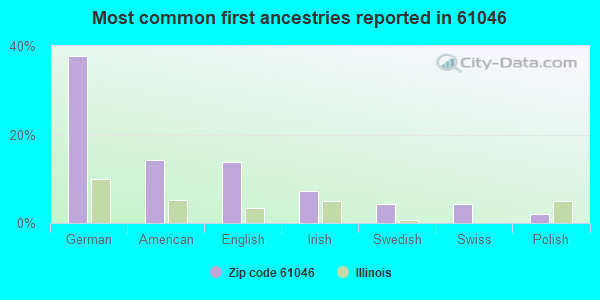
38%German
14%American
14%English
7%Irish
4%Swedish
4%Swiss
2%Polish
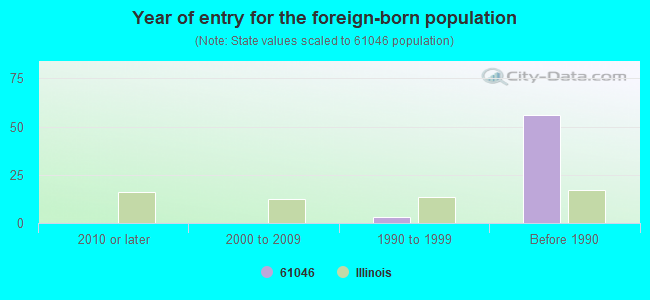
Year of entry for the foreign-born population
02010 or later
02000 to 2009
31990 to 1999
56Before 1990
Major facilities with environmental interests located in this zip code:
LOBERG EXCAVATING INC (NW CORNER OF ILLINOIS ROUTES 72 AND 73 in LANARK, IL)
STATE MASTER (Illinois EPA Project) - AIR PROGRAM AIR MINOR (AIRS/AFS) CRITERIA AND HAZARDOUS AIR POLLUTANT INVENTORY (Inventory of air pollution sources) Business SIC classification: CRUSHED AND BROKEN LIMESTONE
ROGERS OIL CO (RT 64 & 52 in LANARK, IL)
STATE MASTER (Illinois EPA Project) - AIR PROGRAM AIR MINOR (AIRS/AFS) Business SIC classification: PETROLEUM BULK STATIONS AND TERMINALS
HOLLEWELL ENTERPRISES INC (JUNCTION IL RT 72 & 73 in LANARK, IL)
STATE MASTER (Illinois EPA Project) - AIR PROGRAM AIR MINOR (AIRS/AFS) Business SIC classification: FARM SUPPLIES
LANARK (108 W CARROLL in LANARK, IL)
STATE MASTER (Illinois EPA Project) - DRINKING WATER PROGRAM National Pollutant Discharge Elimination System NON-MAJOR (Tracking pollutant discharge elimination systems) - permit Business SIC classification: SEWERAGE SYSTEMS Alternative names: LANARK SOUTH STP, CITY OF, LANARK STP
LANARK SOUTH STP (U S ROUTE 52 in LANARK, IL)
STATE MASTER (Illinois EPA Project) - National Pollutant Discharge Elimination System Permit National Pollutant Discharge Elimination System NON-MAJOR (Tracking pollutant discharge elimination systems) - permit Business SIC classification: SEWERAGE SYSTEMS Alternative names: LANARK SOUTH SEWAGE TREATMENT PLANT CITY OF, LANARK SOUTH STP, CITY OF
MEDALLION CABINETRY (105 N ROCHESTER in LANARK, IL)
STATE MASTER (Illinois EPA Project) - AIR PROGRAM AIR MINOR (AIRS/AFS) Business SIC classification: WOOD HOUSEHOLD FURNITURE, UPHOLSTERED
MIDSTATES ENERGY RESOURCES (RR #2 BOX 3A in LANARK, IL)
STATE MASTER (Illinois EPA Project) - AIR PROGRAM AIR MINOR (AIRS/AFS) Business SIC classification: INDUSTRIAL ORGANIC CHEMICALS
OREGON STONE INC (RURAL in LANARK, IL)
STATE MASTER (Illinois EPA Project) - AIR PROGRAM AIR MINOR (AIRS/AFS) Business SIC classification: CUT STONE AND STONE PRODUCTS
BOB PROPHETER AGGREGATES LLC (RT 52/64 & CH3 in LANARK, IL)
STATE MASTER (Illinois EPA Project) - AIR PROGRAM AIR MINOR (AIRS/AFS) Business SIC classification: CRUSHED AND BROKEN LIMESTONE Alternative names: BOB PROPHETER EQUIPTMENT LLC, BROOKVILLE QUARRY
QUALITY CONCRETE CO (722 N BROAD in LANARK, IL)
STATE MASTER (Illinois EPA Project) - AIR PROGRAM AIR MINOR (AIRS/AFS) Business SIC classification: READY-MIXED CONCRETE
ROY POFFENBERGER (204 W PRAIRIE ST in LANARK, IL)
STATE MASTER (Illinois EPA Project) - AIR PROGRAM AIR MINOR (AIRS/AFS) Business SIC classification: NONCLASSIFIABLE ESTABLISHMENTS
GTE TELEPHONE (120 E LOCUST ST in LANARK, IL)
(Resource Conservation and Recovery Act (tracking hazardous waste))
HUNTER HAVEN DAIRY FARM (SR 73 in LANARK, IL)
National Pollutant Discharge Elimination System NON-MAJOR (Tracking pollutant discharge elimination systems) - permit
Housing units lacking complete plumbing facilities: 1.5% Housing units lacking complete kitchen facilities: 2.1%
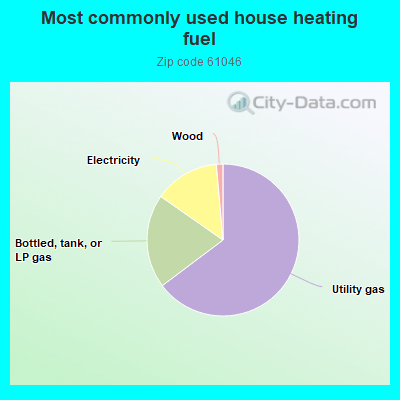
64.8%Utility gas
20.0%Bottled, tank, or LP gas
13.9%Electricity
1.4%Wood
Population in 1990: 1,843. Population change in the 1990s: +1,077 (+58.4%).
Place of birth for U.S.-born residents:
This state: 2,049
Northeast: 55
Midwest: 336
South: 68
West: 43
63% of the 61046 zip code residents lived in the same house 5 years ago. Out of people who lived in different houses, 46% lived in this county. Out of people who lived in different counties, 50% lived in Illinois.
88% of the 61046 zip code residents lived in the same house 1 year ago. Out of people who lived in different houses, 27% moved from this county. Out of people who lived in different houses, 51% moved from different county within same state. Out of people who lived in different houses, 16% moved from different state. Out of people who lived in different houses, 10% moved from abroad.
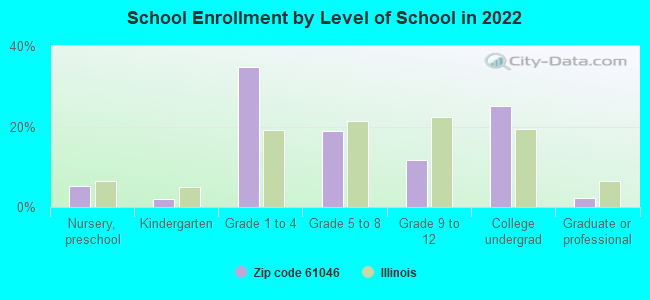
Private vs. public school enrollment:
Students in private schools in grades 1 to 8 (elementary and middle school): 15
Here:
6.5%
Illinois:
13.3%
Students in private schools in grades 9 to 12 (high school): 14
Here:
27.7%
Illinois:
9.9%
Students in private undergraduate colleges: 22
Here:
19.6%
Illinois:
27.4%
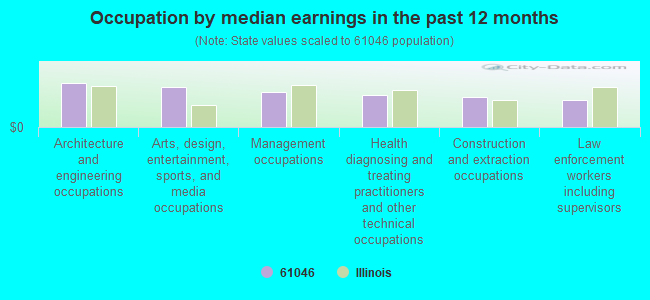
Occupation by median earnings in the past 12 months ($)
103,211Architecture and engineering occupations
94,657Arts, design, entertainment, sports, and media occupations
82,988Management occupations
74,428Health diagnosing and treating practitioners and other technical occupations
69,884Construction and extraction occupations
63,568Law enforcement workers including supervisors
Companies with federal contracts located in this zip code:
ROLLING HILLS PROGRESS CENTER (201 IL RTE 64 in LANARK, IL) : $12,999,978 in 17 contractsfrom 2000 to 2006
Contracts for Ammunition, through 30 mm by Army Signed by year:2000: $266,740; 2001: $948,446; 2002: $4,142,684; 2003: $0; 2004: $3,203,547; 2005: $1,963,457; 2006: $2,475,104.
Biggest contracts:
$2,278,695 with Army for Ammunition, through 30 mm. Signed on 2006-06-02. Completion date: 2007-02-28.
$2,246,986, same as above.Signed on 2002-03-25. Completion date: 2003-01-30.
$1,798,261, same as above.Signed on 2002-06-19. Completion date: 2003-01-30.
$1,589,110, same as above.Signed on 2005-06-09. Completion date: 2004-06-30.
Top industries in this zip code by the number of employees in 2005:
Health Care and Social Assistance: Vocational Rehabilitation Services (50-99 employees: 2 establishments)
Other Services (except Public Administration): Other Similar Organizations (except Business, Professional, Labor, and Political Organizations) (50-99: 1)
Wholesale Trade: Farm and Garden Machinery and Equipment Merchant Wholesalers (20-49: 1)
Construction: New Single-Family Housing Construction (except Operative Builders) (10-19: 1, 5-9: 2, 1-4: 1)
Other Services (except Public Administration): Business Associations (10-19: 1)
Construction: Commercial and Institutional Building Construction (10-19: 1)
Health Care and Social Assistance: Residential Mental Retardation Facilities (10-19: 1)
Accommodation and Food Services: Full-Service Restaurants (10-19: 1)
People in group quarters in 2010:
16 people in group homes intended for adults
People in group quarters in 2000:
16 people in homes for the mentally retarded
2002 - 2018 National Fire Incident Reporting System (NFIRS) incidents
According to the data from the years 2002 - 2018 the average number of fires per year is 19. The highest number of reported fire incidents - 37 took place in 2012, and the least - 2 in 2014. The data has an increasing trend.
When looking into fire subcategories, the most incidents belonged to: Structure Fires (42.1%), and Outside Fires (35.8%).
Fire incident types reported to NFIRS in Zip Code 61046


 Nearest zip codes: 61078, 61051, 61062, 61014, 61053, 61030.


 According to the data from the years 2002 - 2018 the average number of fires per year is 19. The highest number of reported fire incidents - 37 took place in 2012, and the least - 2 in 2014. The data has an increasing trend.
 When looking into fire subcategories, the most incidents belonged to: Structure Fires (42.1%), and Outside Fires (35.8%).